Update: Daily updates have been suspended.
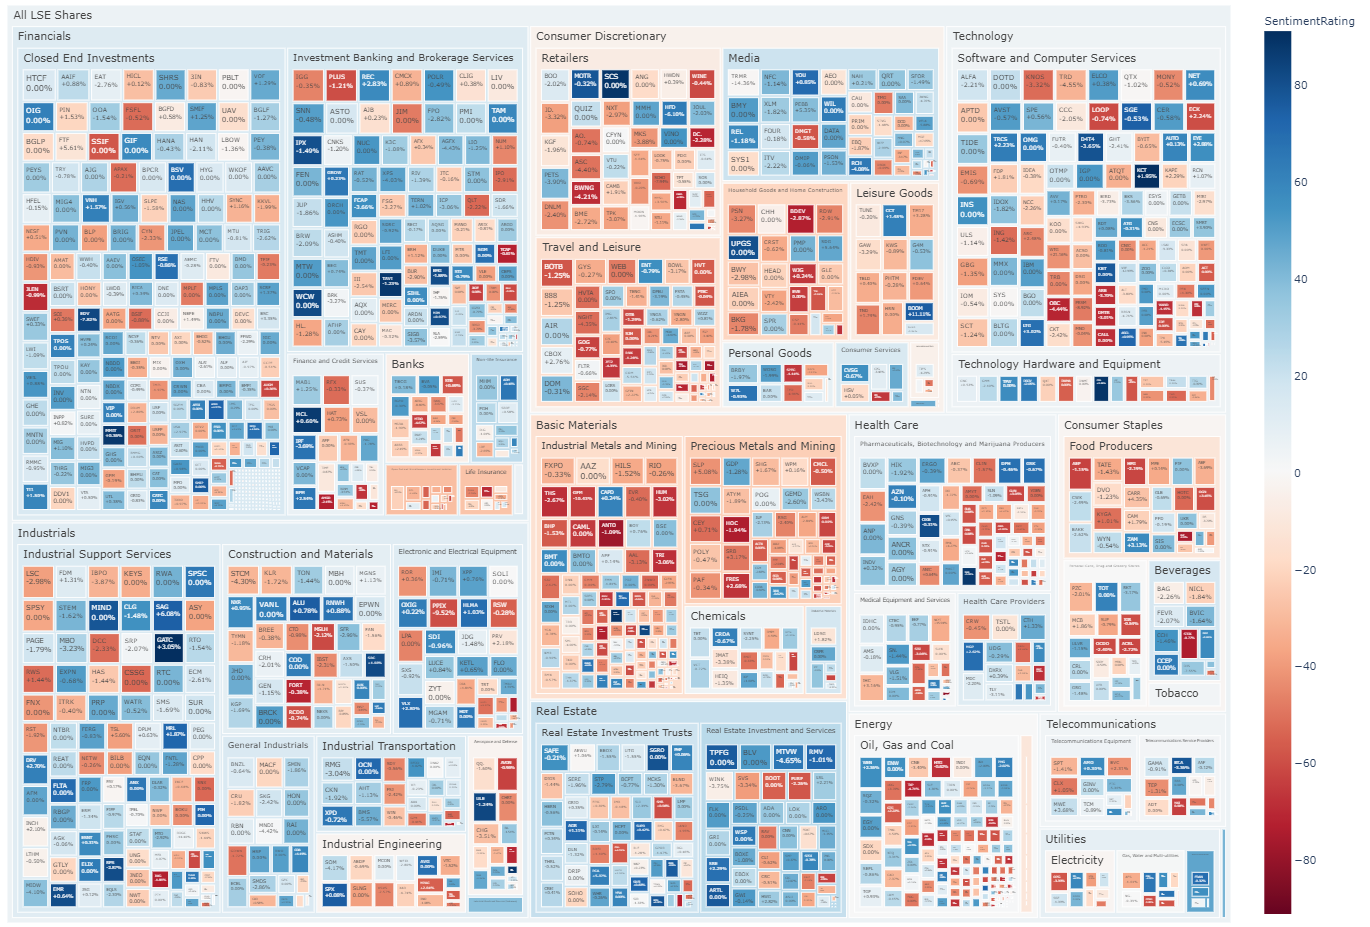
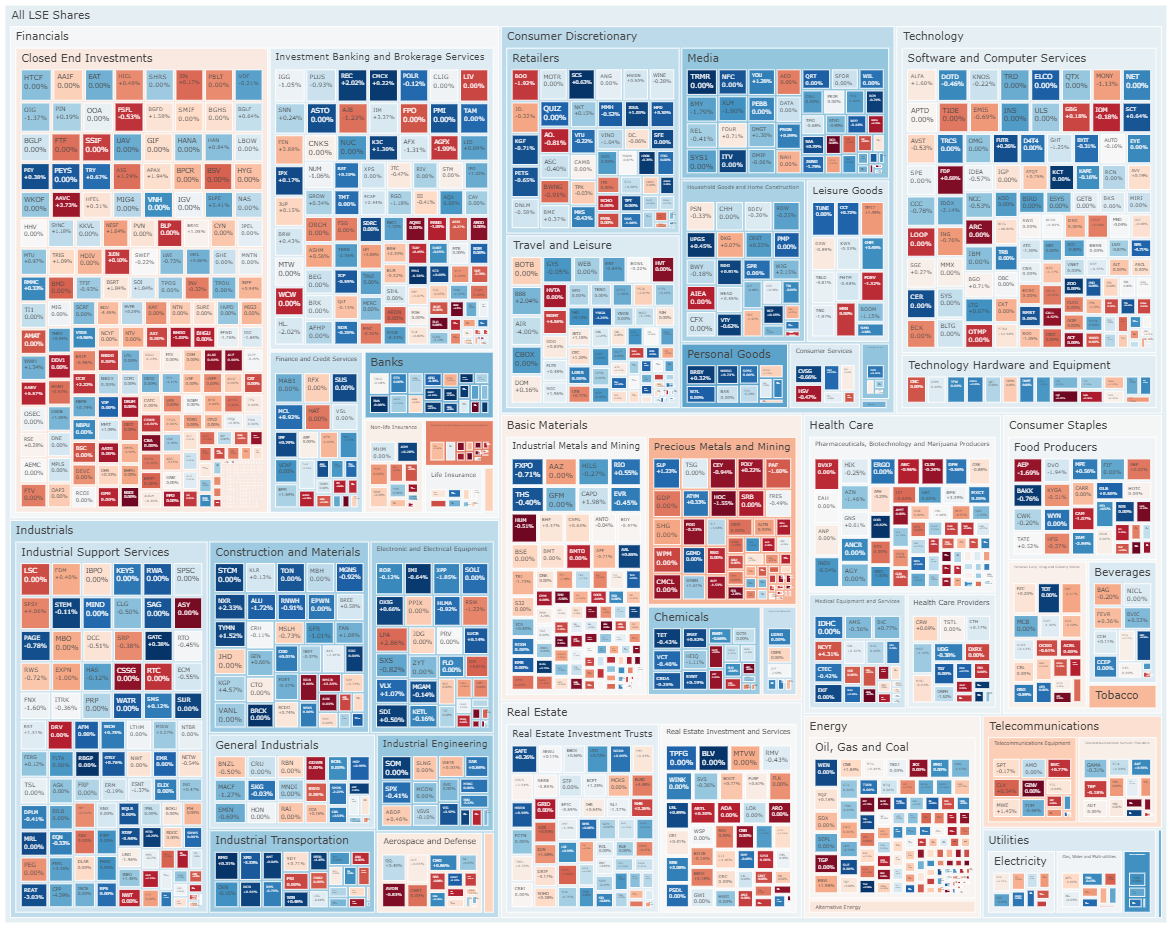
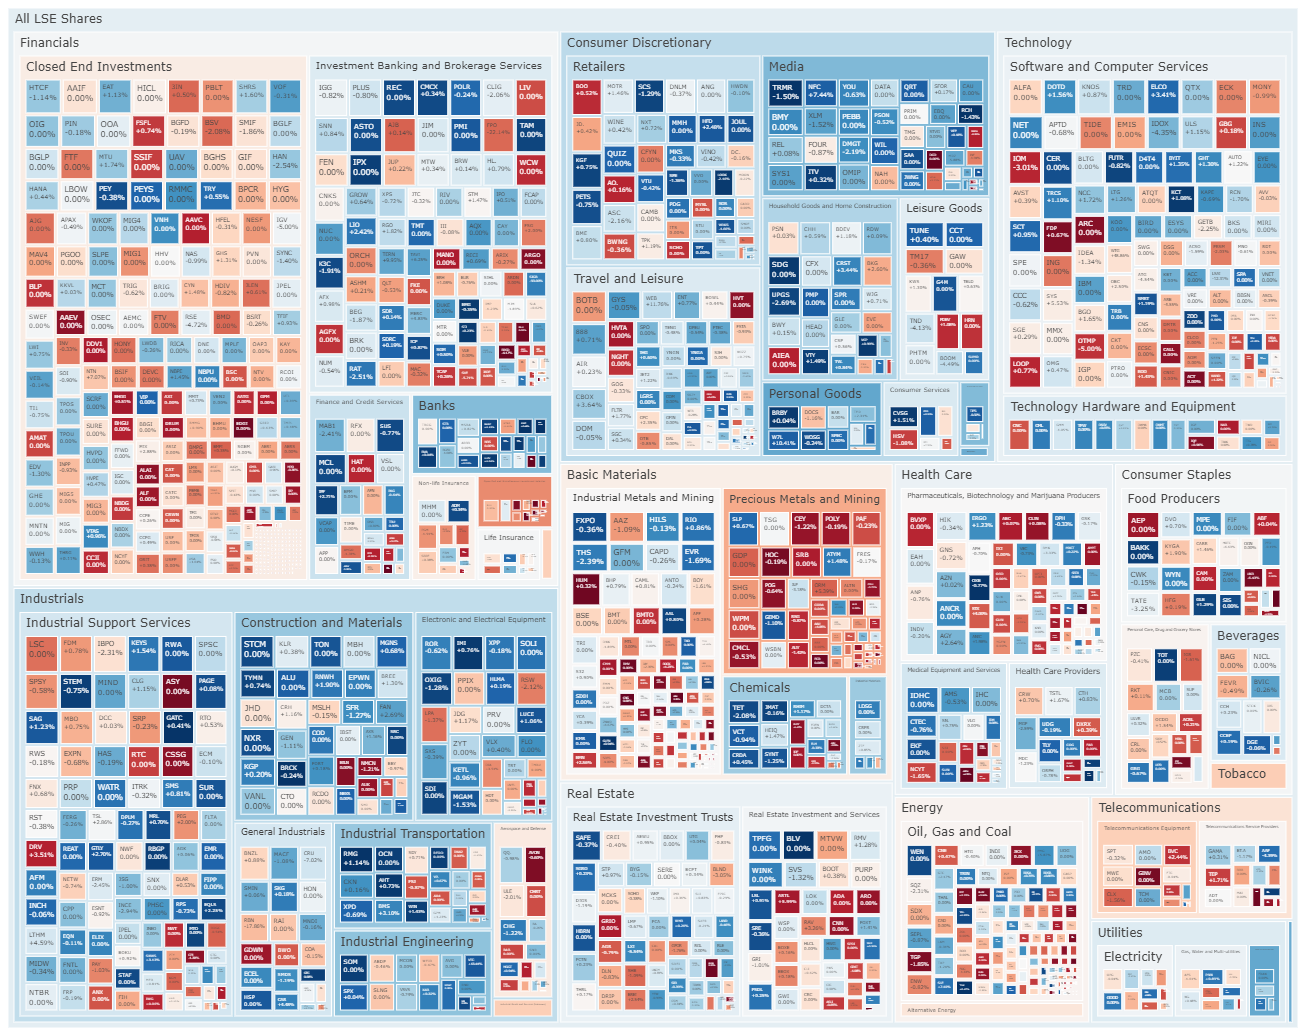
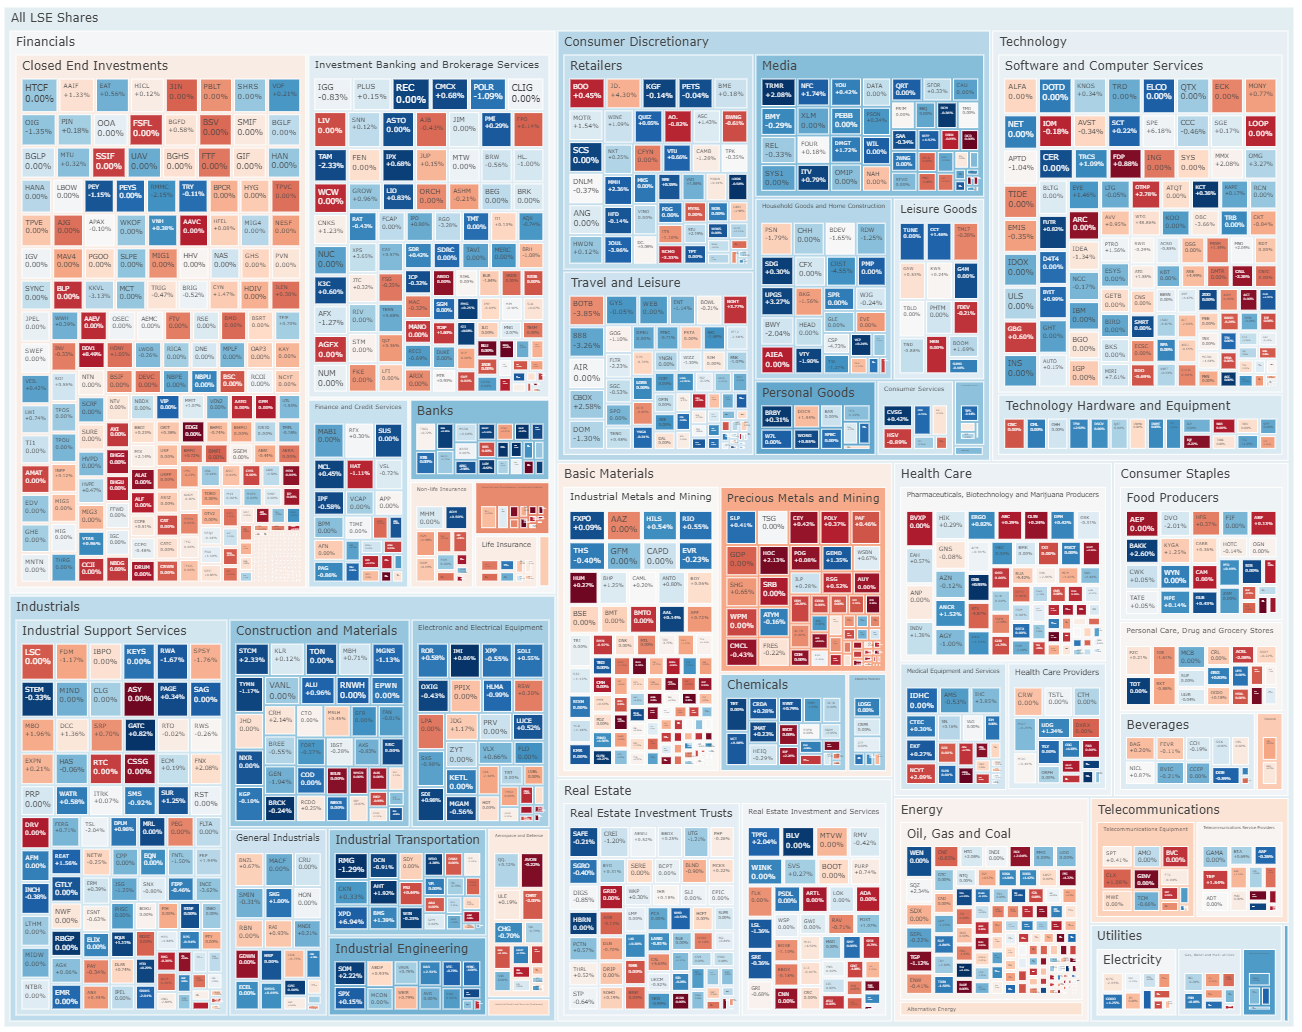
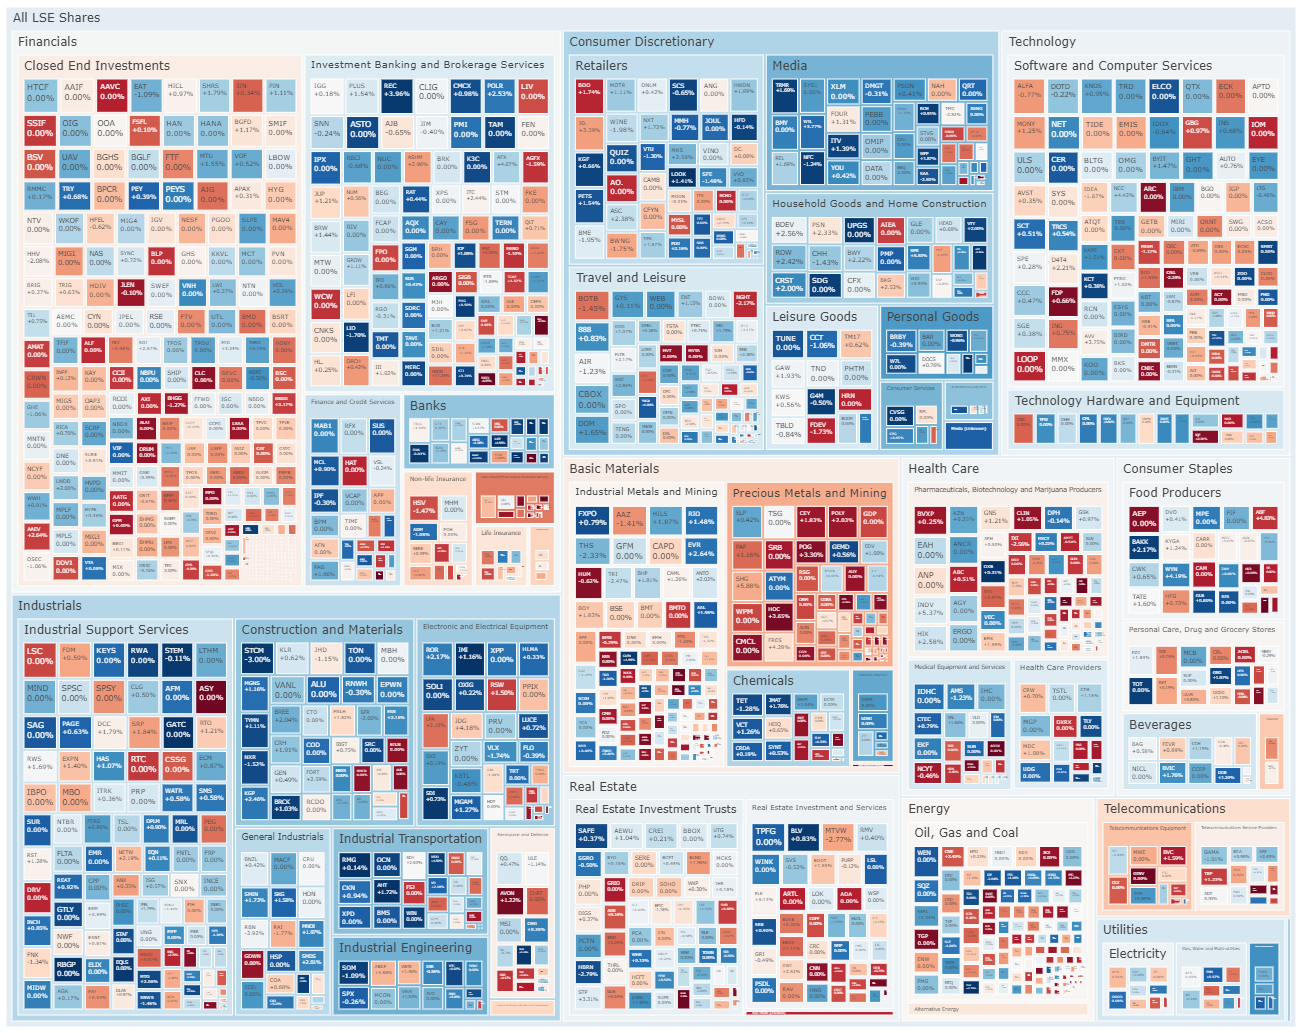
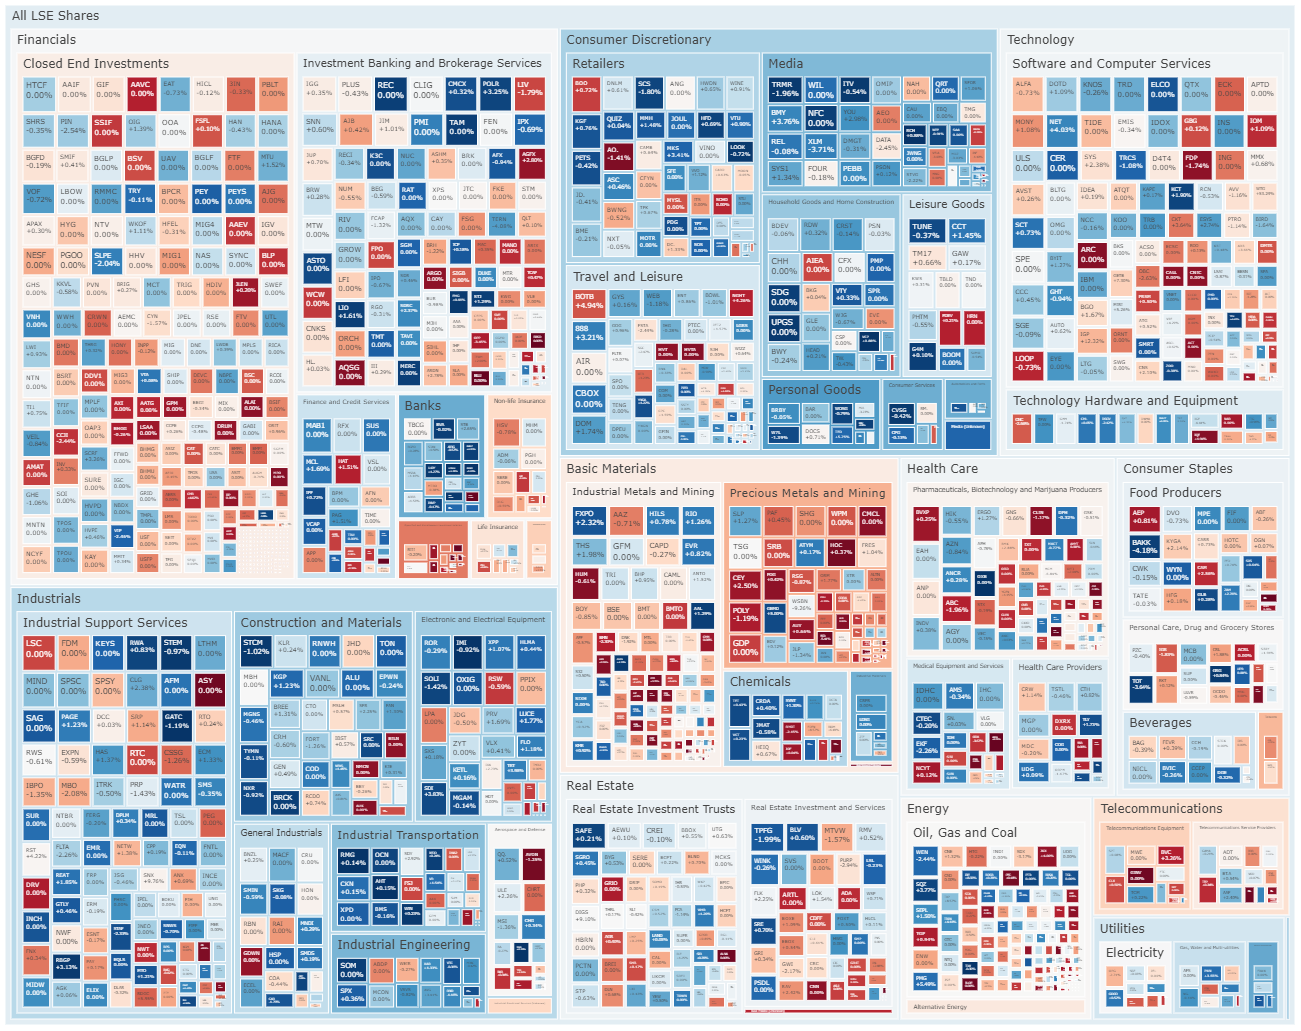
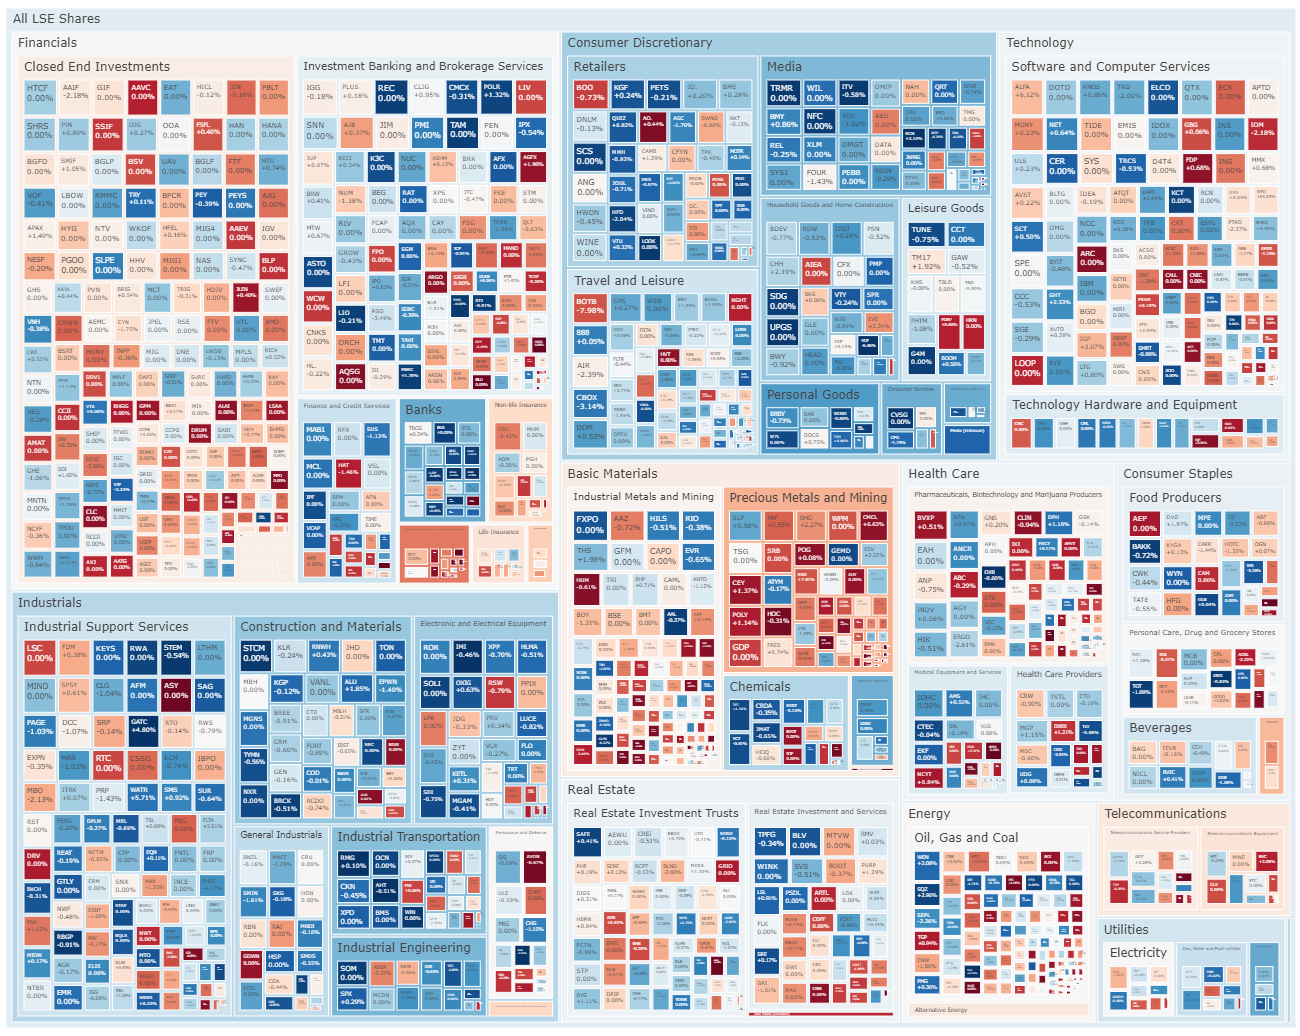
I am a big fan of heatmaps, and I use them a lot to help focus my research.
For those not familiar with heatmaps, here is a definition from Wikipedia:
"A heat map (or heatmap) is a data visualization technique that shows magnitude of a phenomenon as color in two dimensions. The variation in color may be by hue or intensity, giving obvious visual cues to the reader about how the phenomenon is clustered or varies over space"
Source: https://en.wikipedia.org/wiki/Heat_map
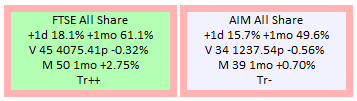
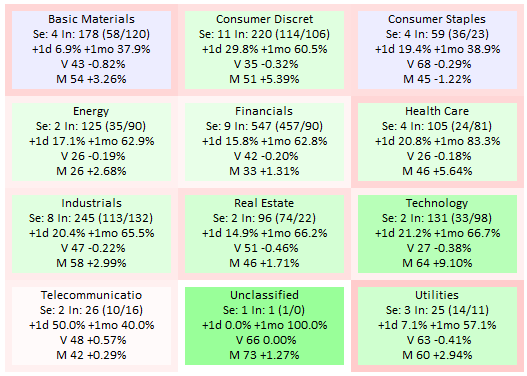
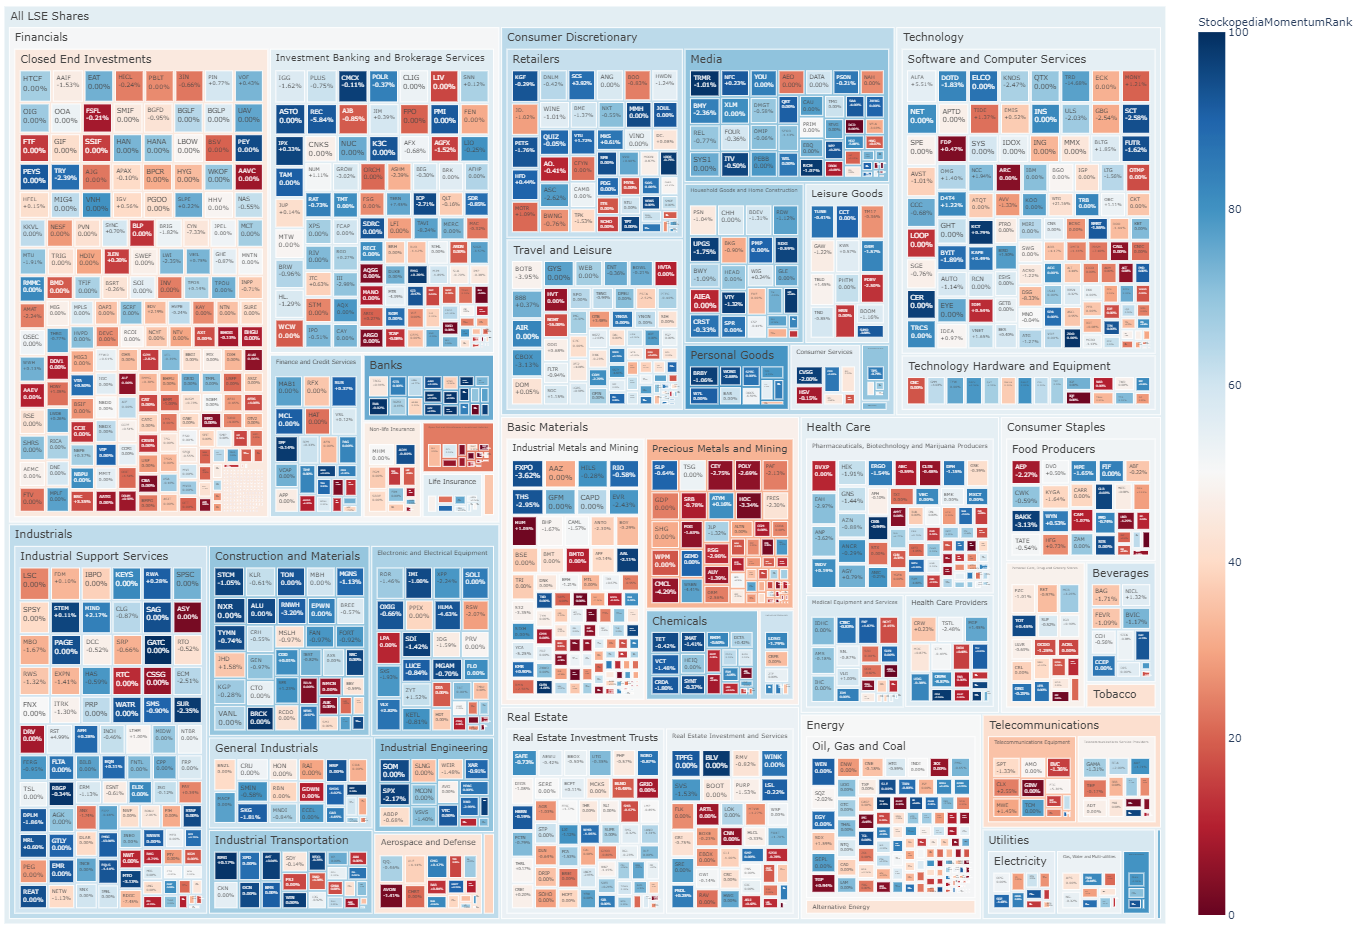
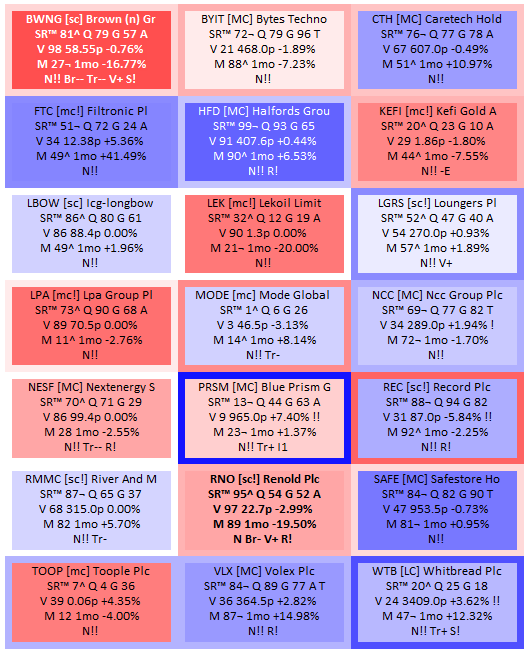
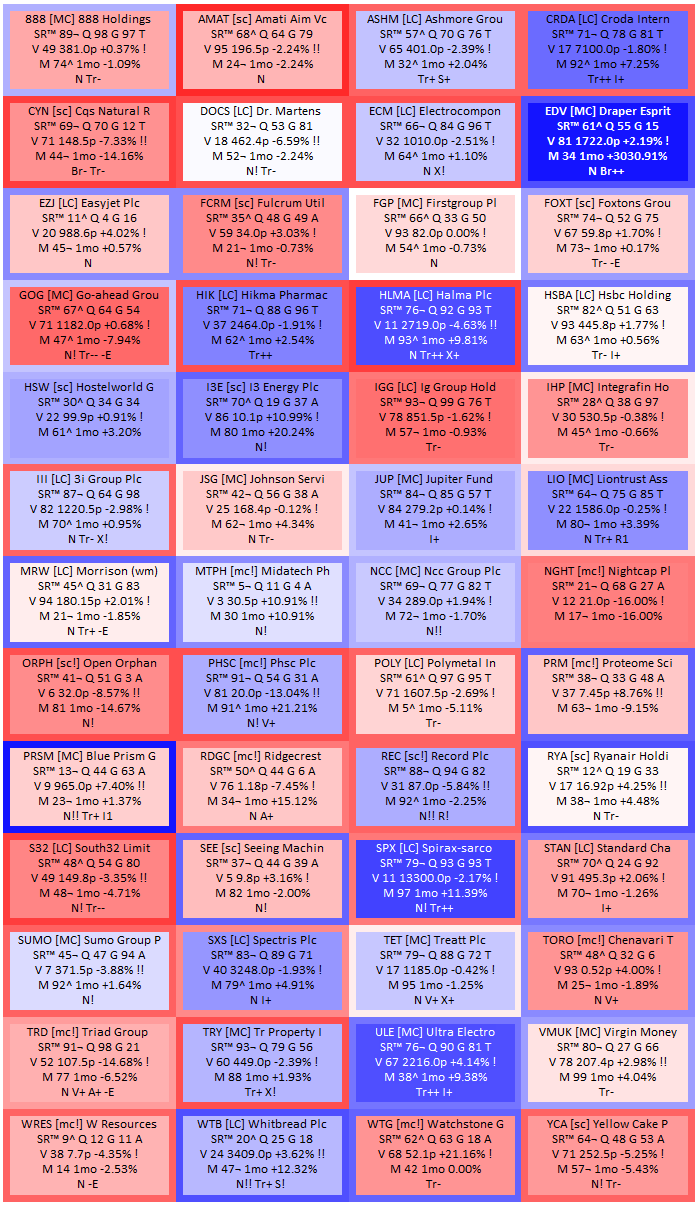
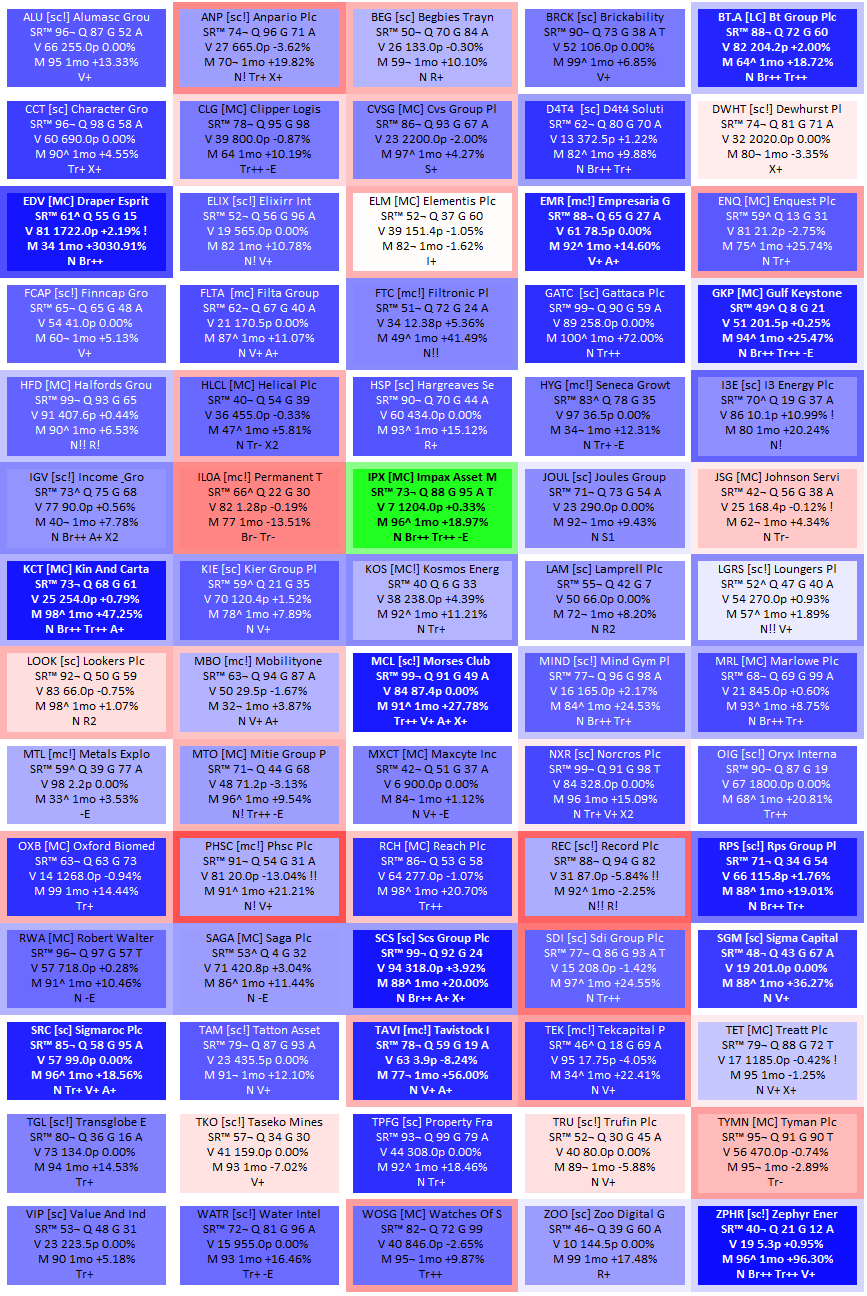
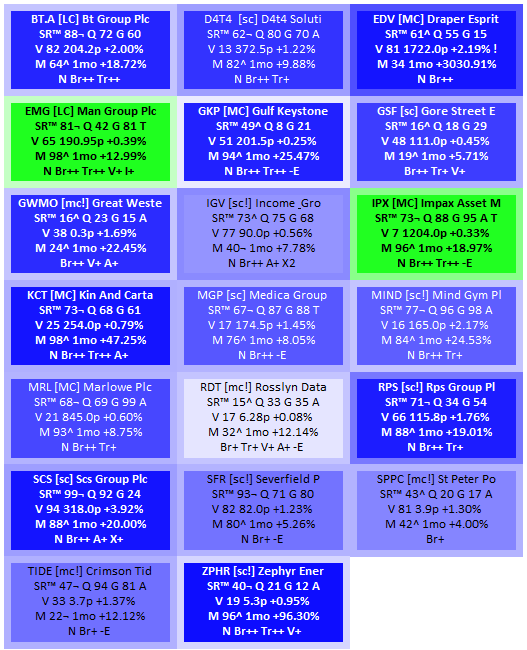
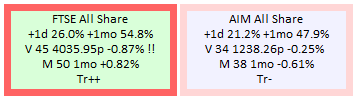
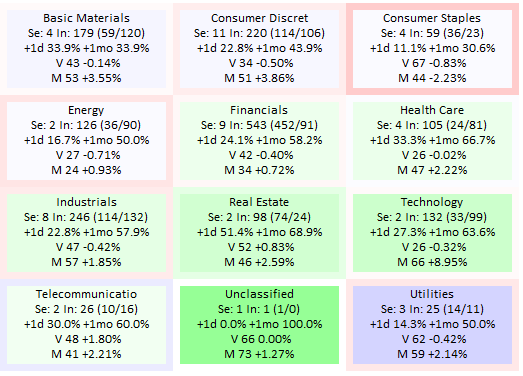
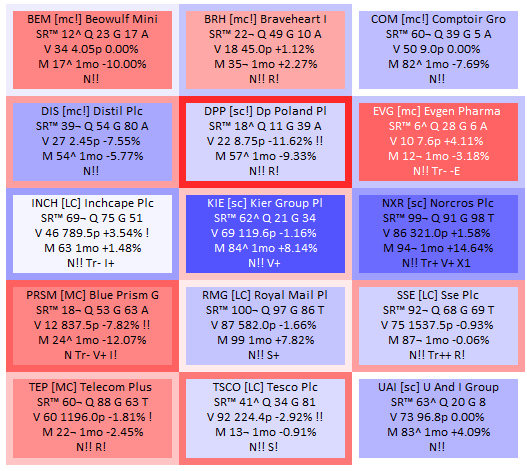
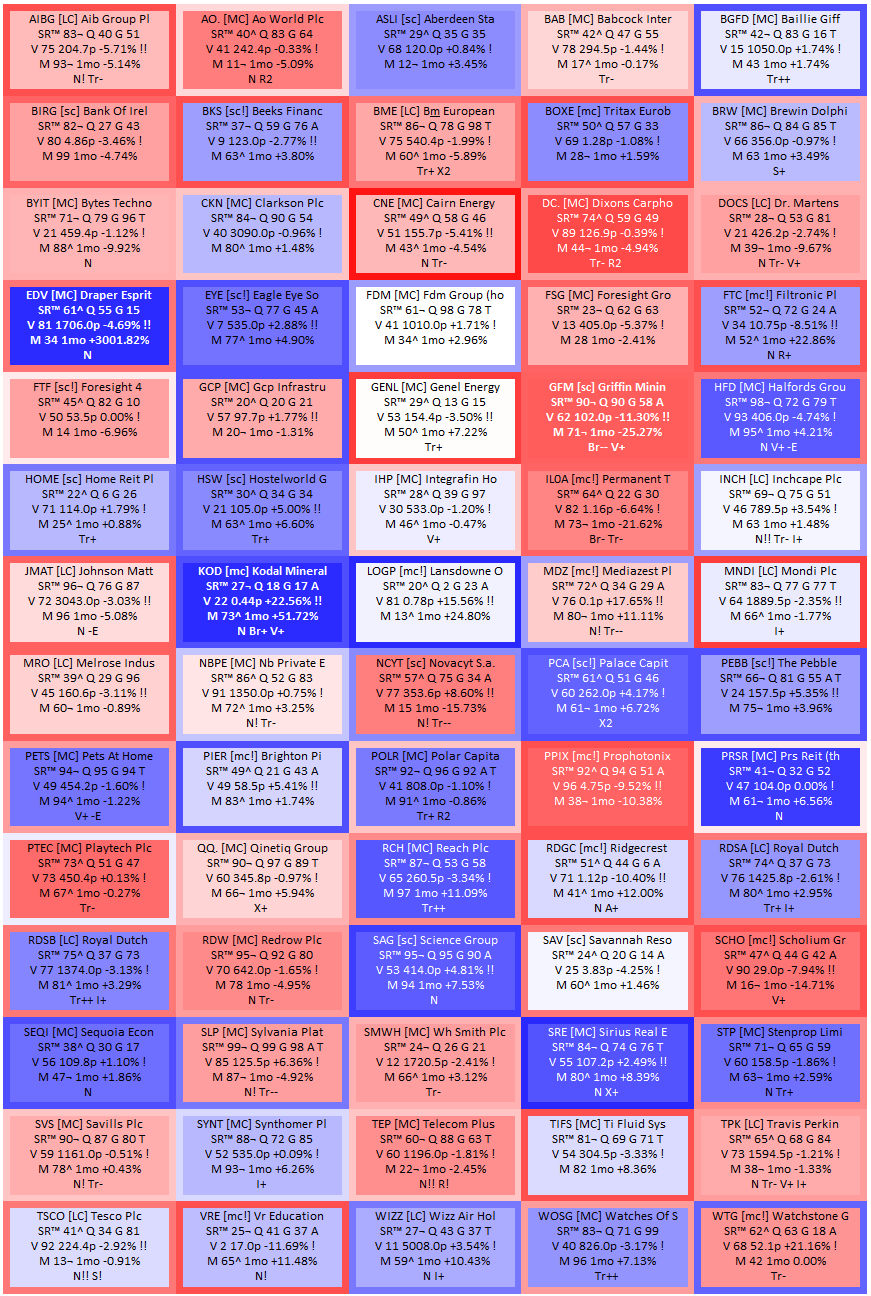
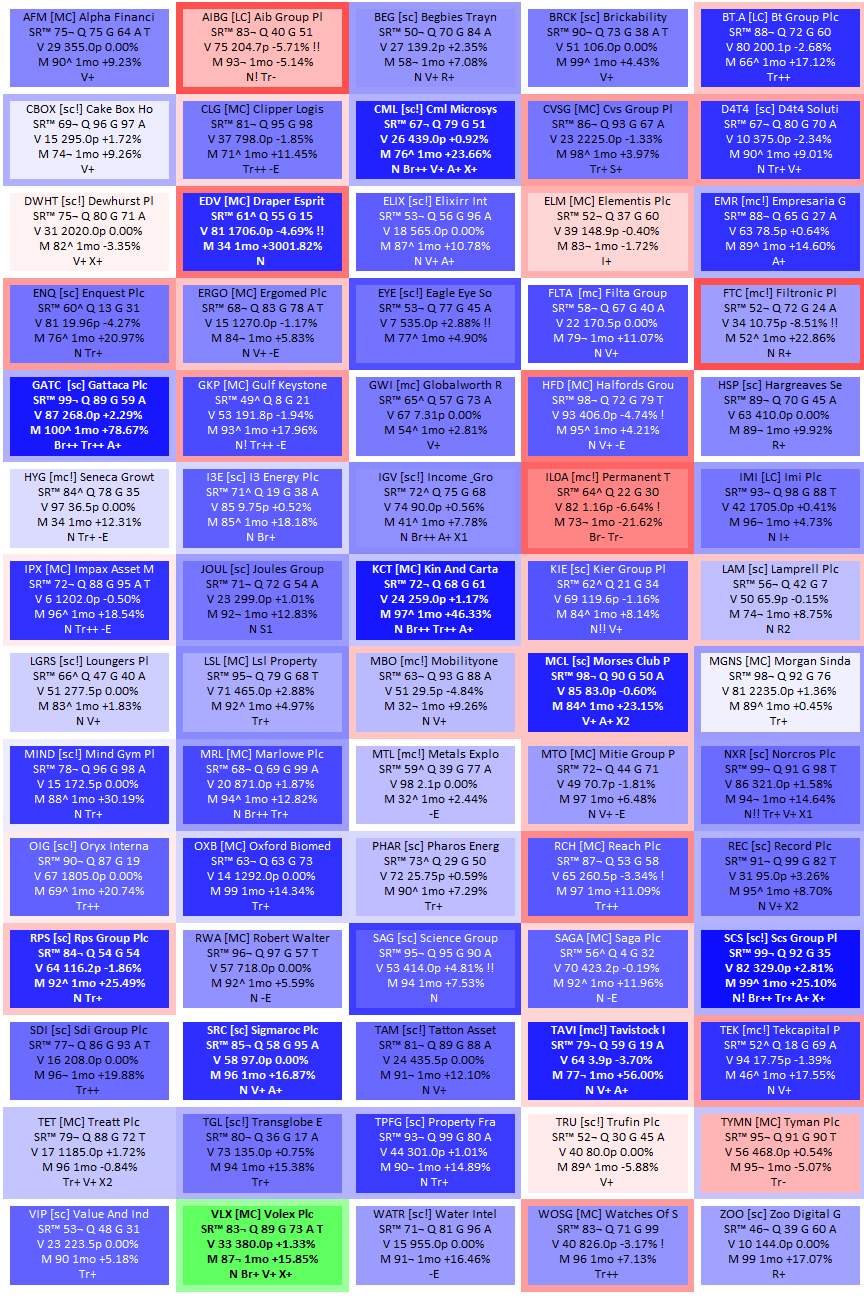
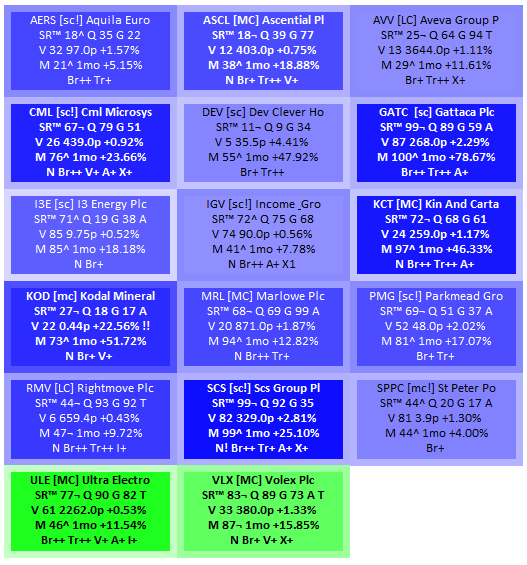
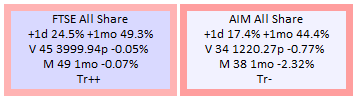
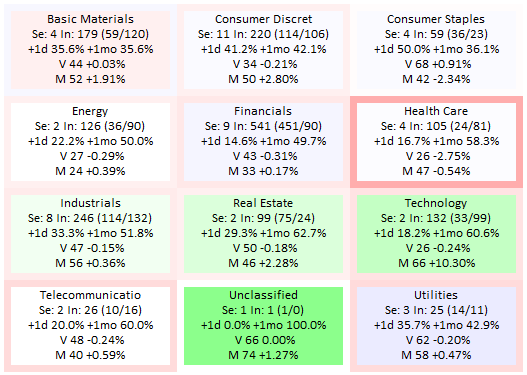
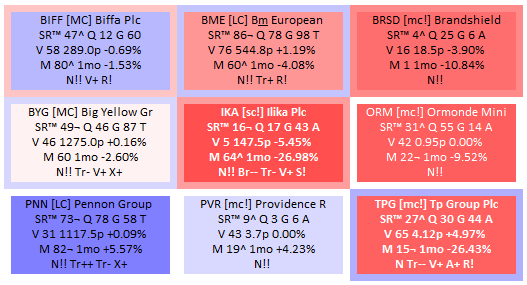
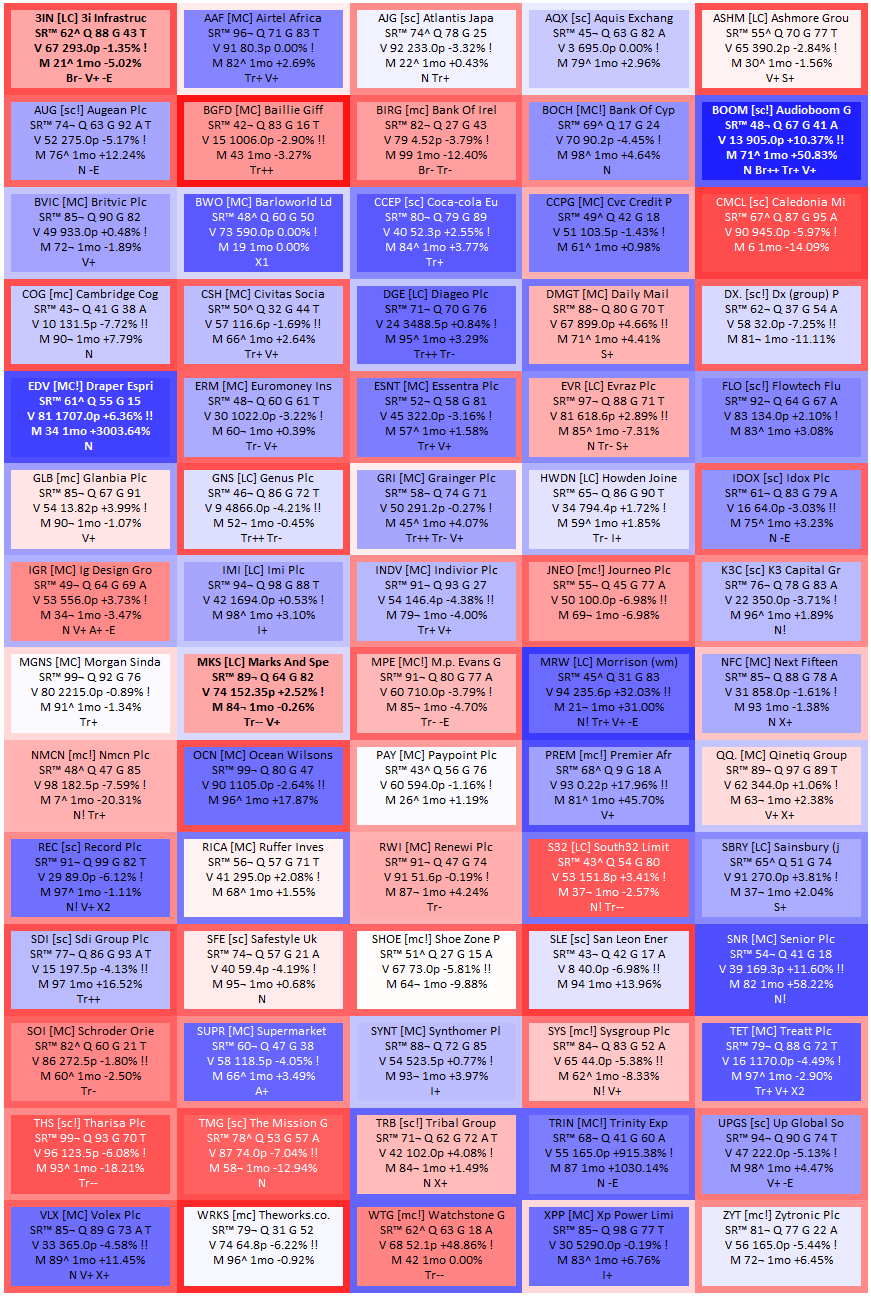
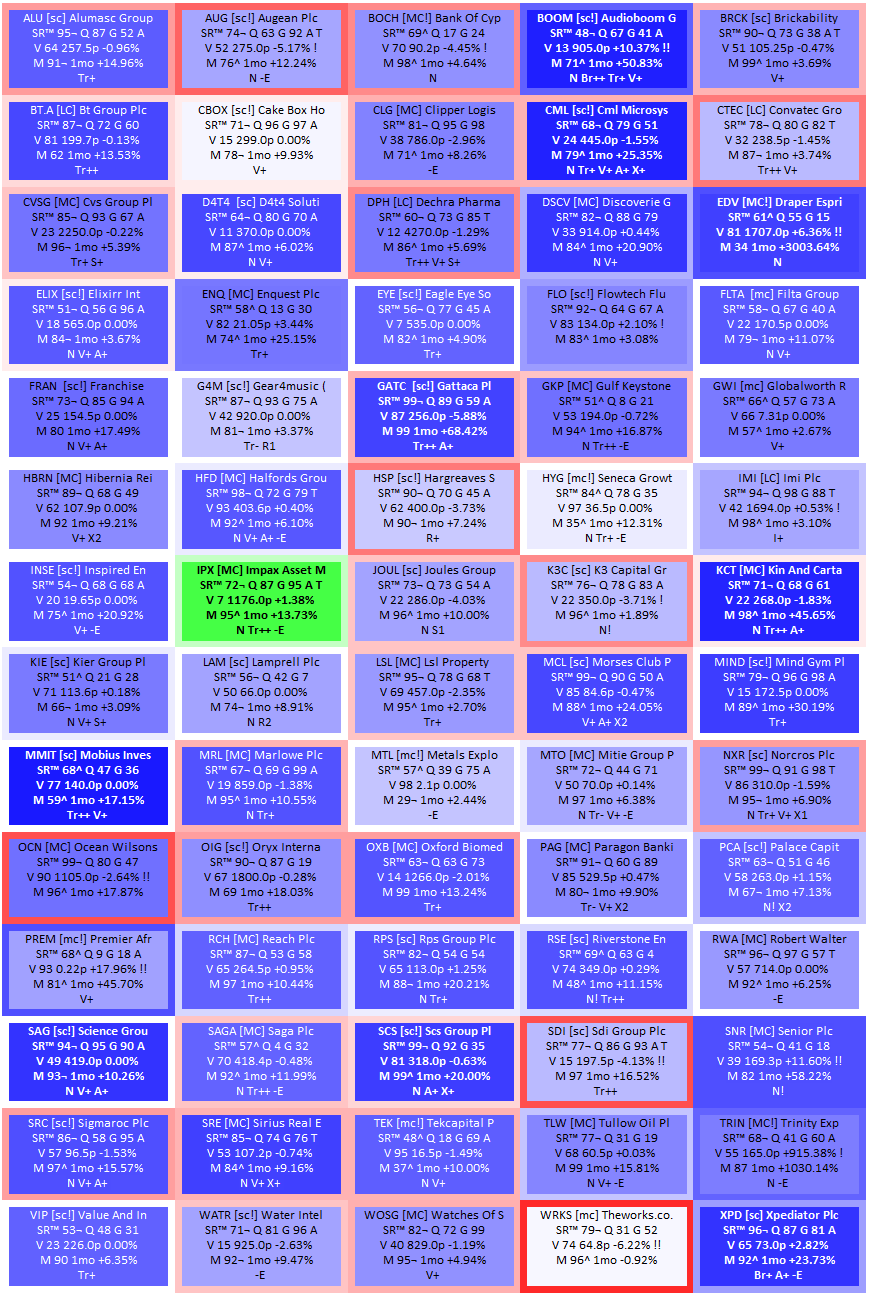
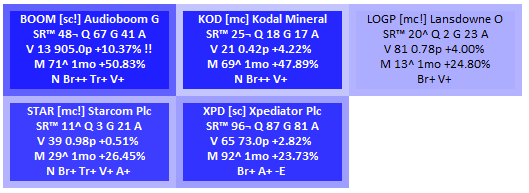
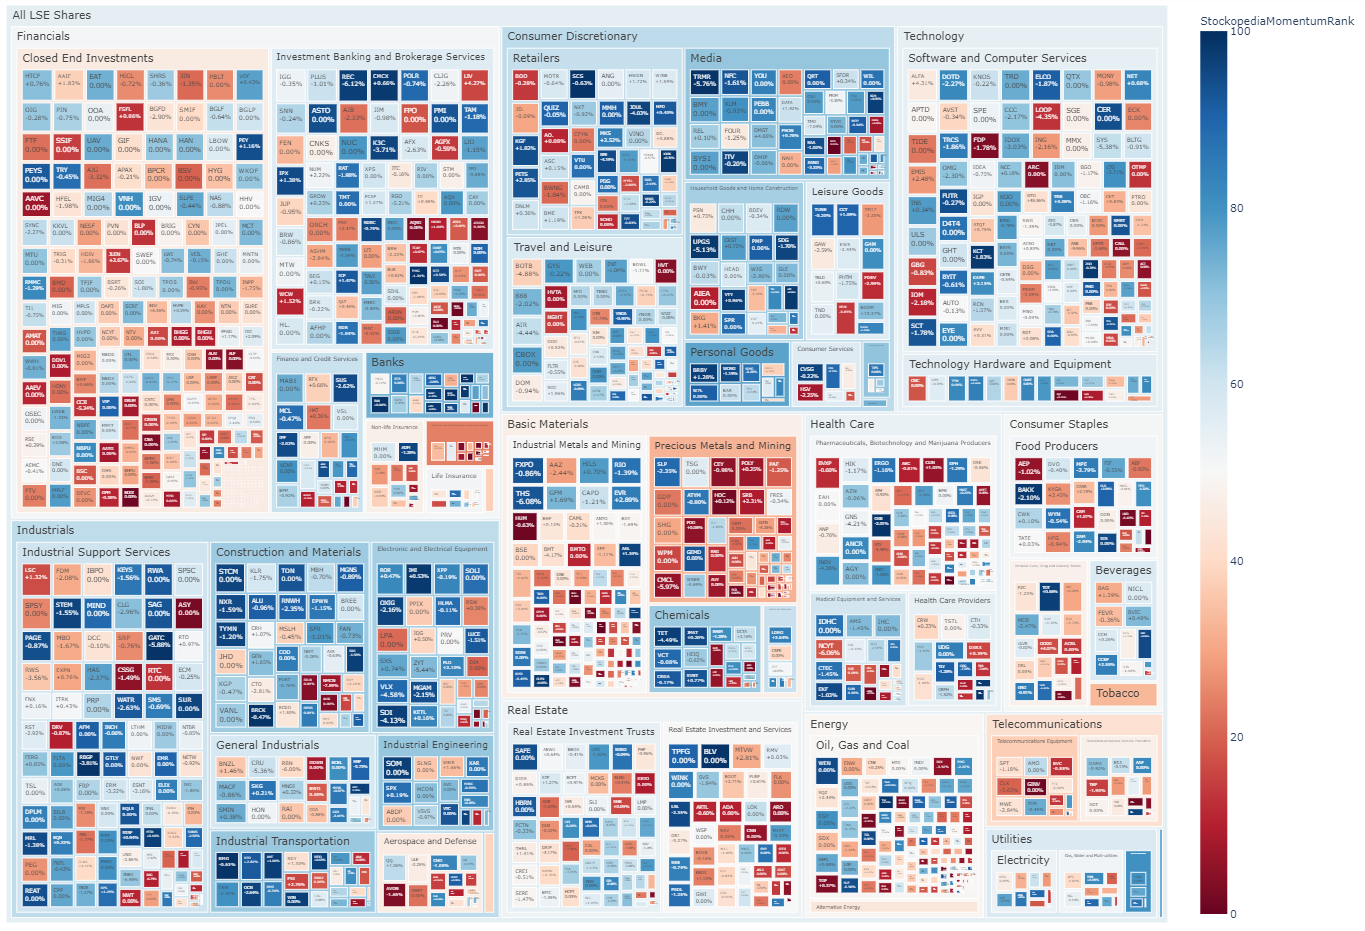
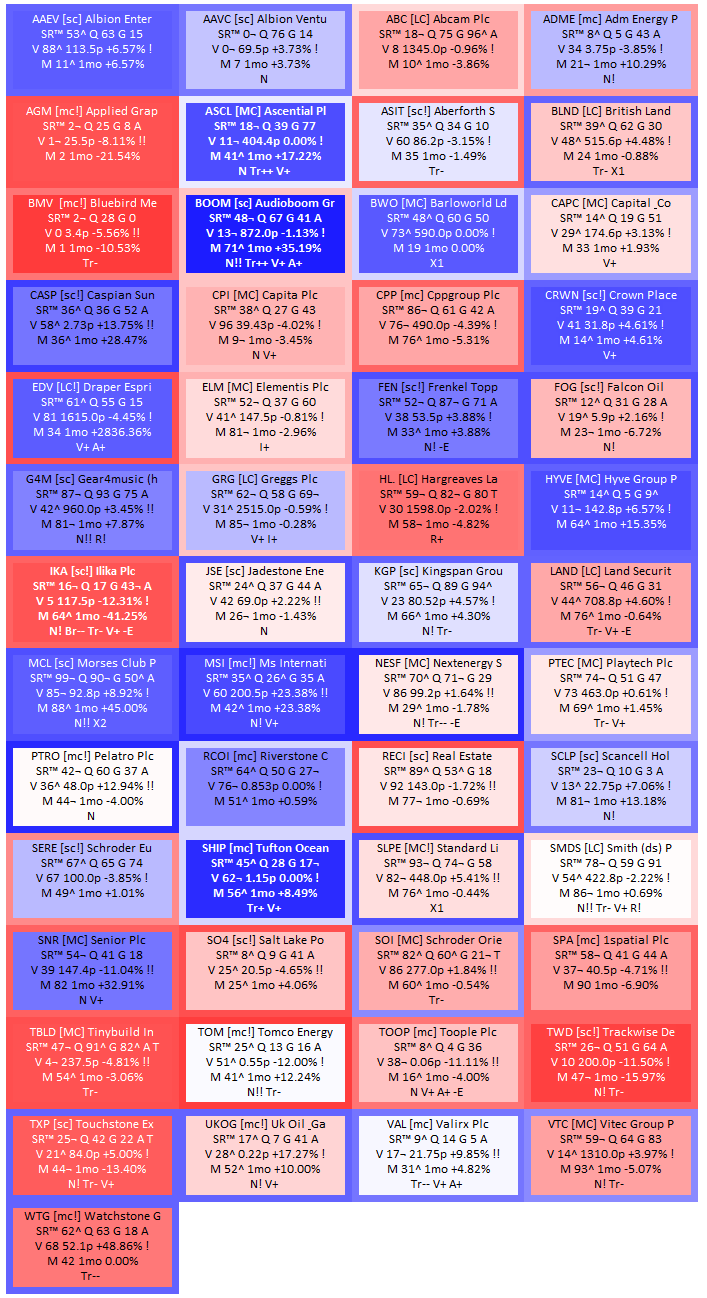
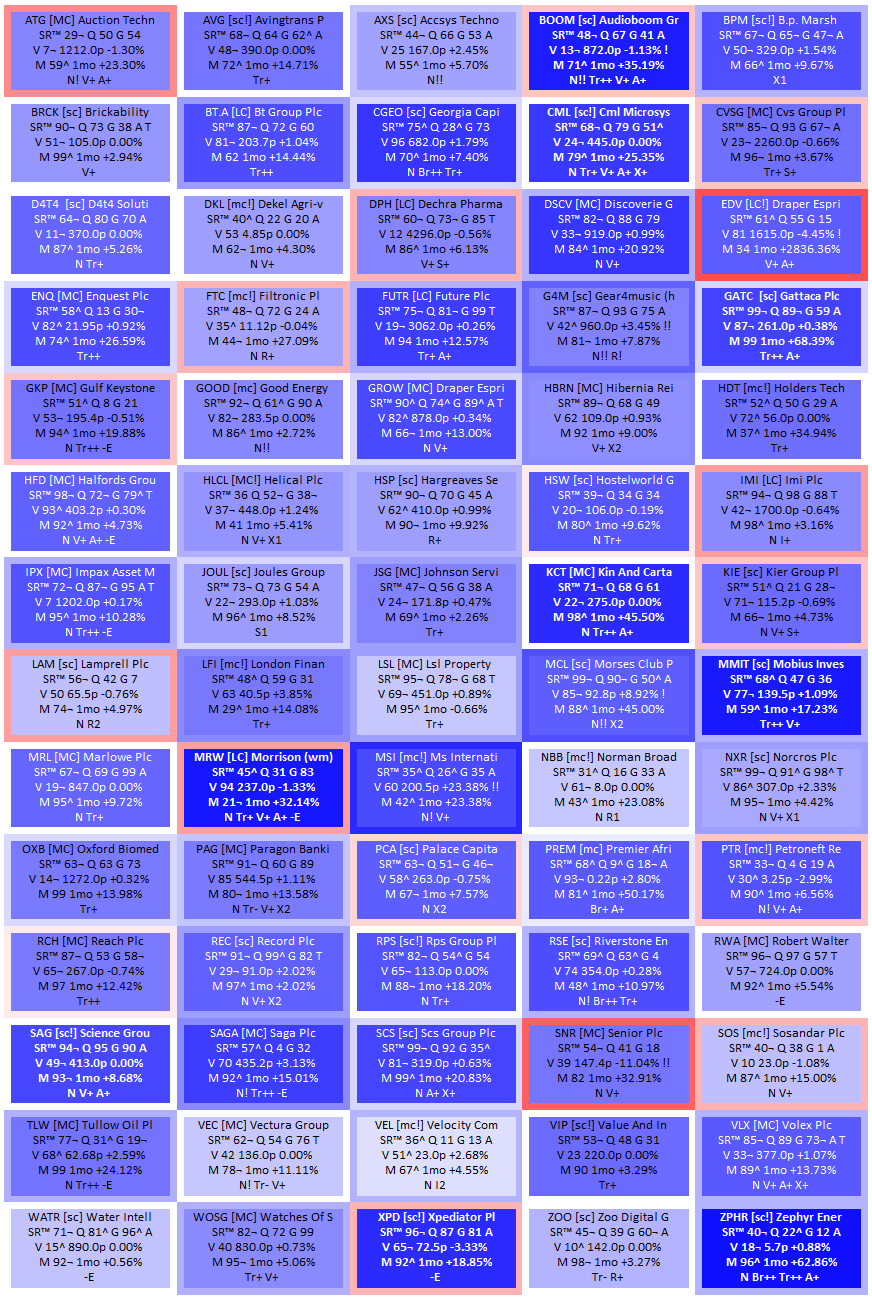
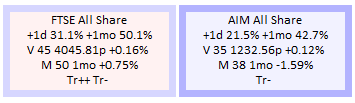
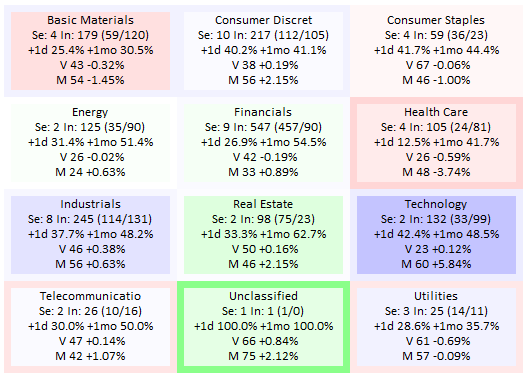
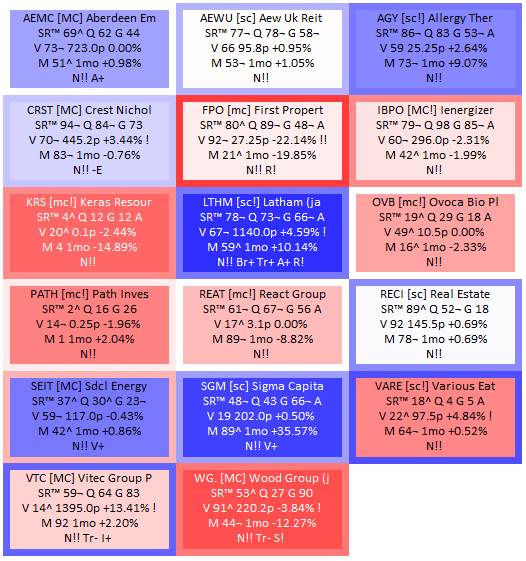
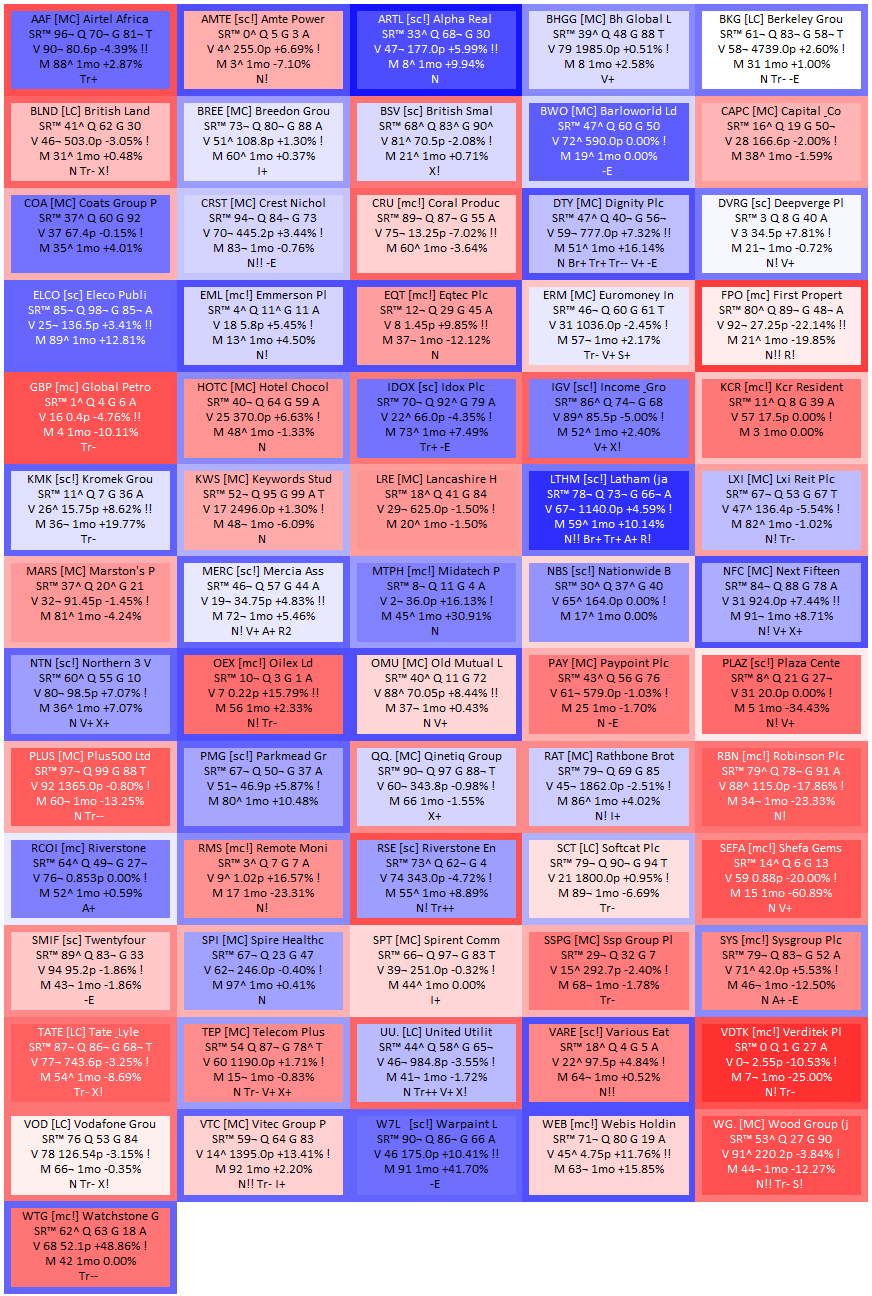
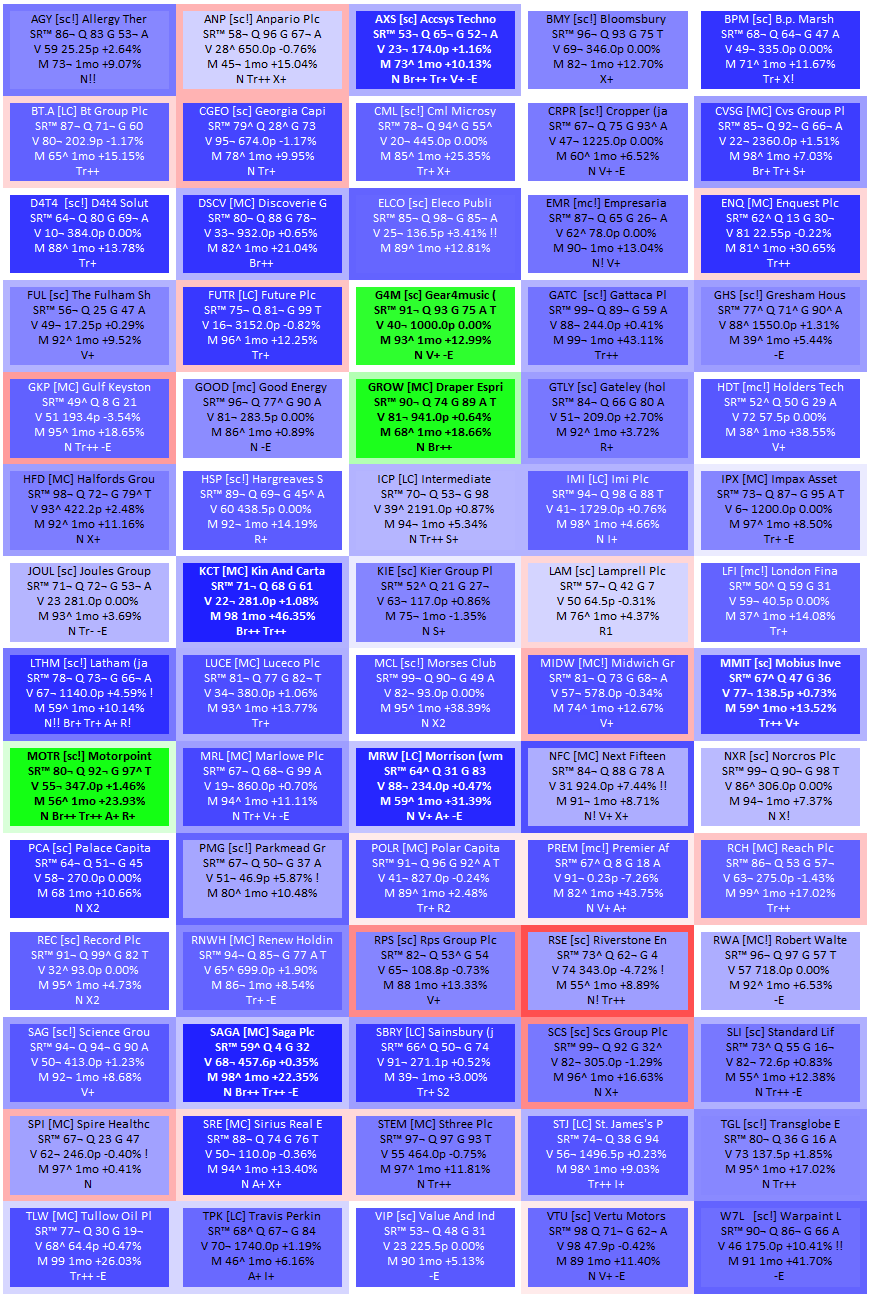
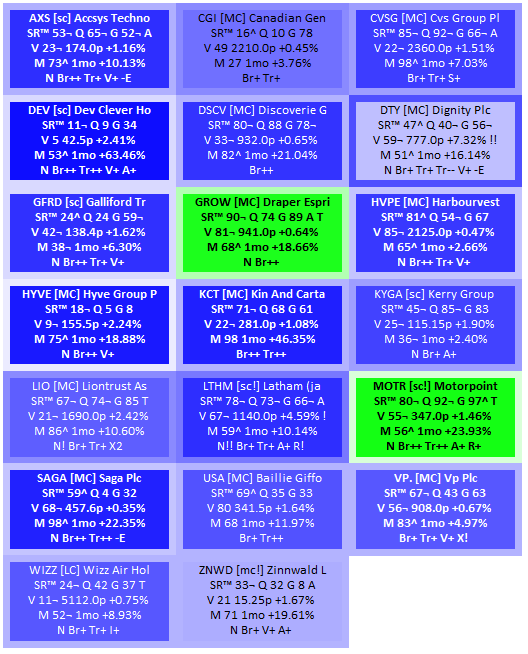
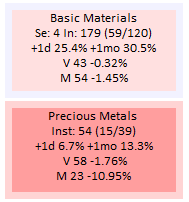
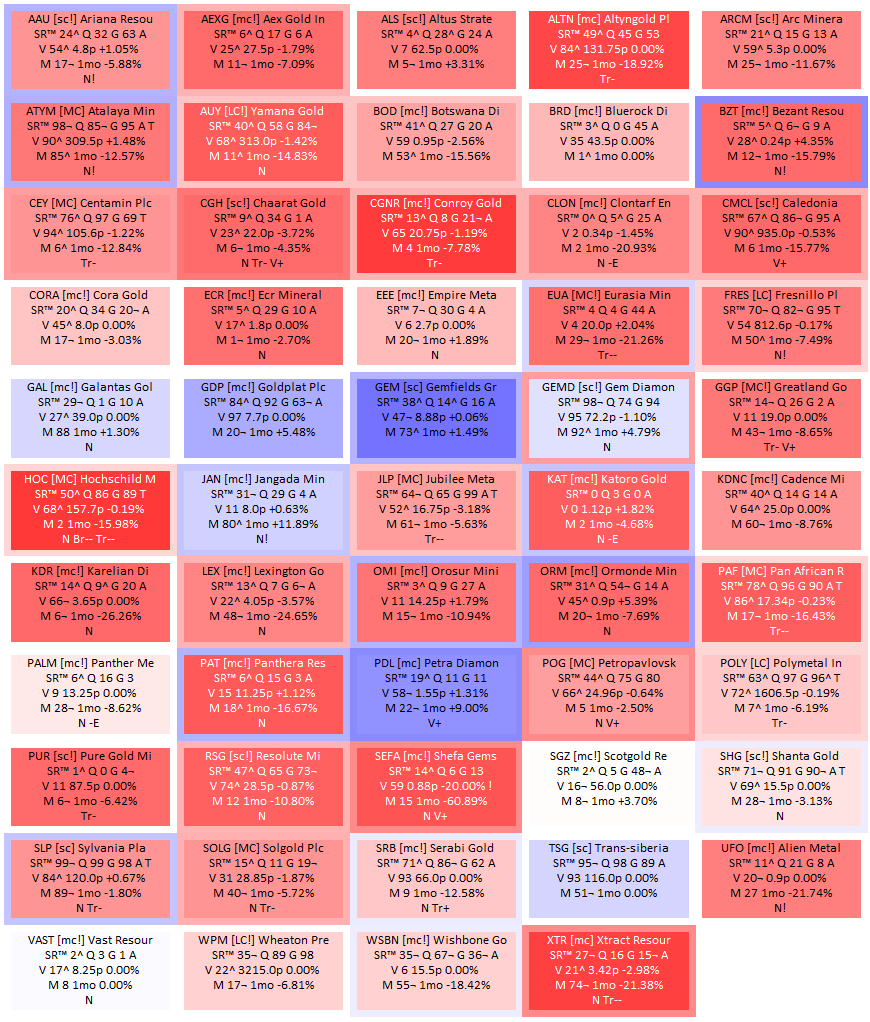
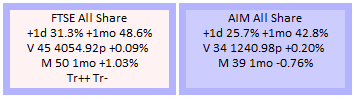
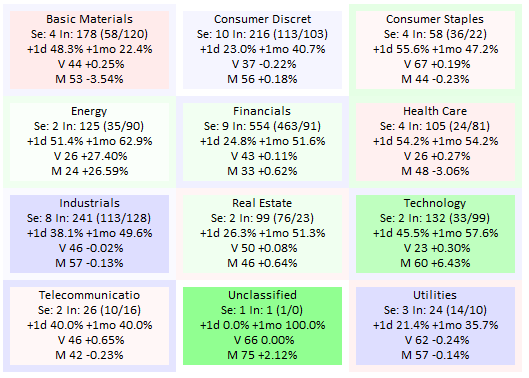
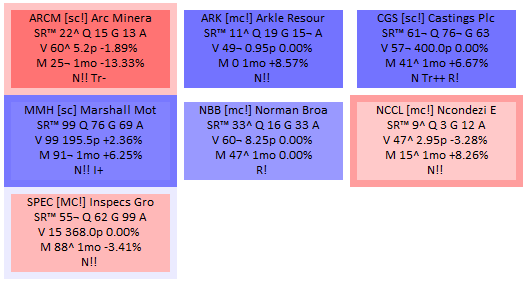
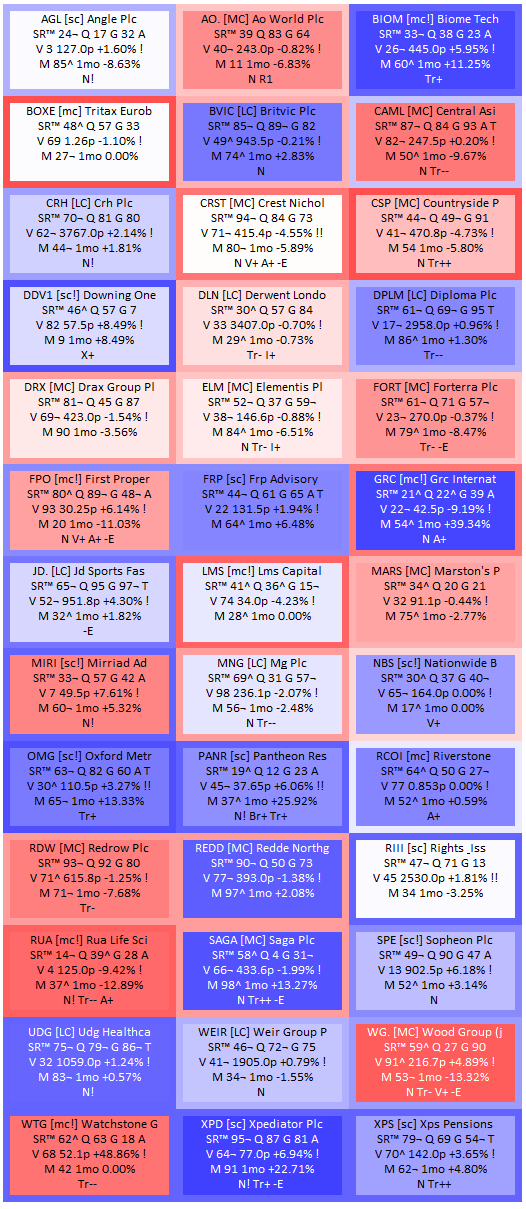
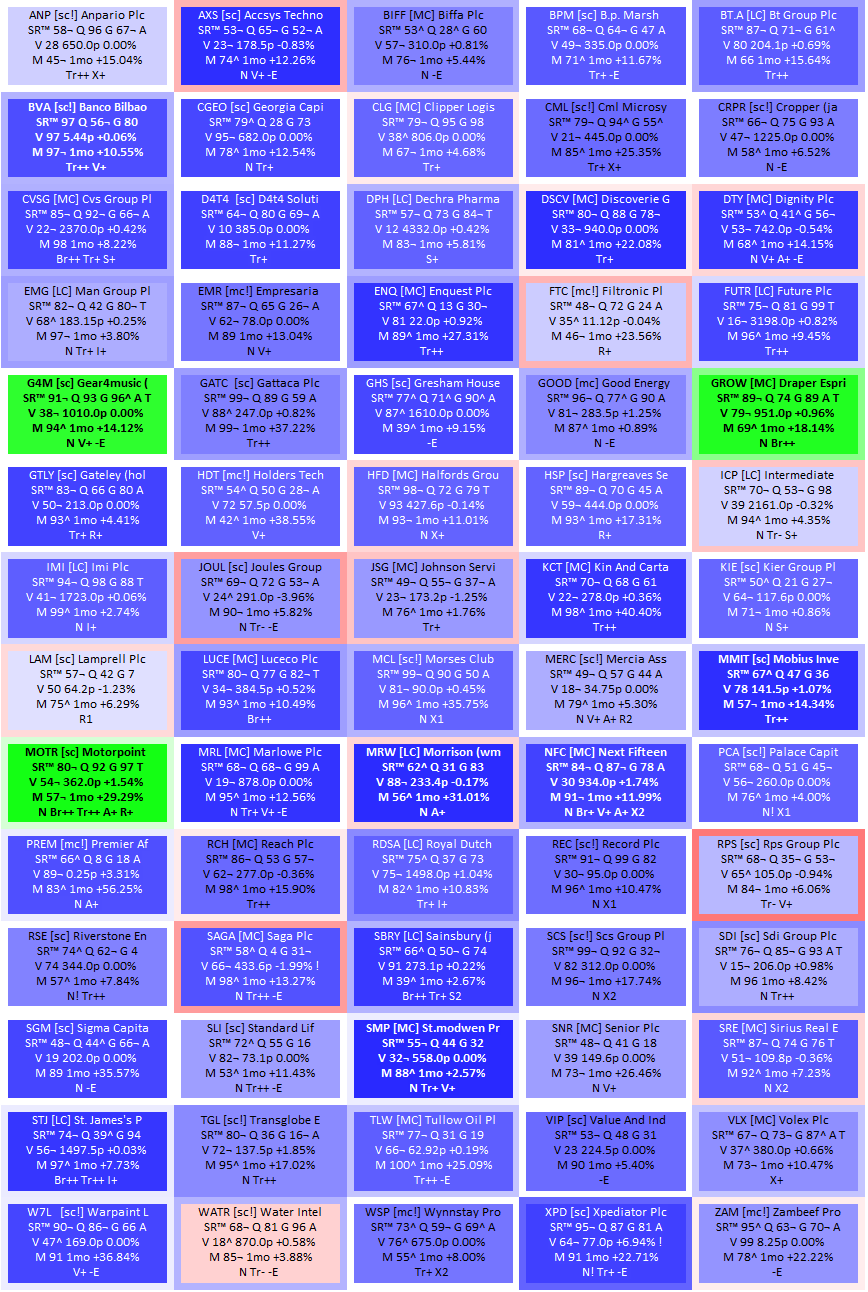
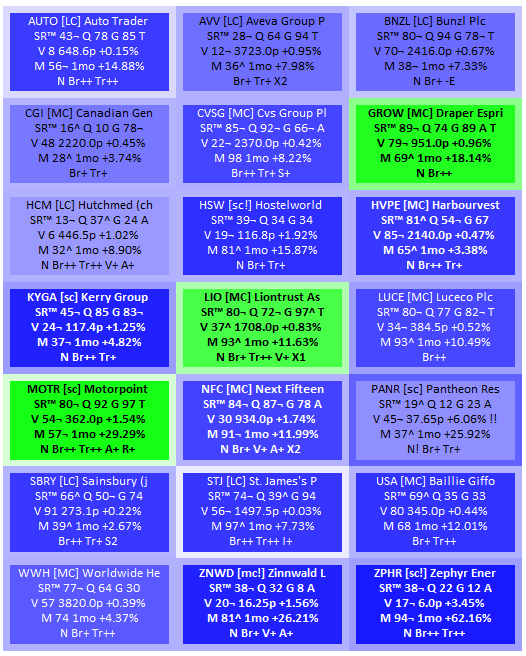
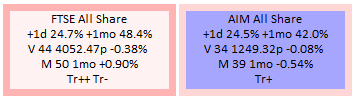
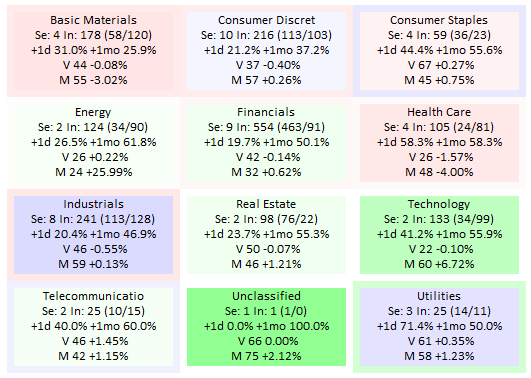
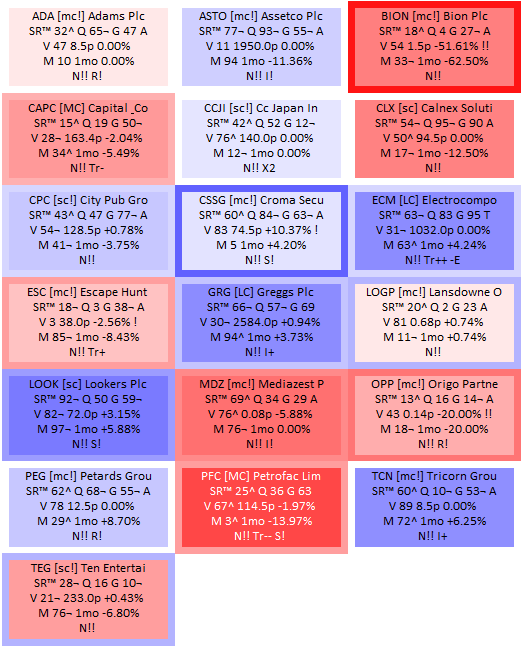
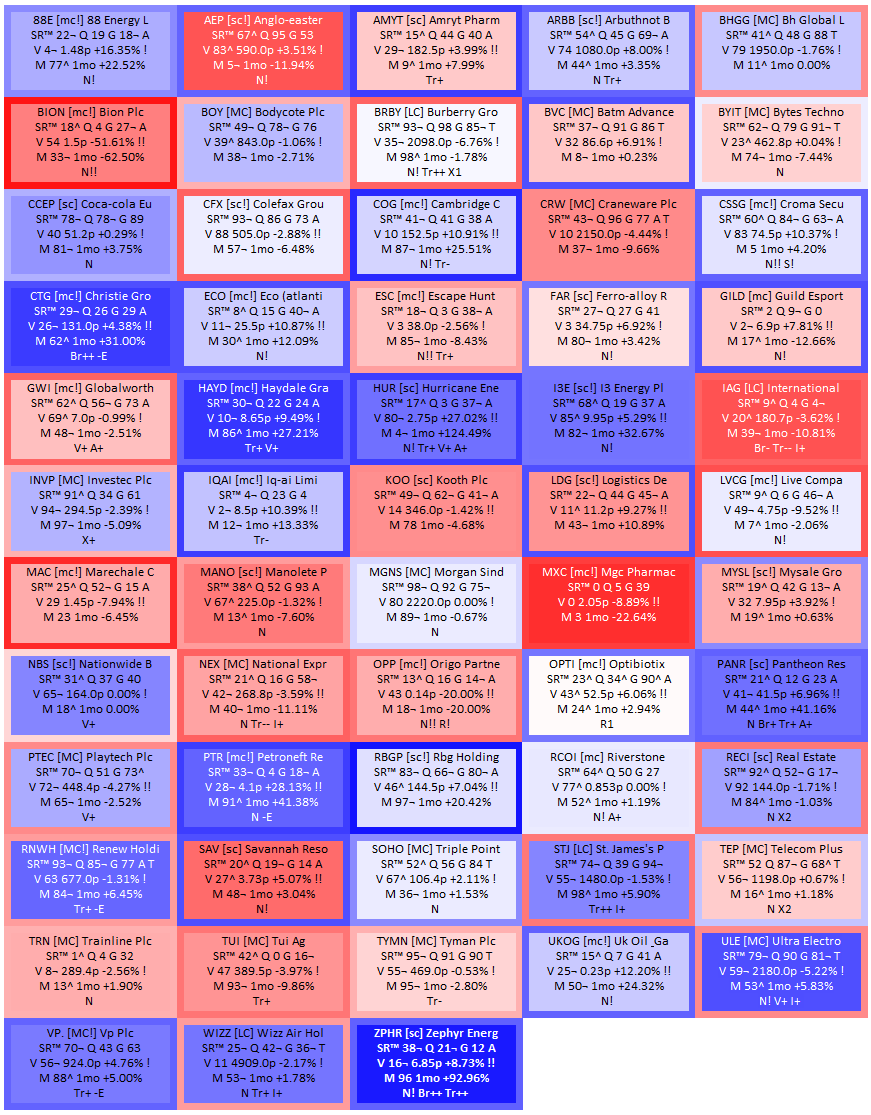
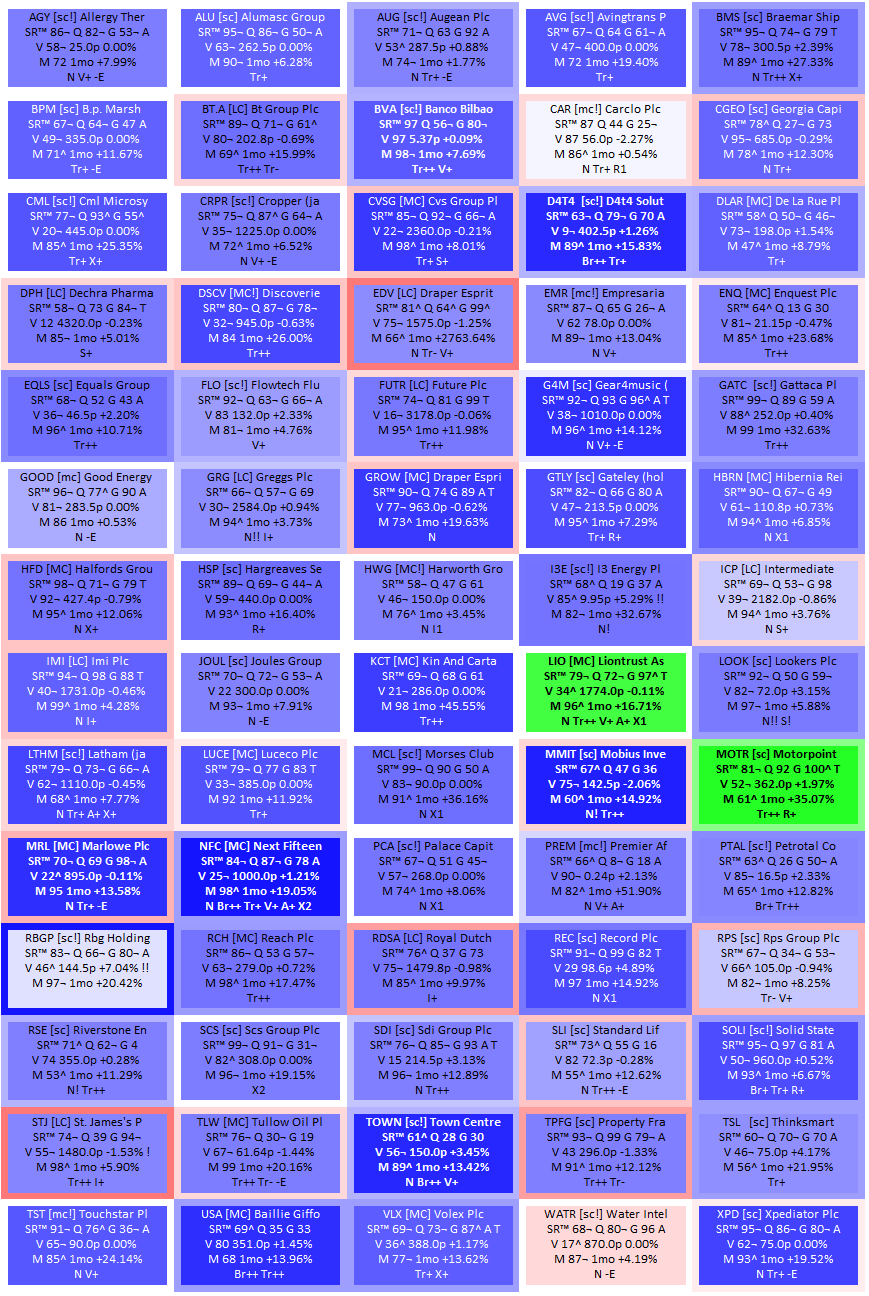
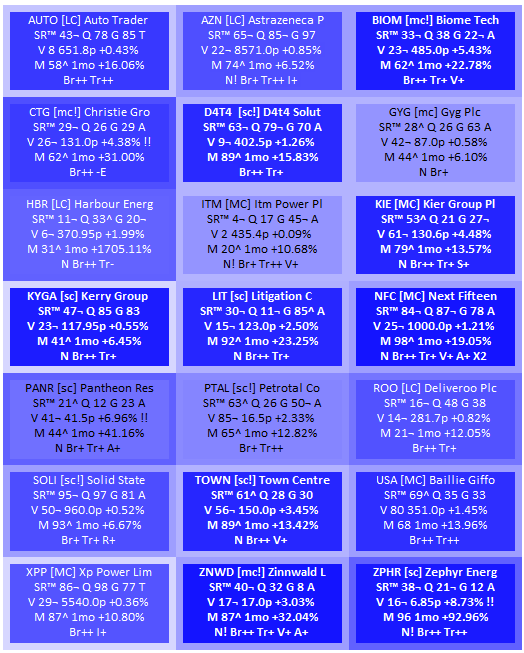
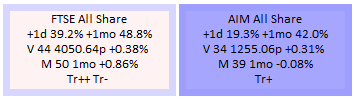
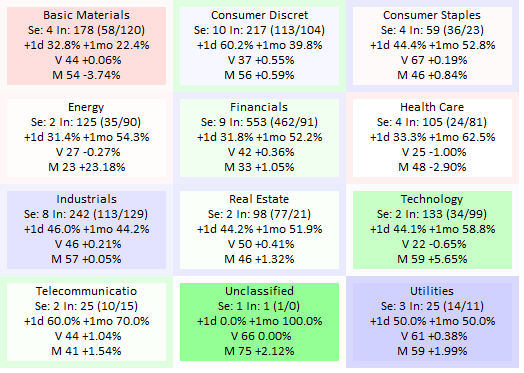
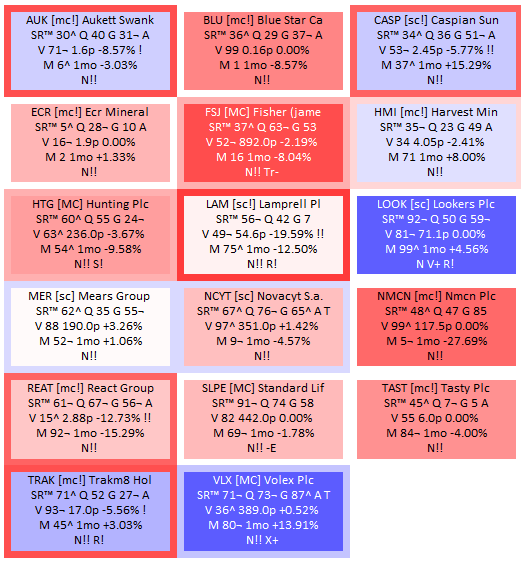
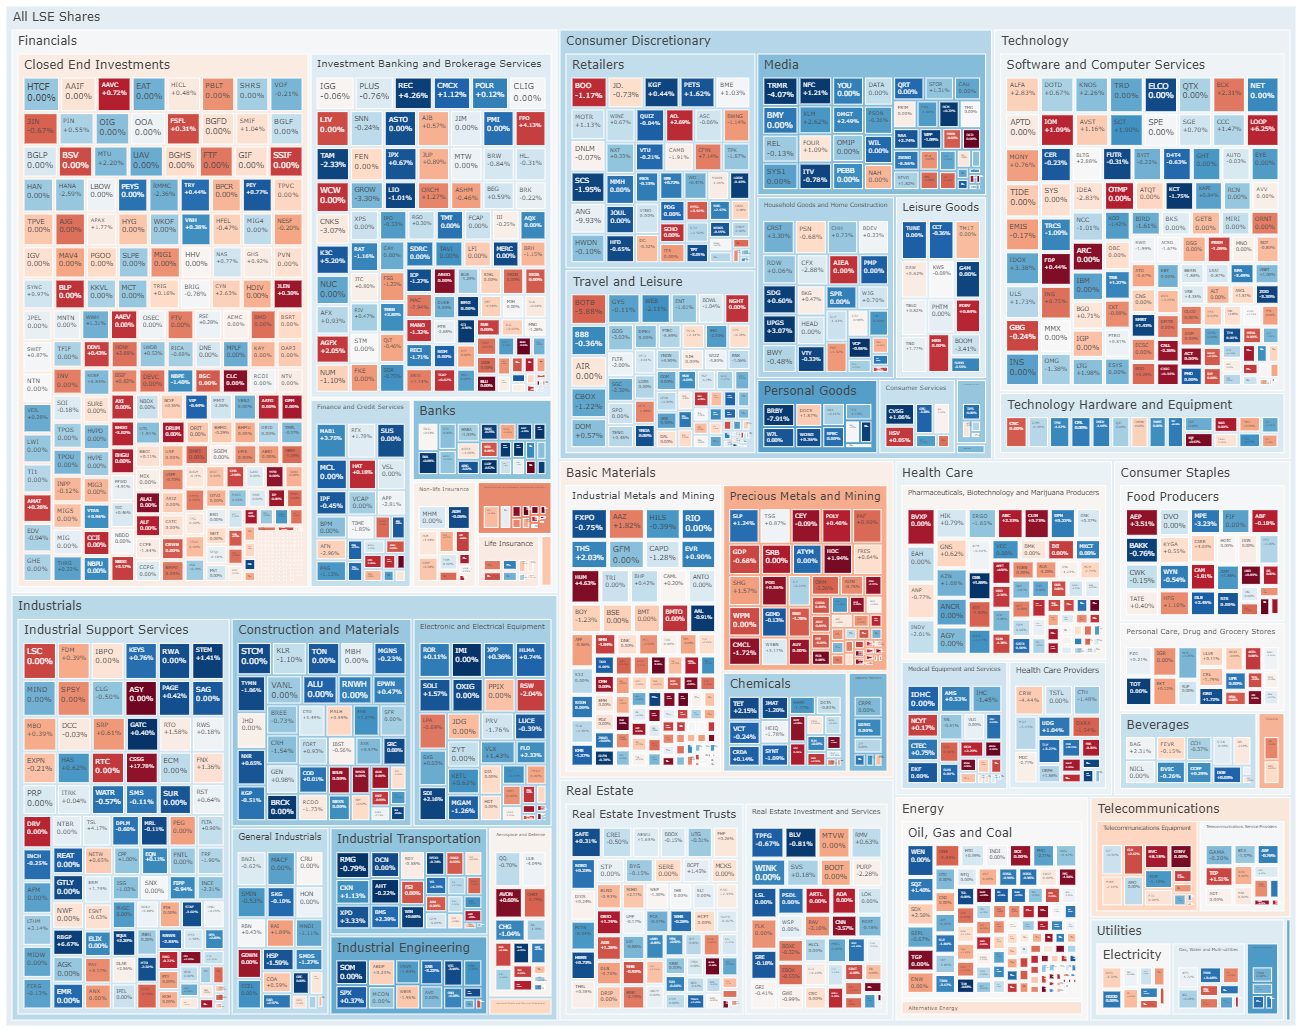
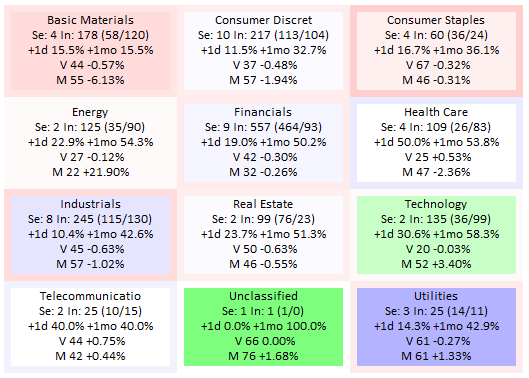
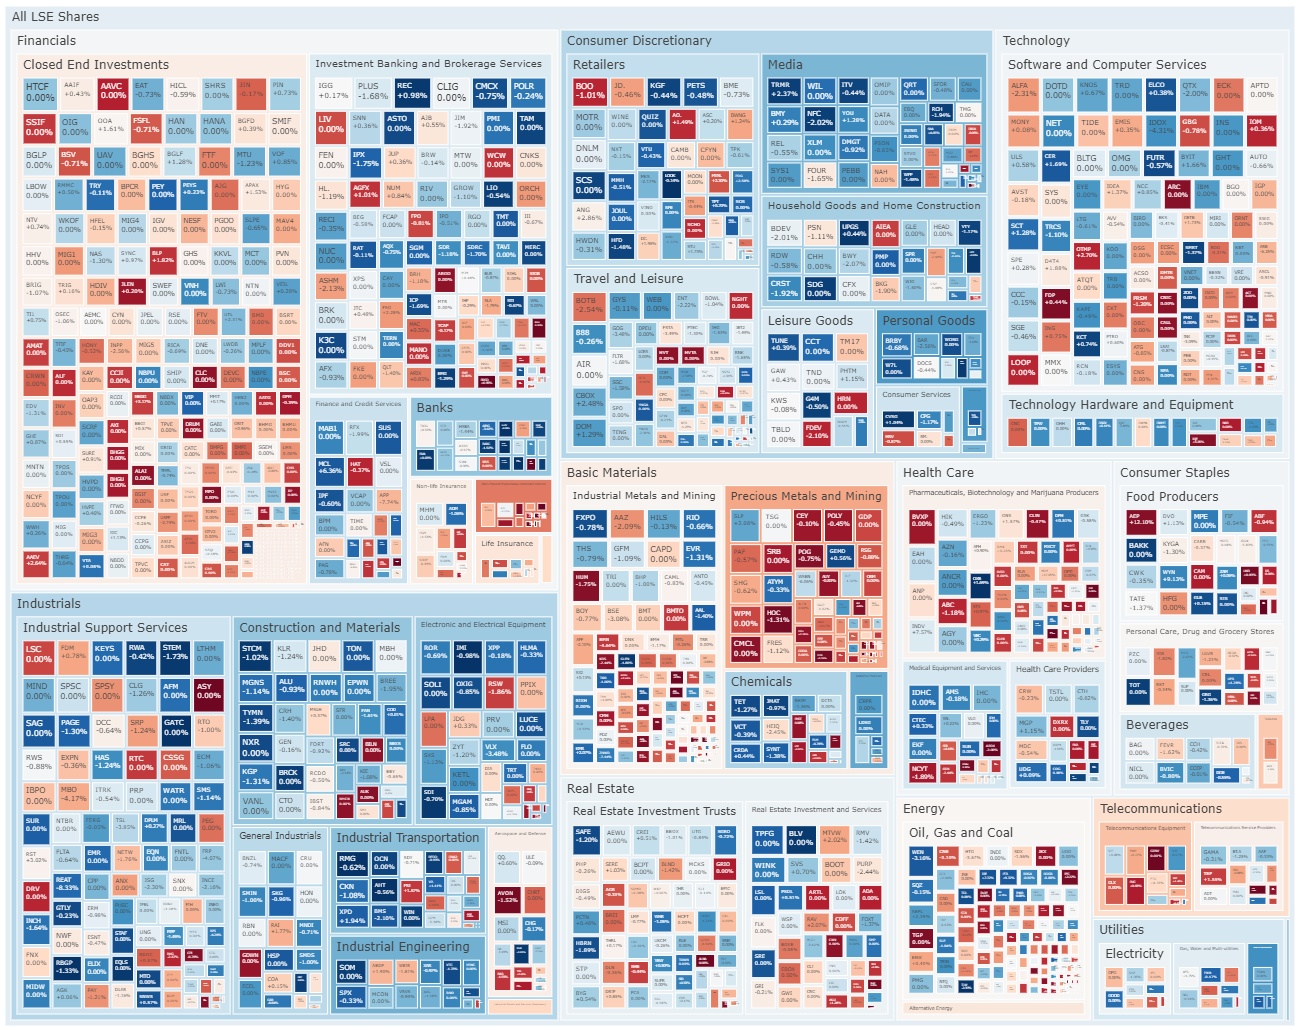
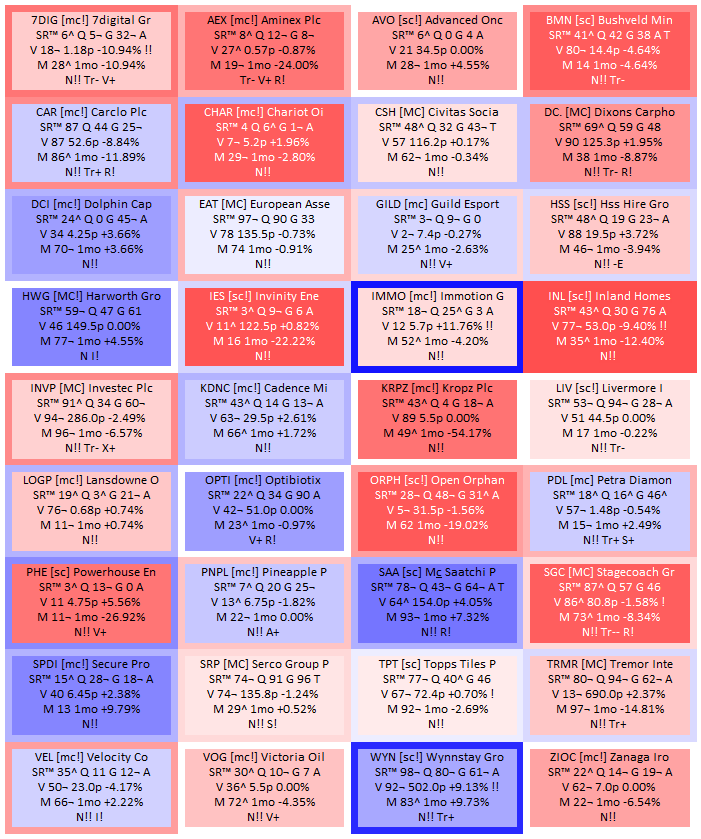
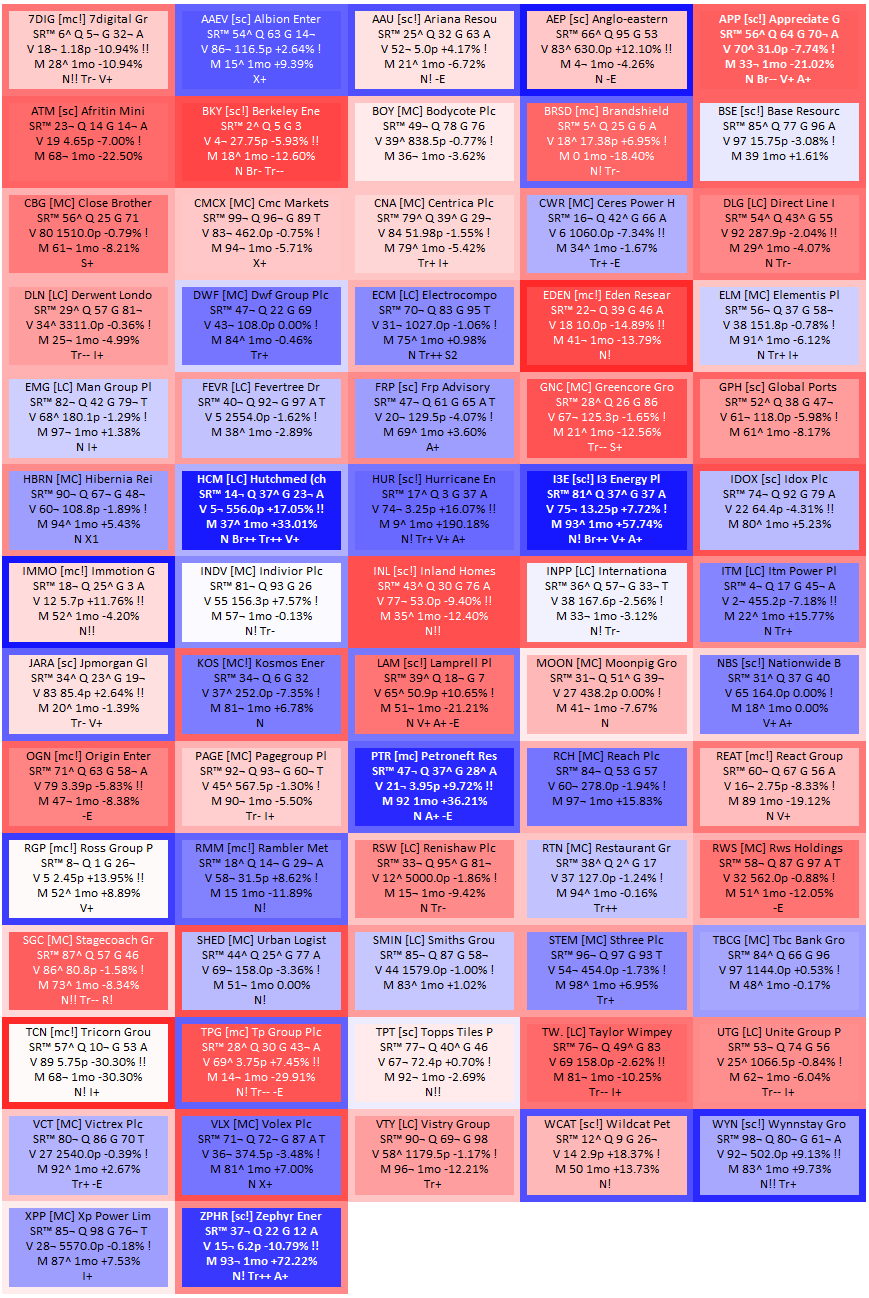
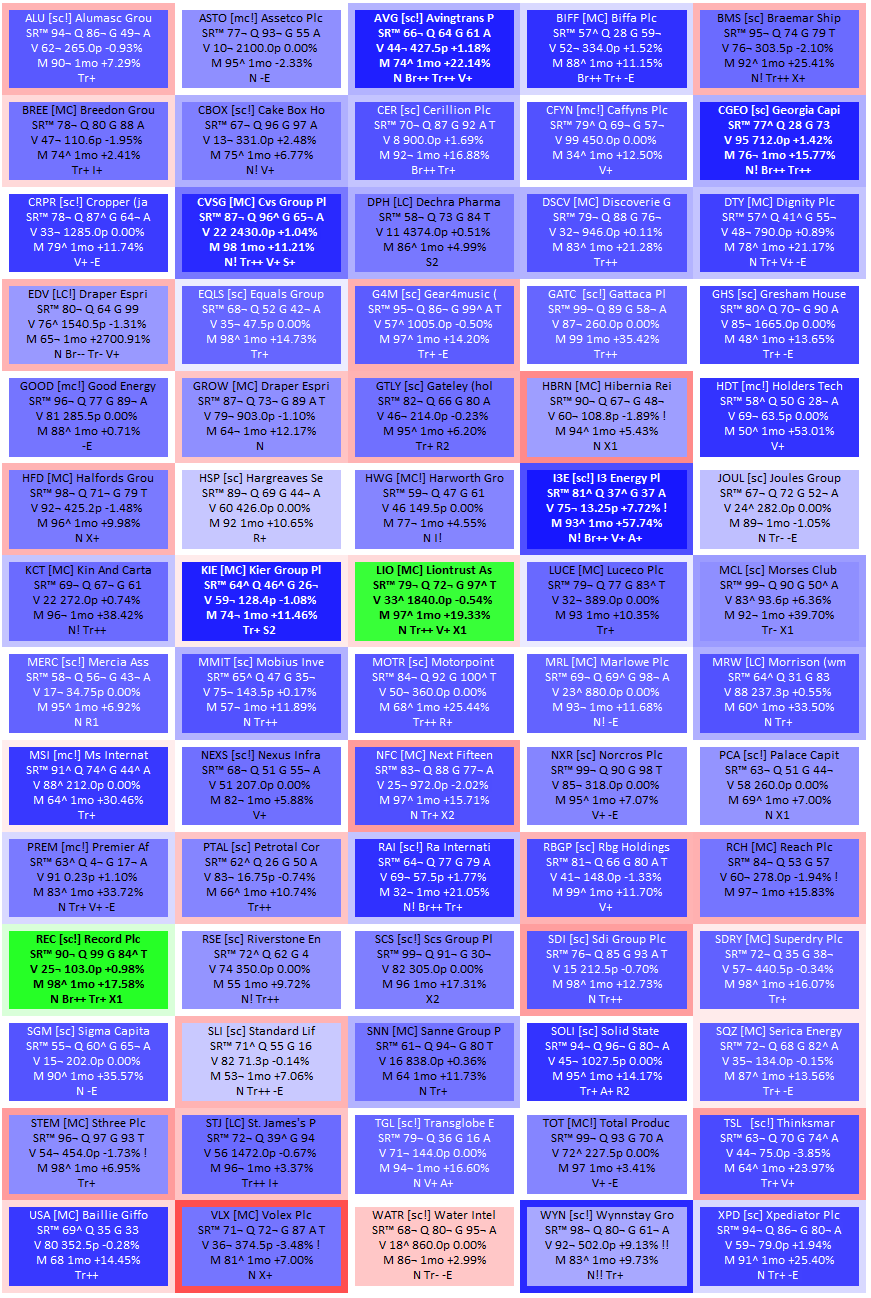
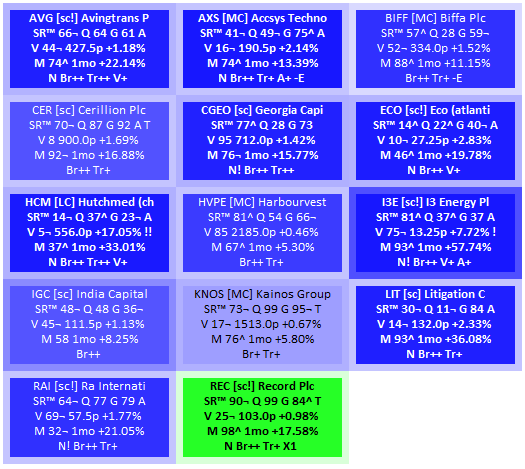
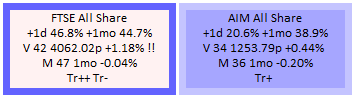
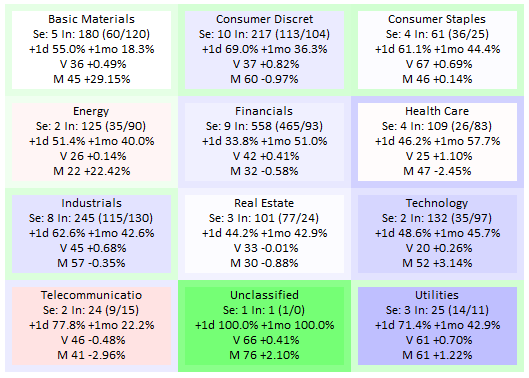
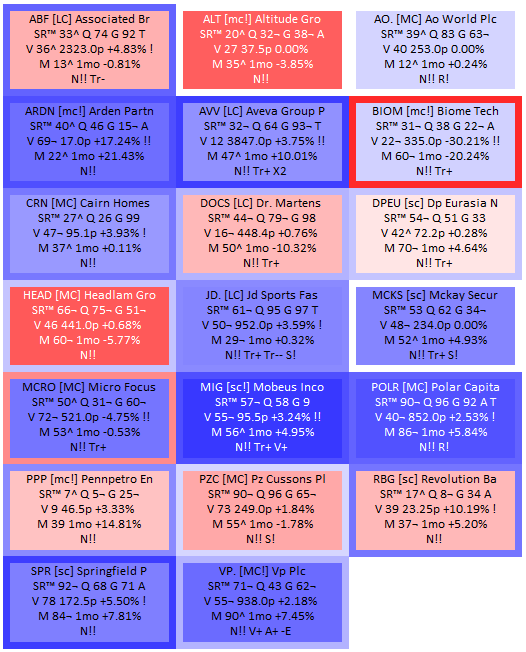
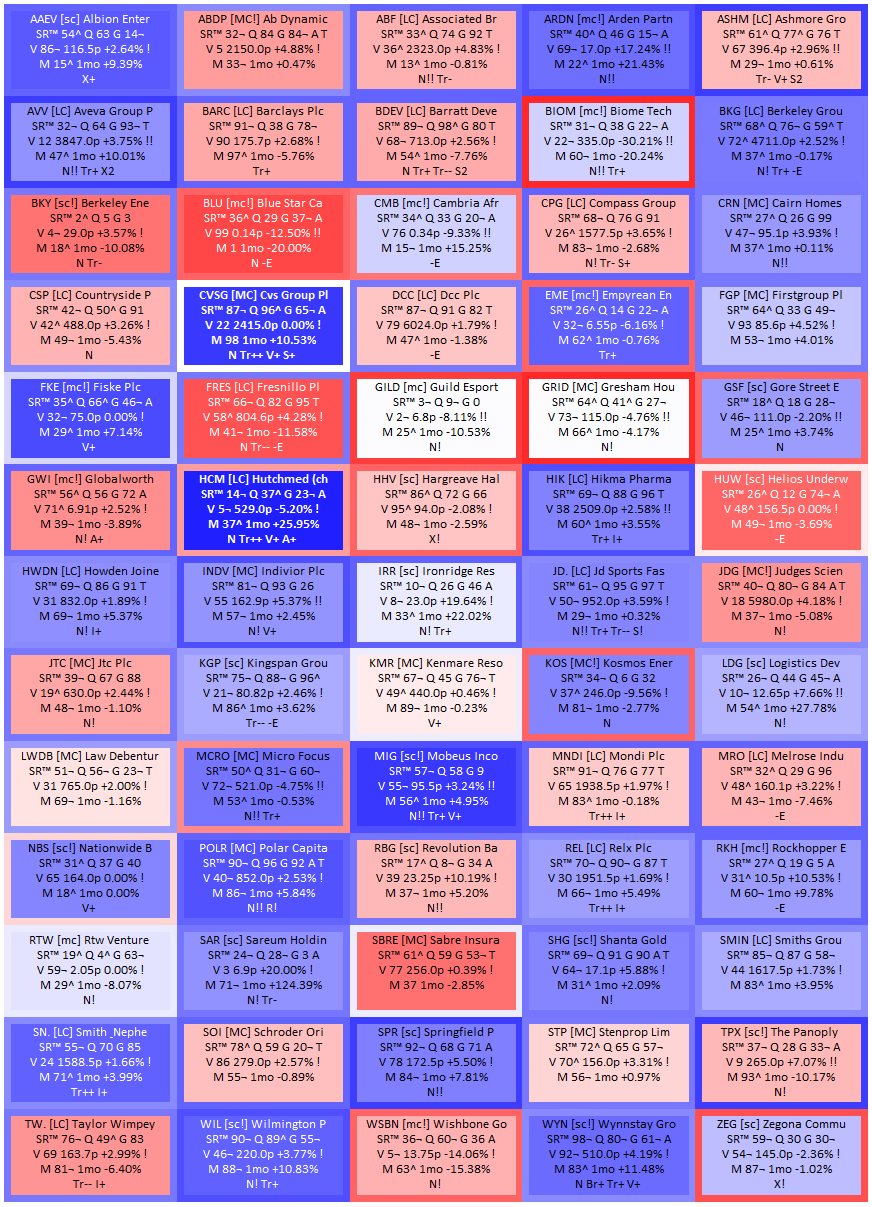
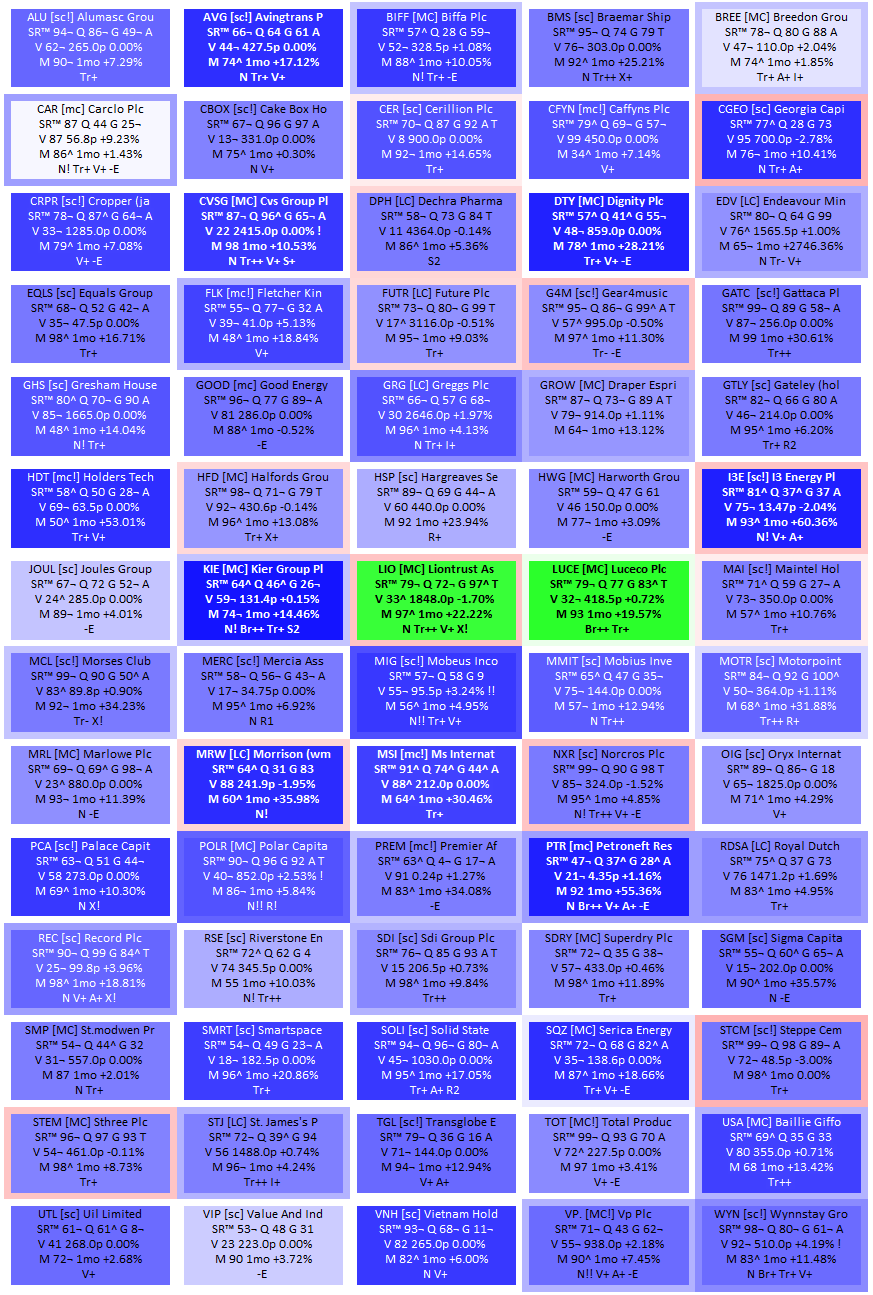
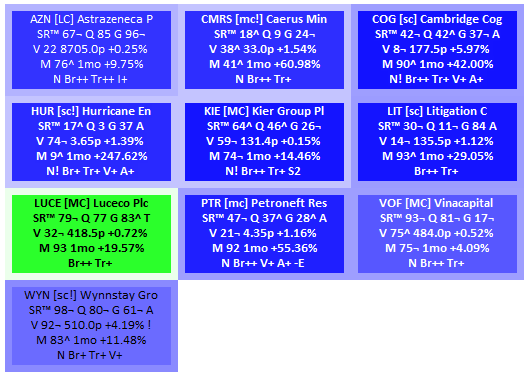
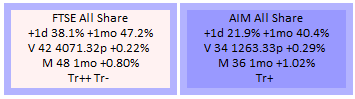
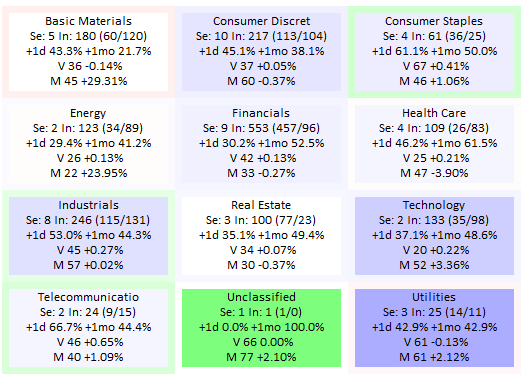
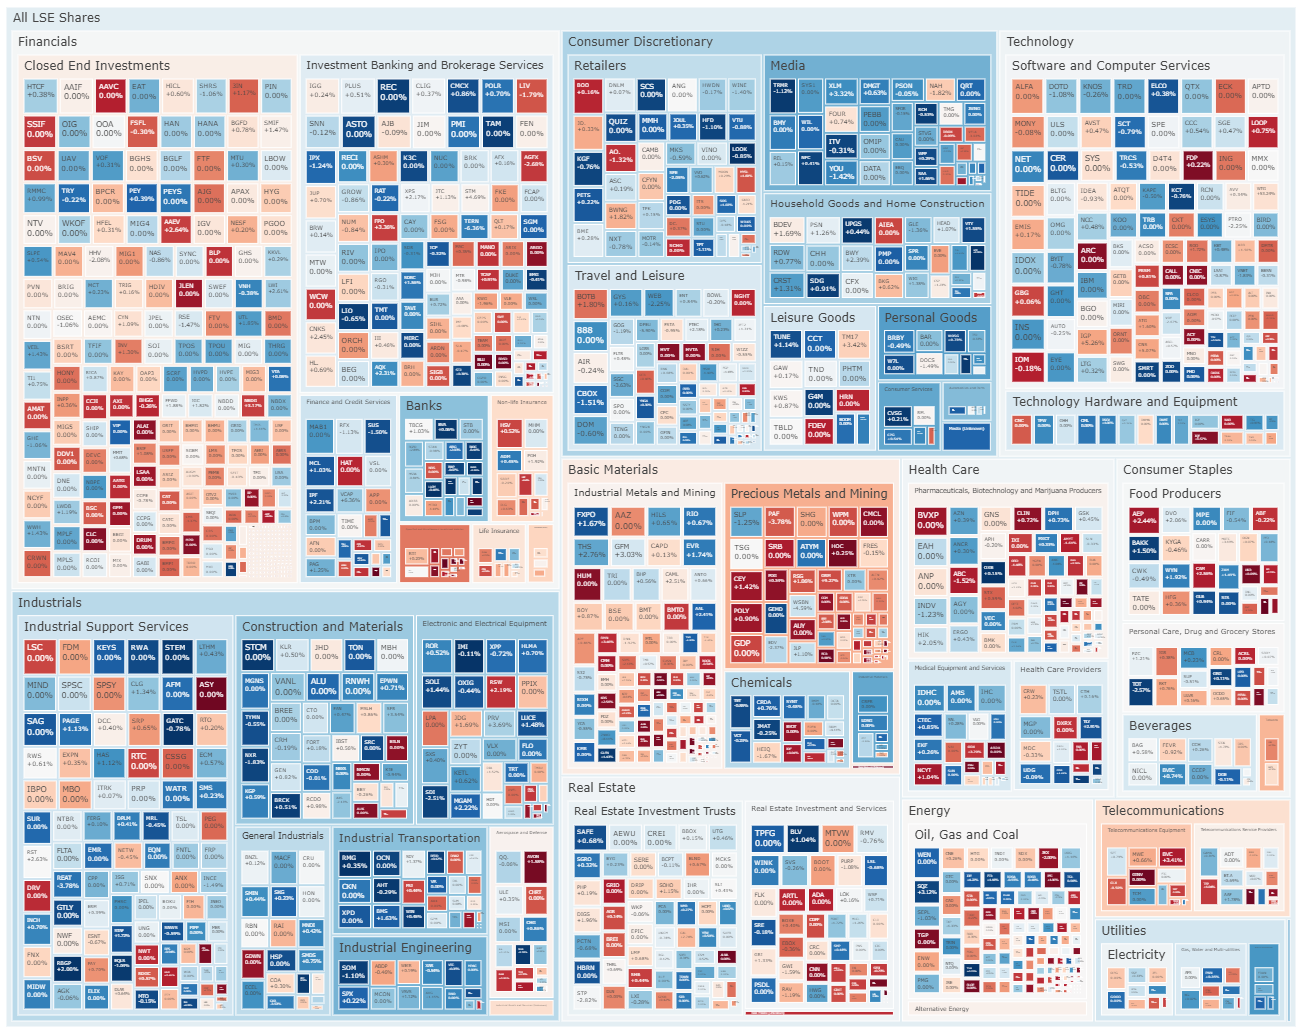
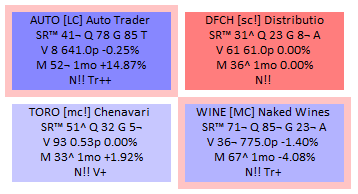
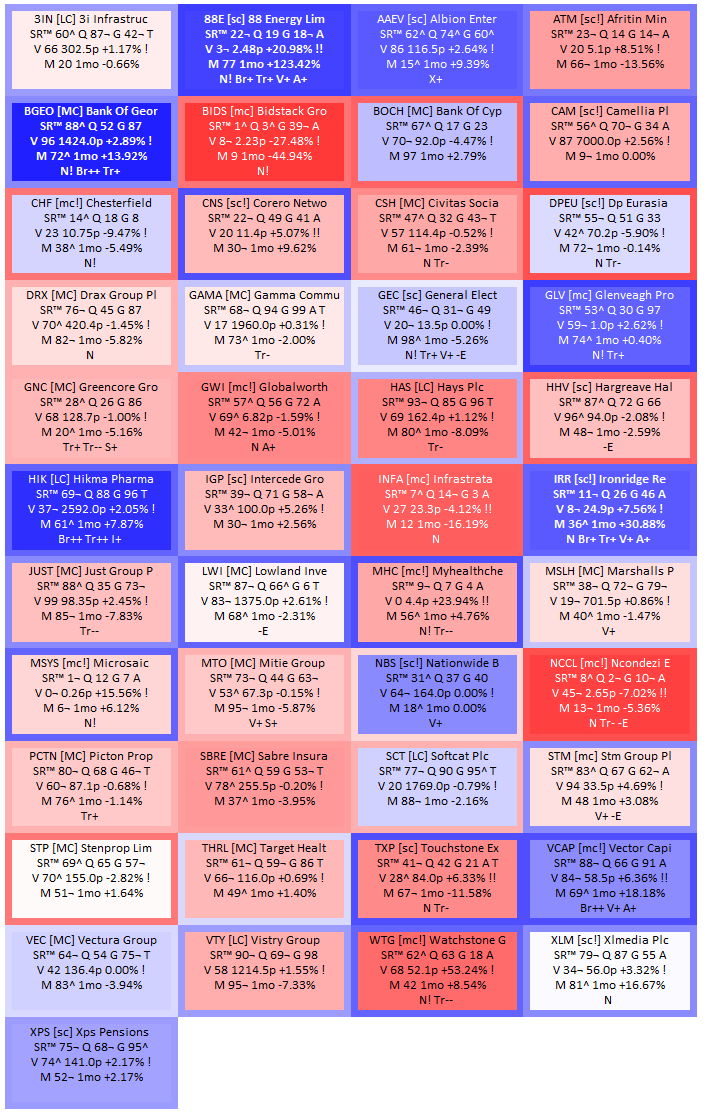
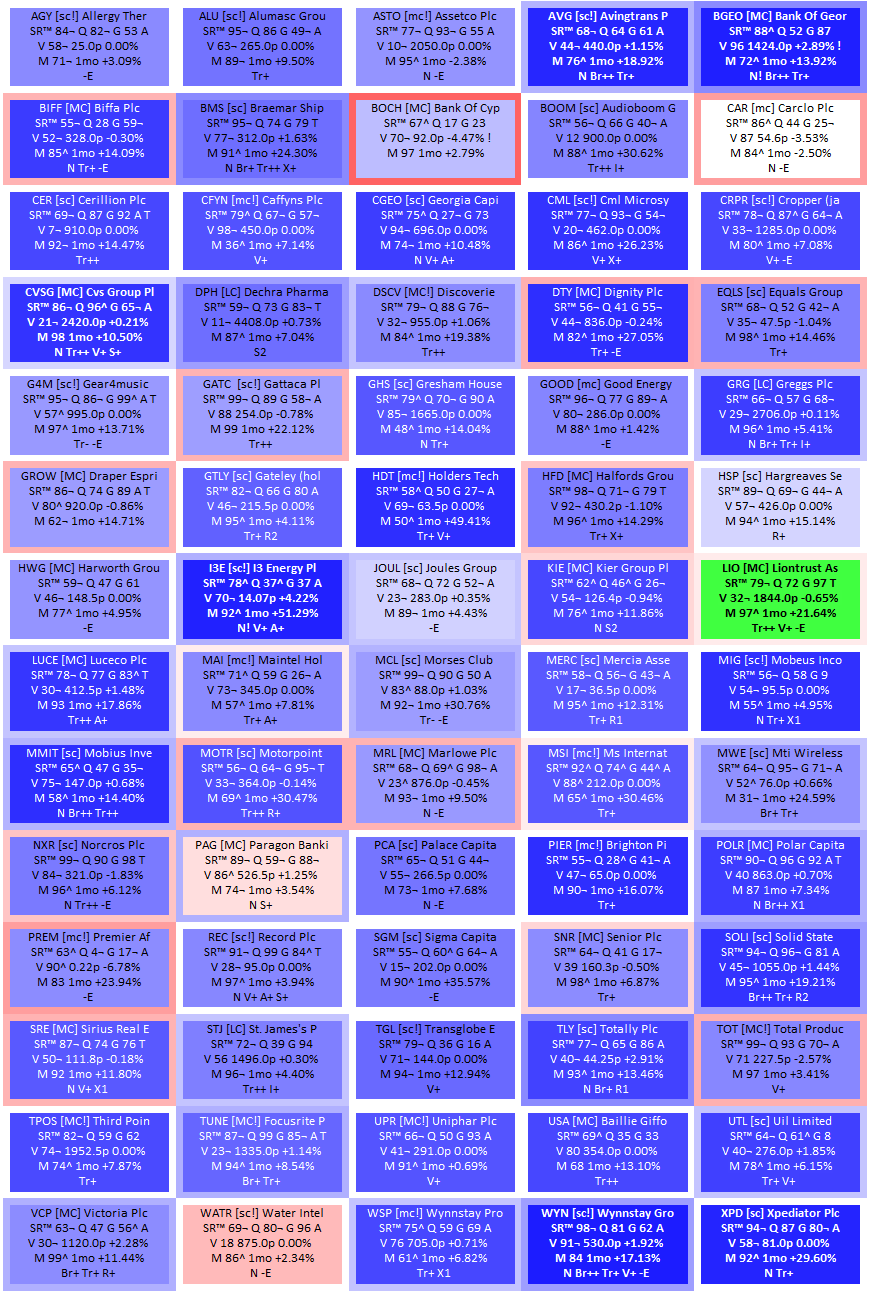
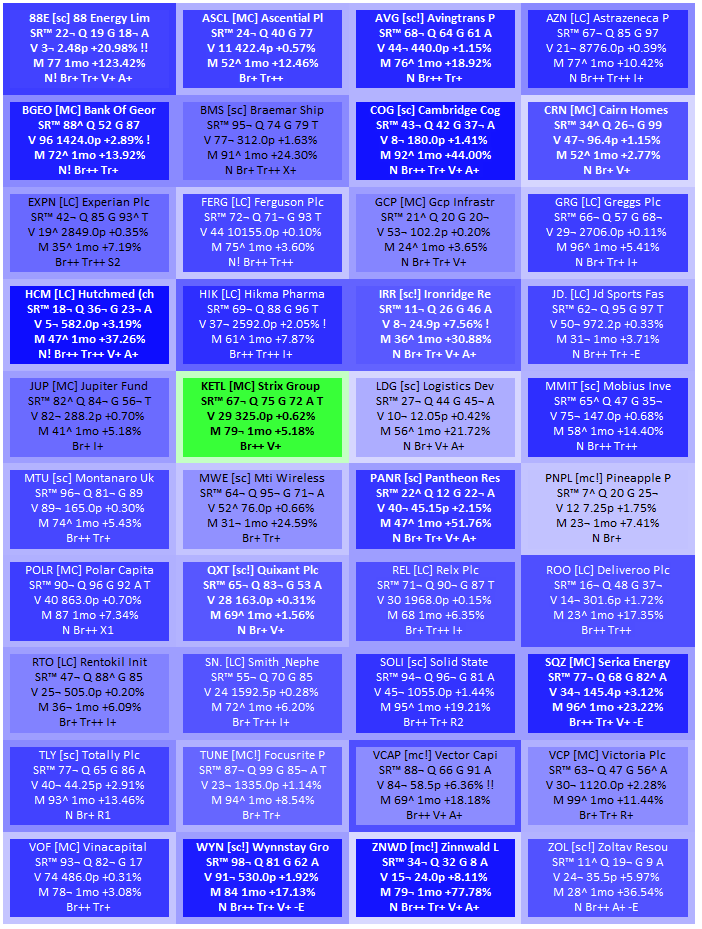
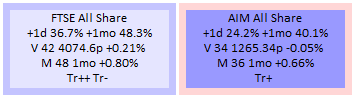
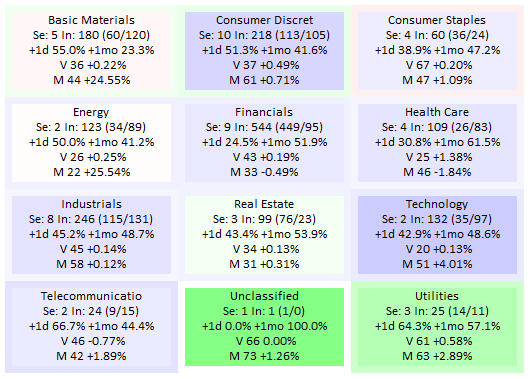
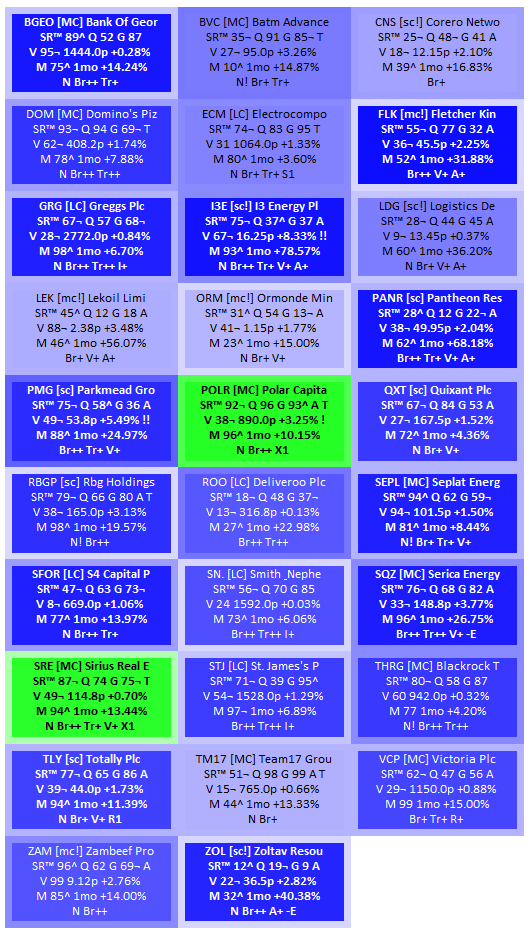
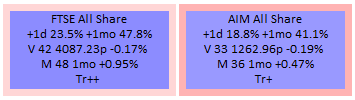
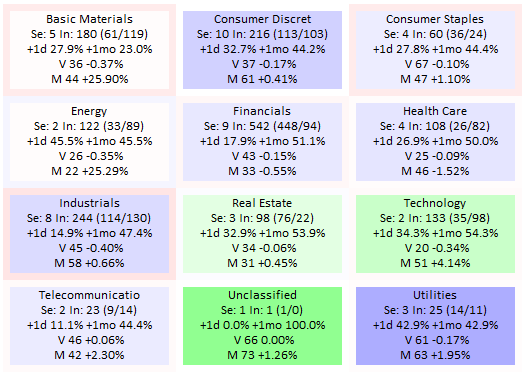
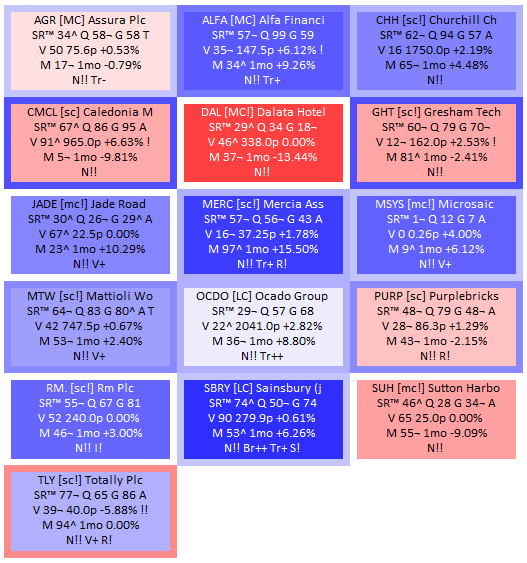
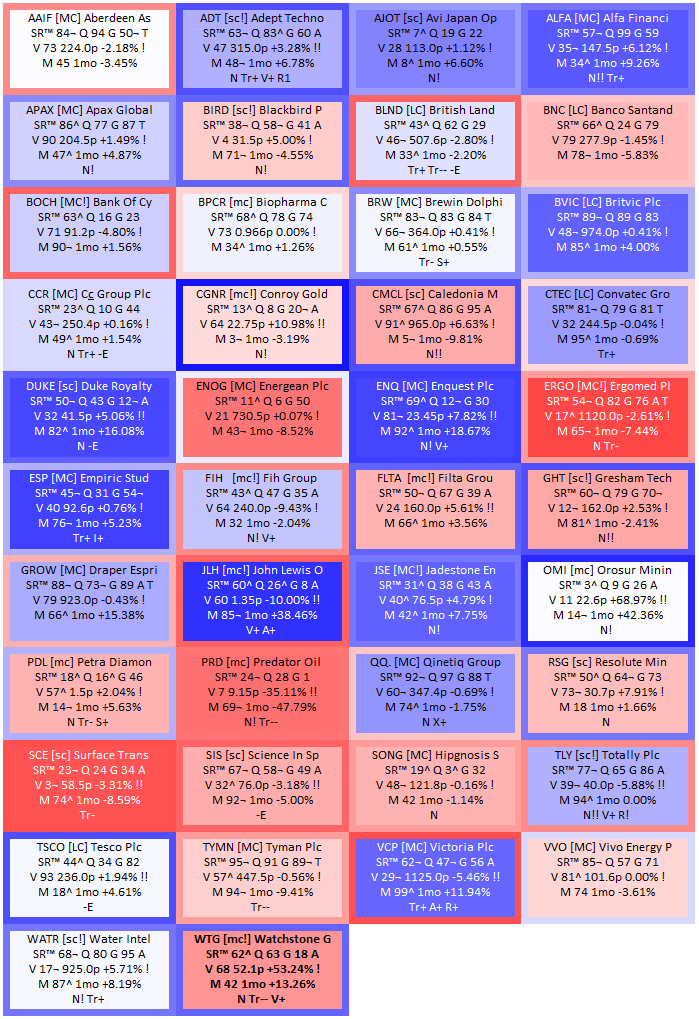
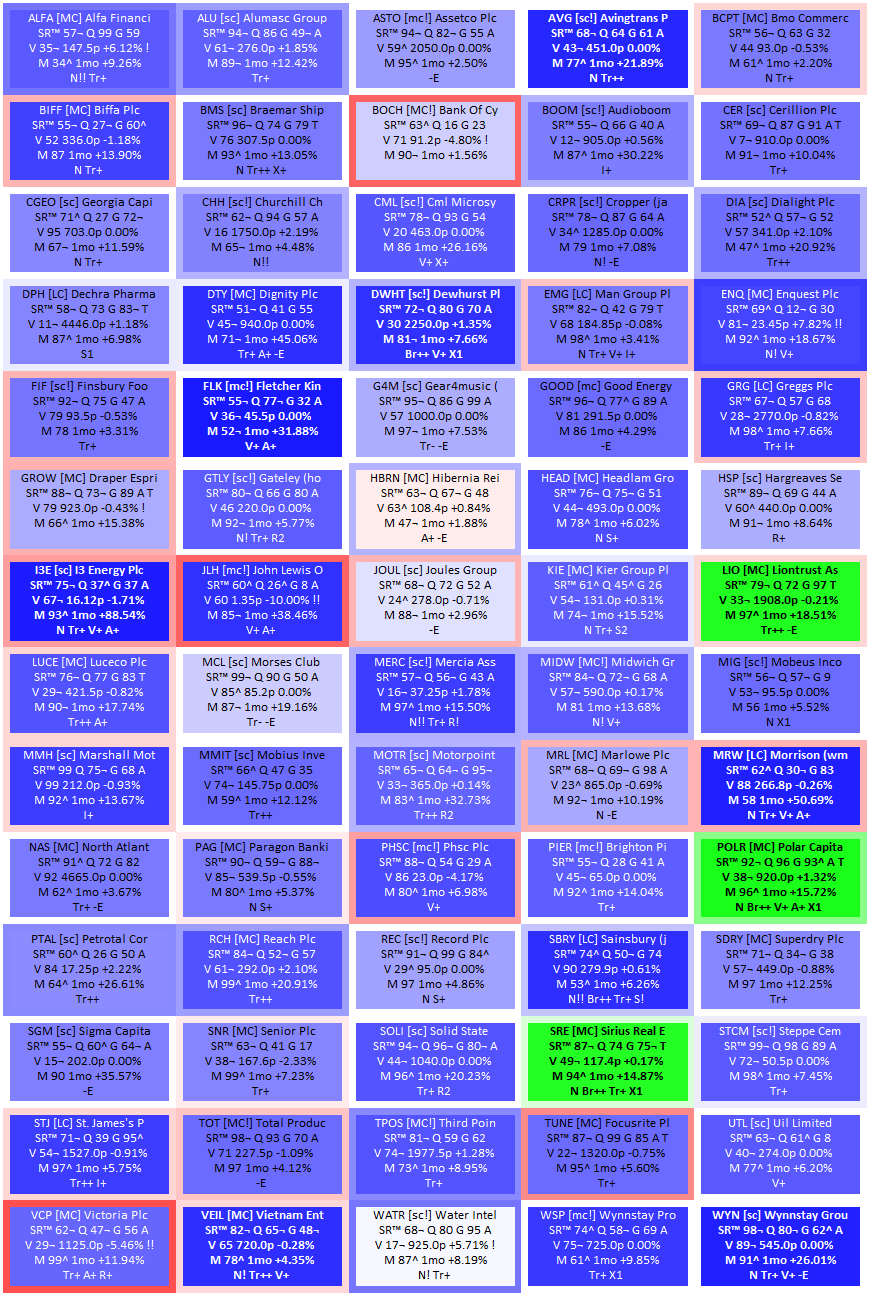
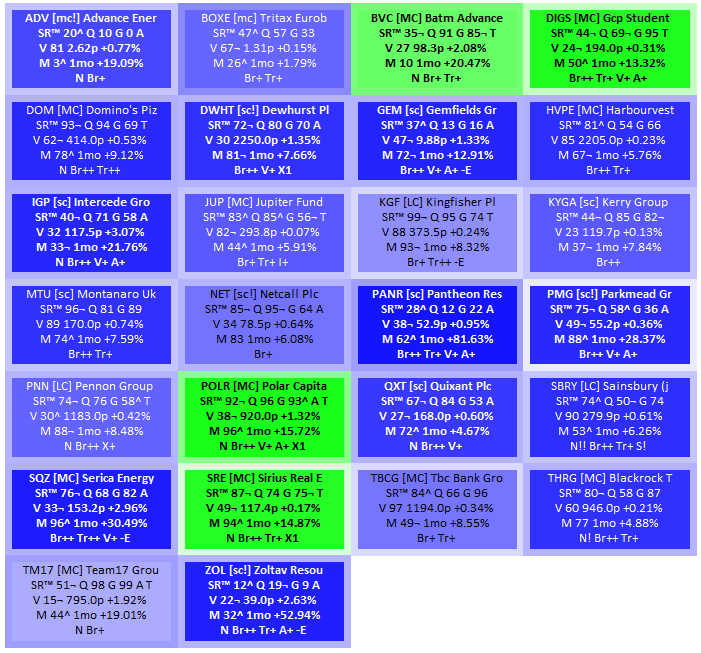
I create heat maps to visualise the relative performance of instruments, with the colour and intensity giving an indication of the relative strength and direction of the prevailing sentiment, and price movement, of each instrument.
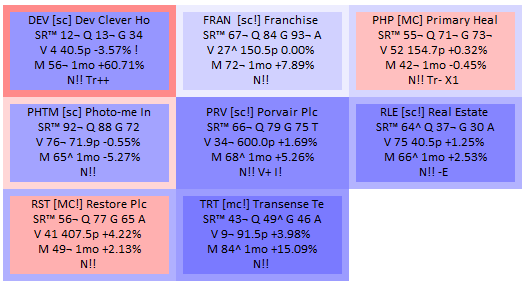
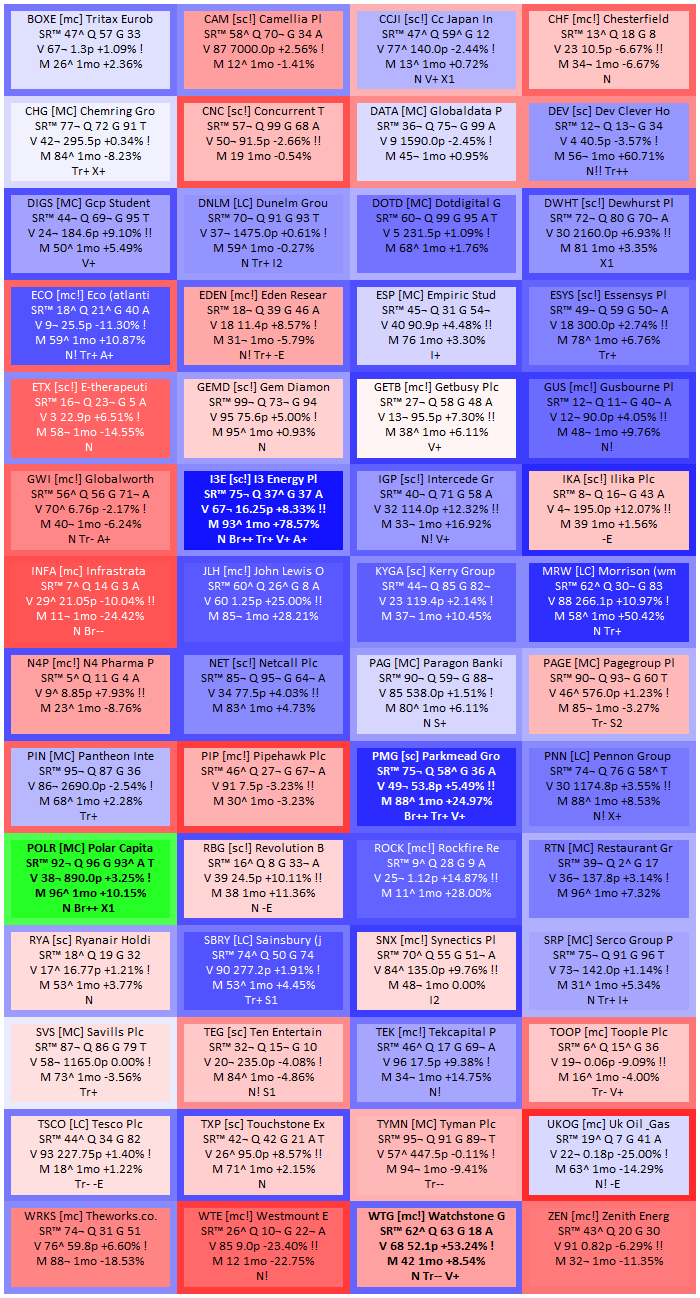
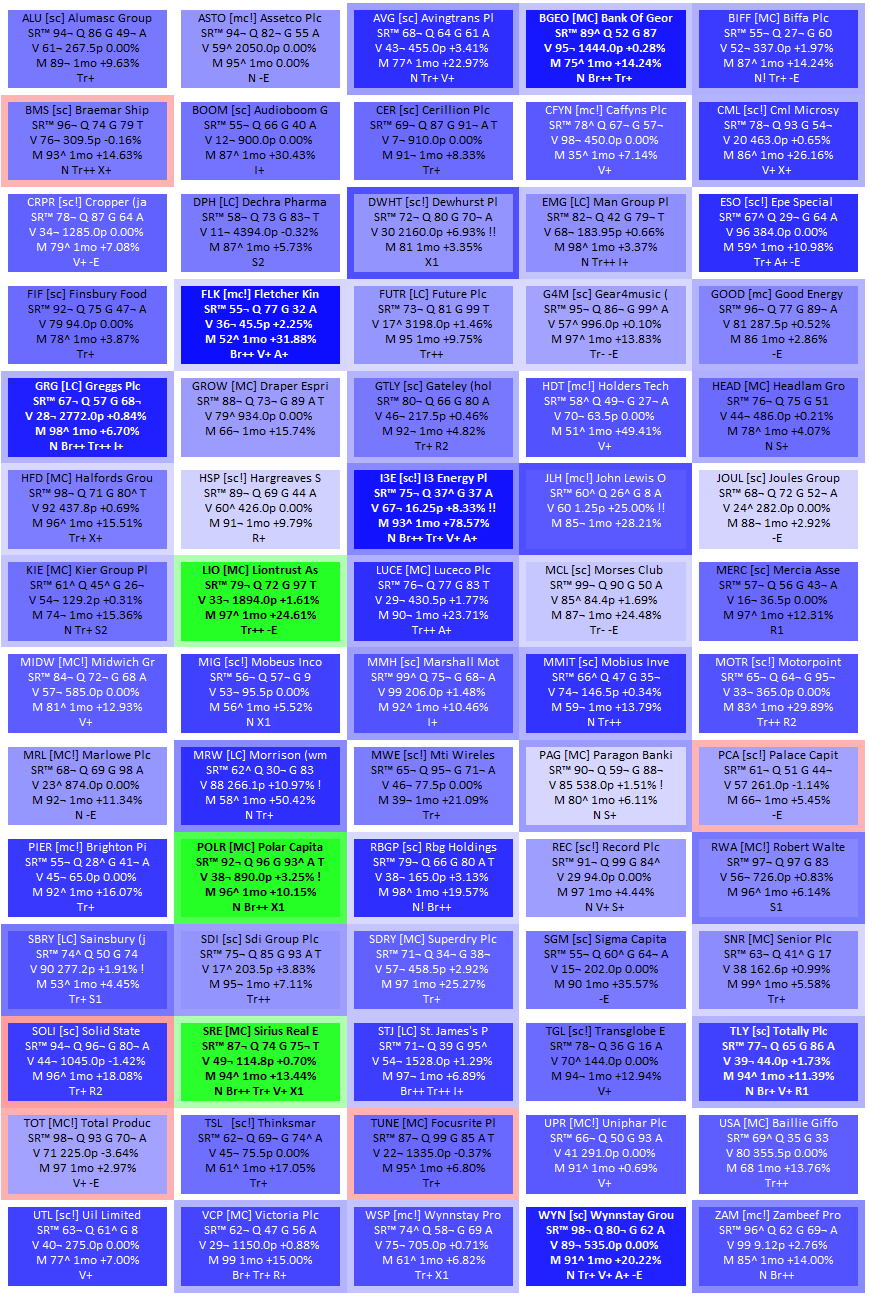
To determine the prevailing 'sentiment' I use a short-term momentum indicator to calculate a number in the range +/- 100 (i.e. -100 to +100). The components of the indicator are:
- The Trend direction (7 day and 21 day)
- A break out or break down (1 month and 3 month)
- The 50 day relative strength against the Instruments' peers in it's ICB Sector
- The ratio of the 5 day EMA of price to the 50d EMA
- The ratio of the 5 day EMA of Average True Range to the 20 day EMA
- The ratio of the 5 day EMA of traded volume to 50 day EMA
- The On Balance Volume (OBV)
- The proximity to the 3 month high
- The MACD
Having determined the prevailing sentiment, positive values are use to determine the intesity of a blue colour and negative values are used to determine the intensity of a red colour.
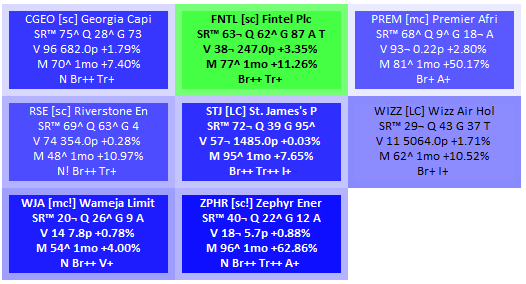
I also use green to highlight instruments that have a strong positive sentiment, have rising volume, and pass all of my minimum tradeable criteria:
- Profitable (Net Profit > 0)
- Low(ish) Debt (Net Debt / Net Profit < 10)
- Reasonable liquidity:
- Spread < 5% (I actually prefer much lower than this!)
- EMS Value > £2,000
- 50d EMA of Average Traded Value > £250k
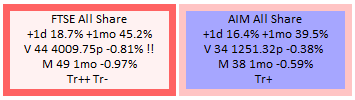
The colour of the tile border is based on the movement today and is much cruder, it takes into consideration:
- The current price relative to yesterdays close, and todays open
- The high / low price today relative to yesterdays high / low
- An opening gap…