When Dividends Turn Dangerous

John D. Rockefeller once said: ‘Do you know the only thing that gives me pleasure? It's to see my dividends coming in.’ Presumably, nothing ruined Rockefeller’s day like a dividend cut. For modern day investors, the threat of a dividend cut can be just as unsettling, especially if the cut is symptomatic of deeper financial troubles.
But only in very rare cases do dividend cuts come out of the blue. By evaluating share price trends and key financial metrics, investors can minimise the risk of dividend disruptions. Over the past few weeks, we analysed over 700 dividend cuts that have occurred since the beginning of 2020. Our review included:
- Companies that canceled a specific payment.
- Companies that suspended payments indefinitely.
- Dividends where the cash payout had declined on a year-on-year basis.
- Dividends where the payout was lower than initially promised.
Our goal was to identify red flags that appear before a dividend cut, helping investors align with the base-rates and minimise portfolio risk.
Trust the crowd
Many investors, including Warren Buffet, take a contrarian approach, insisting that investors should be fearful when others are greedy and greedy when others are fearful. The problem is that this mantra may not work all the time. Last week, my colleague Mark showed that the price tends to fall before the dividend is actually cut, as if the market has a collective crystal ball. It could be that the market knows something we don’t. This is perhaps why we should trust the wisdom of crowds…
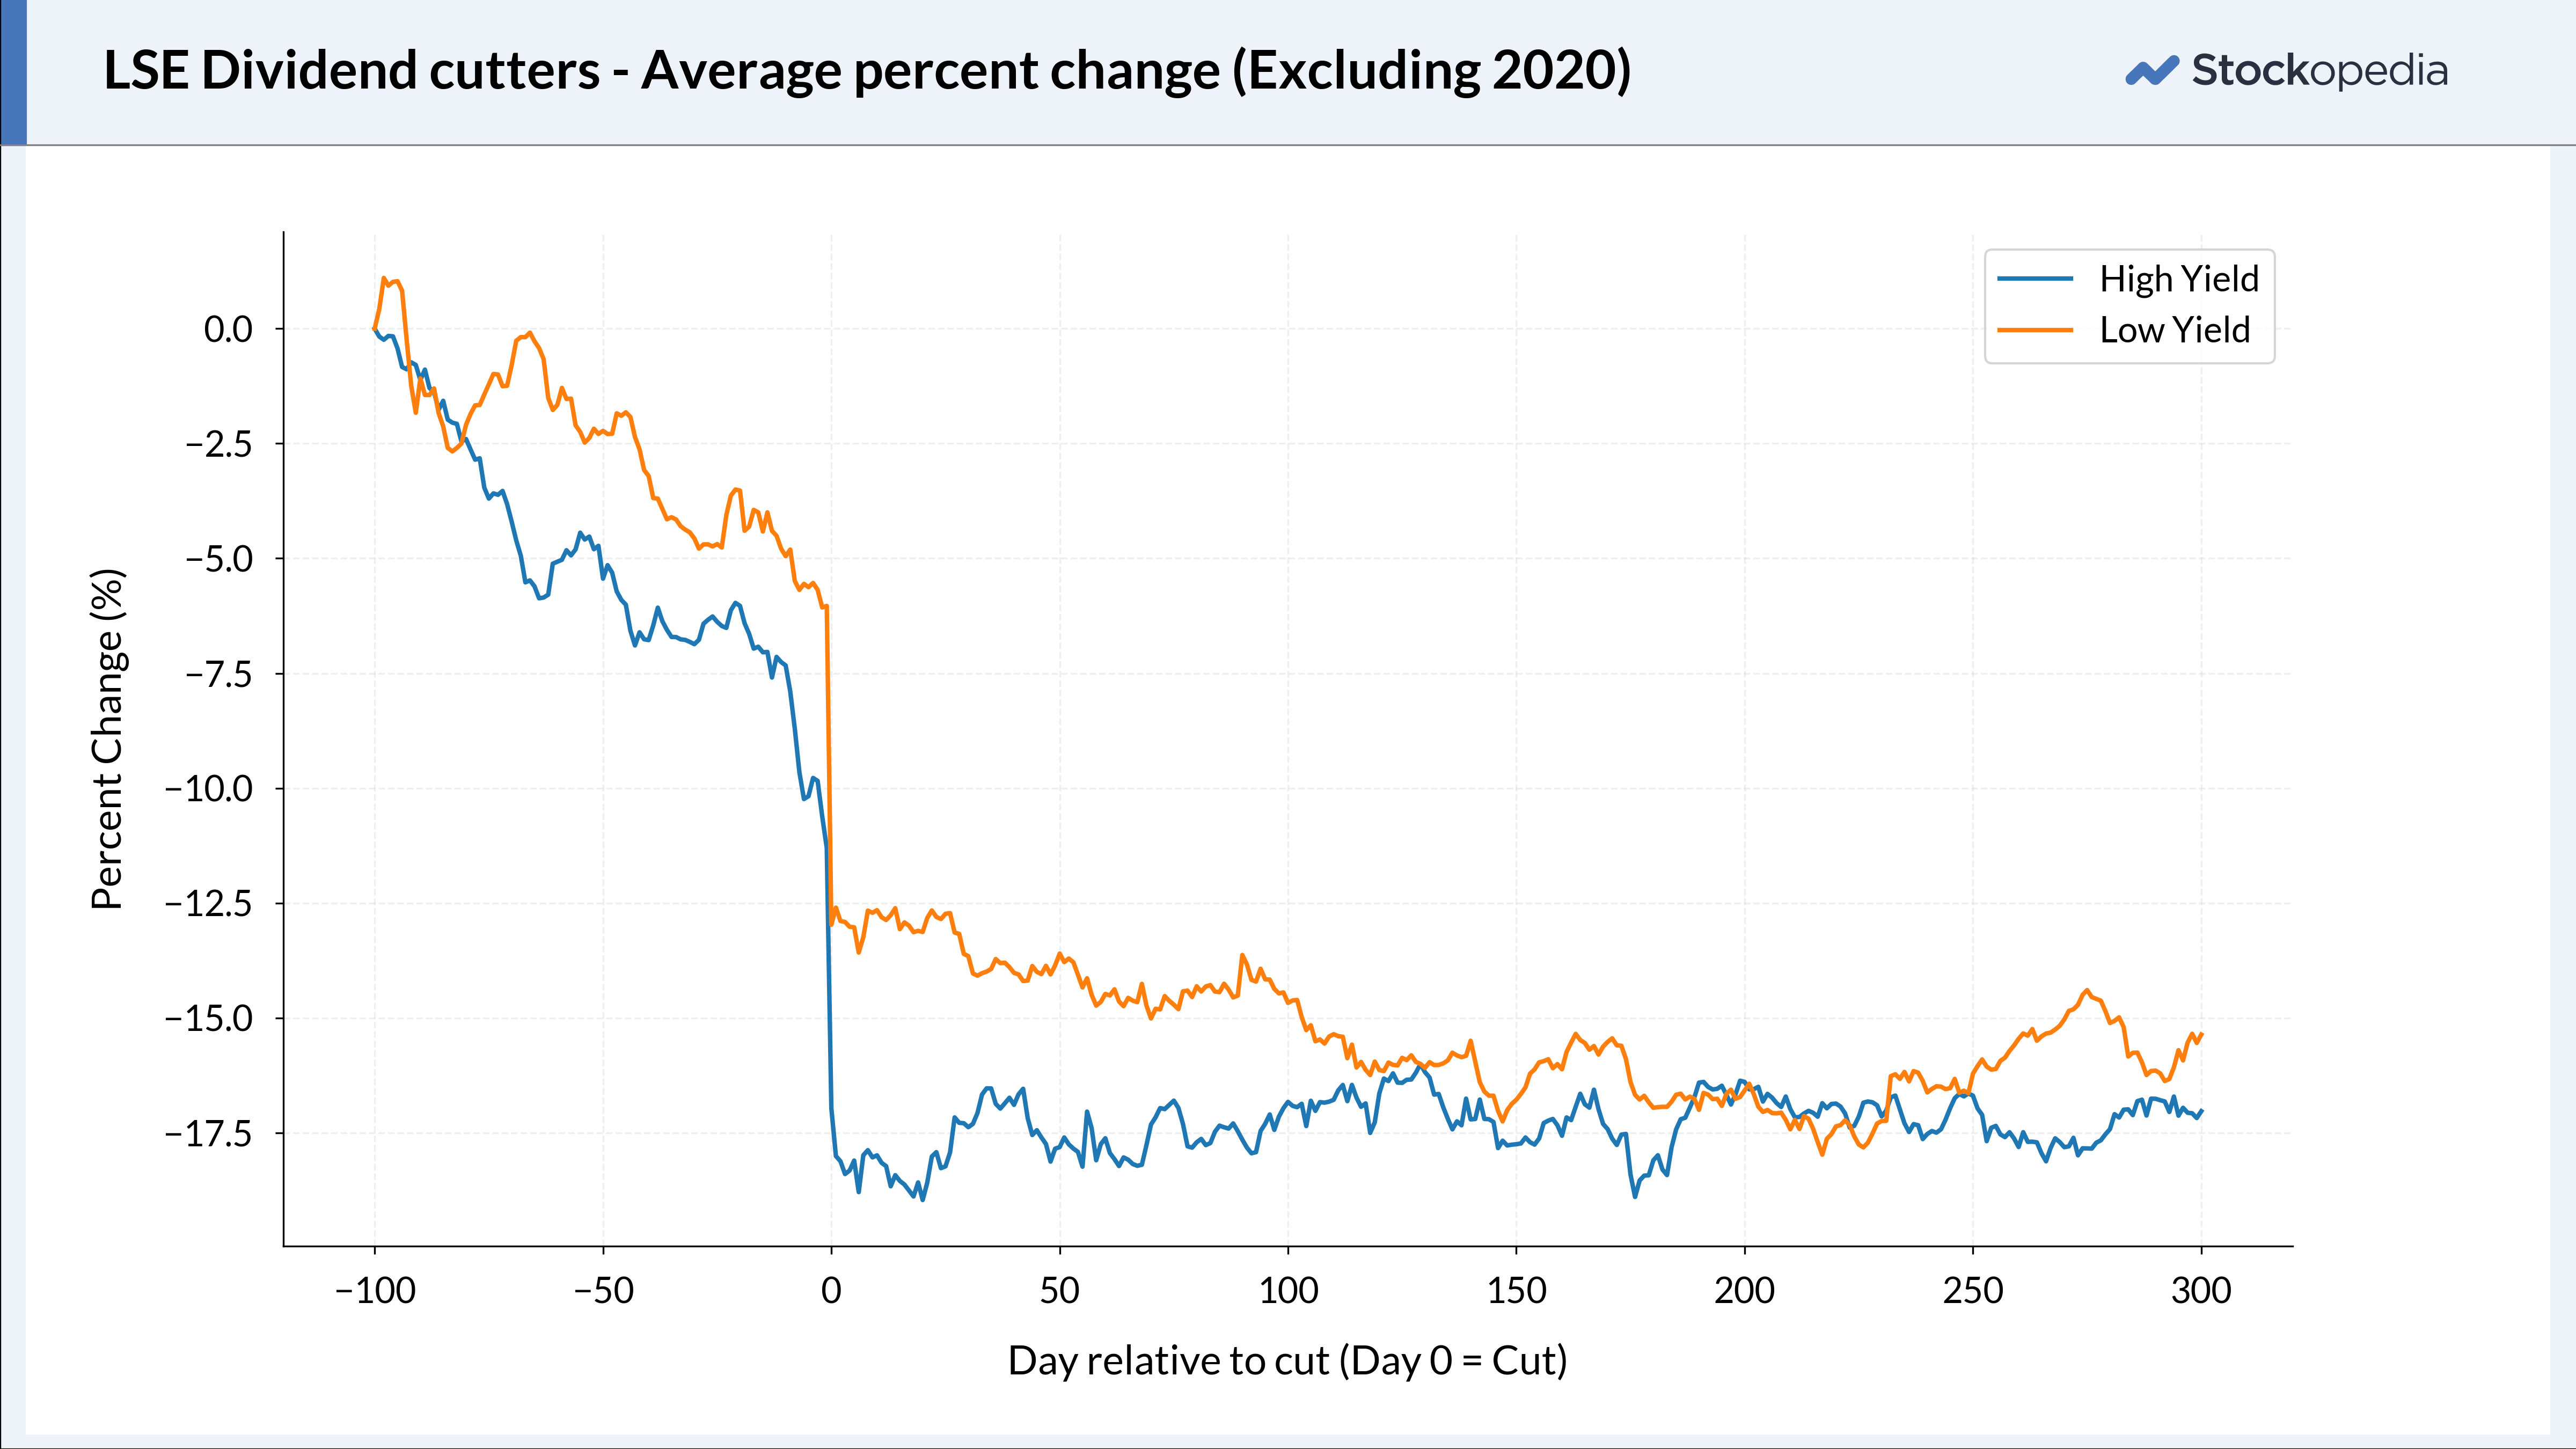
According to the ‘wisdom of crowds’ theory, the collective knowledge of a large, diverse group is better at making decisions than the knowledge of any single individual. There are a few caveats: the theory assumes that the group is diverse, and that individuals in the group are not influenced by others. This theory is very applicable to the stock market. It nicely compliments the efficient market hypothesis, which argues that share prices reflect all available information about a given stock. Both theories emphasise the power of collective knowledge.
The stock market is made up of investors (i.e., the ‘crowd’). They often make independent decisions using their own information. In turn, the collective action of all these investors lead to stock prices that accurately reflect all available information. Can this collective knowledge foresee a dividend cut? Yes, quite possibly. In the run-up to a dividend cut, investors have access to market data which can suggest a dividend is at risk. Let’s look at a few examples:
- DFS Furniture announced its dividend cut on 25 September 2024, explaining that the ‘market backdrop’ was ‘significantly more challenging than we expected.’ This news did not come out of the blue. An earlier trading statement on 12 June noted that trading conditions had ‘remained challenging’ and shipping issues ‘have persisted resulting in delays to customer deliveries and higher freight costs.’
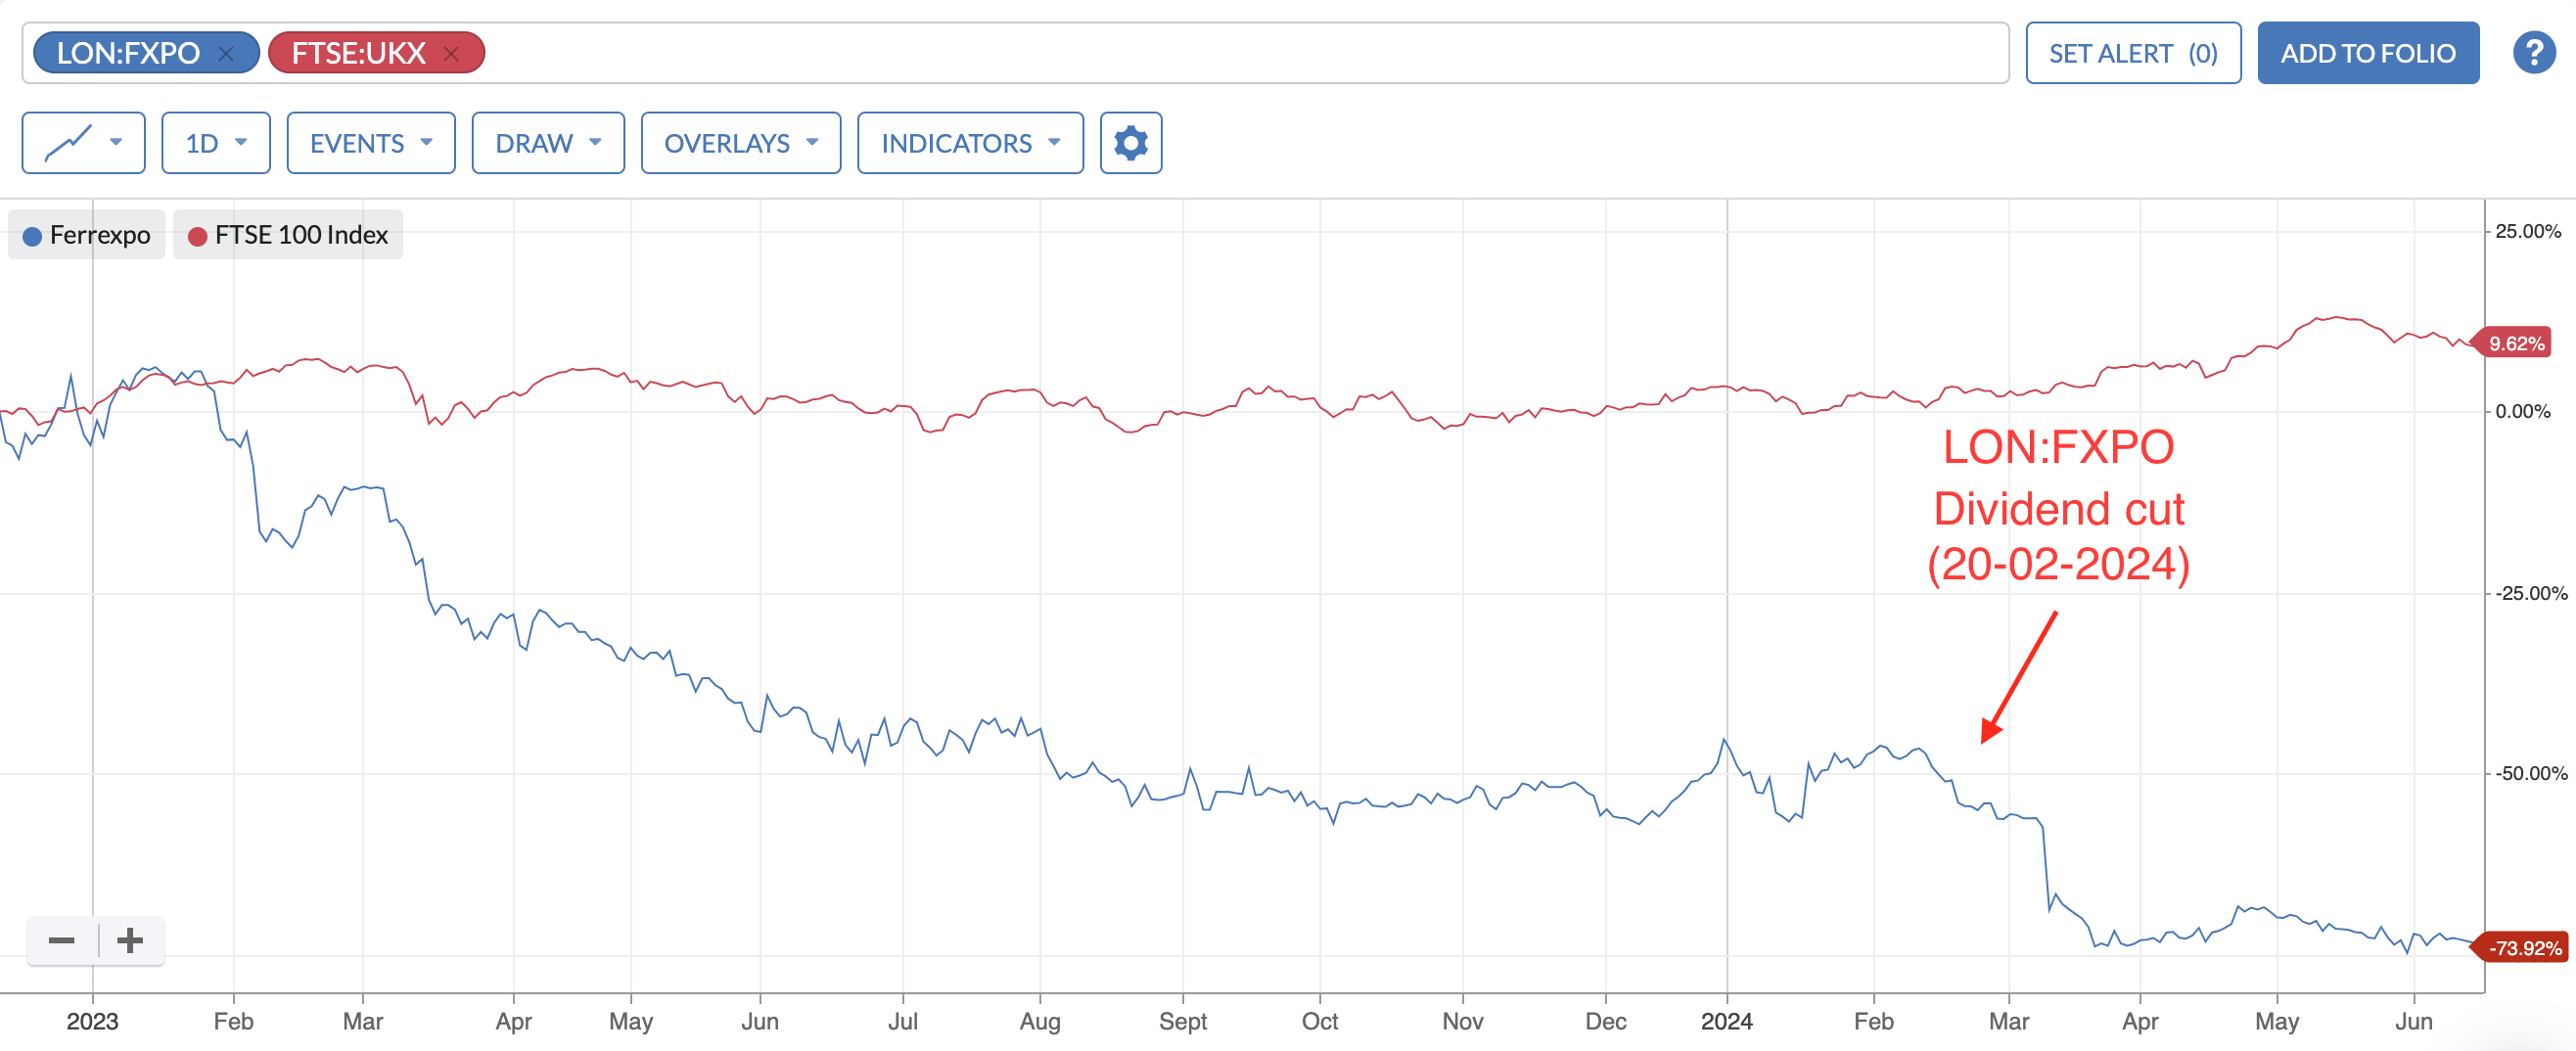
- Ferrexpo announced on 20 February that ‘the Board of Directors has decided not to proceed with the Company's proposed interim dividend’. The group explained: ‘The decision to withdraw the Interim Dividend follows subsequent and unexpected events in Ukraine relating to a claim against one of the Group's Ukrainian subsidiaries’. Again, this news did not come out of the blue. Political risk in Ukraine was apparent well before February 2024.
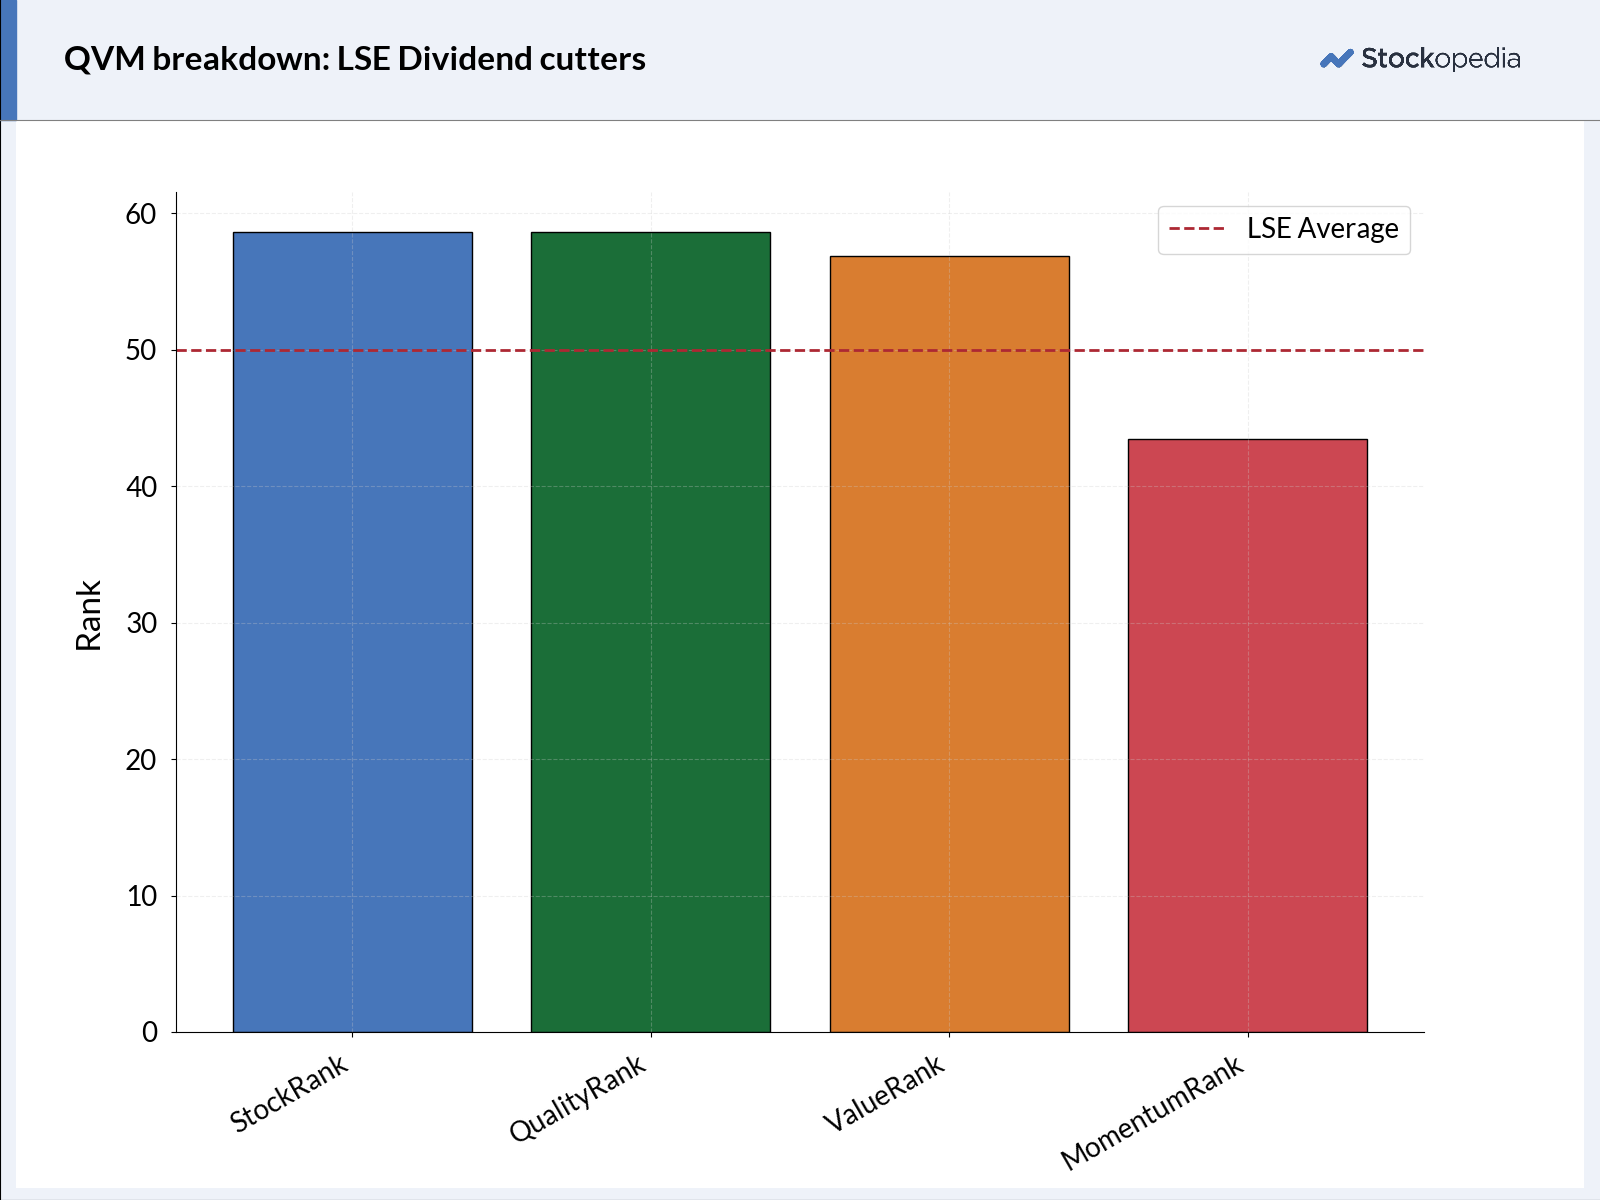
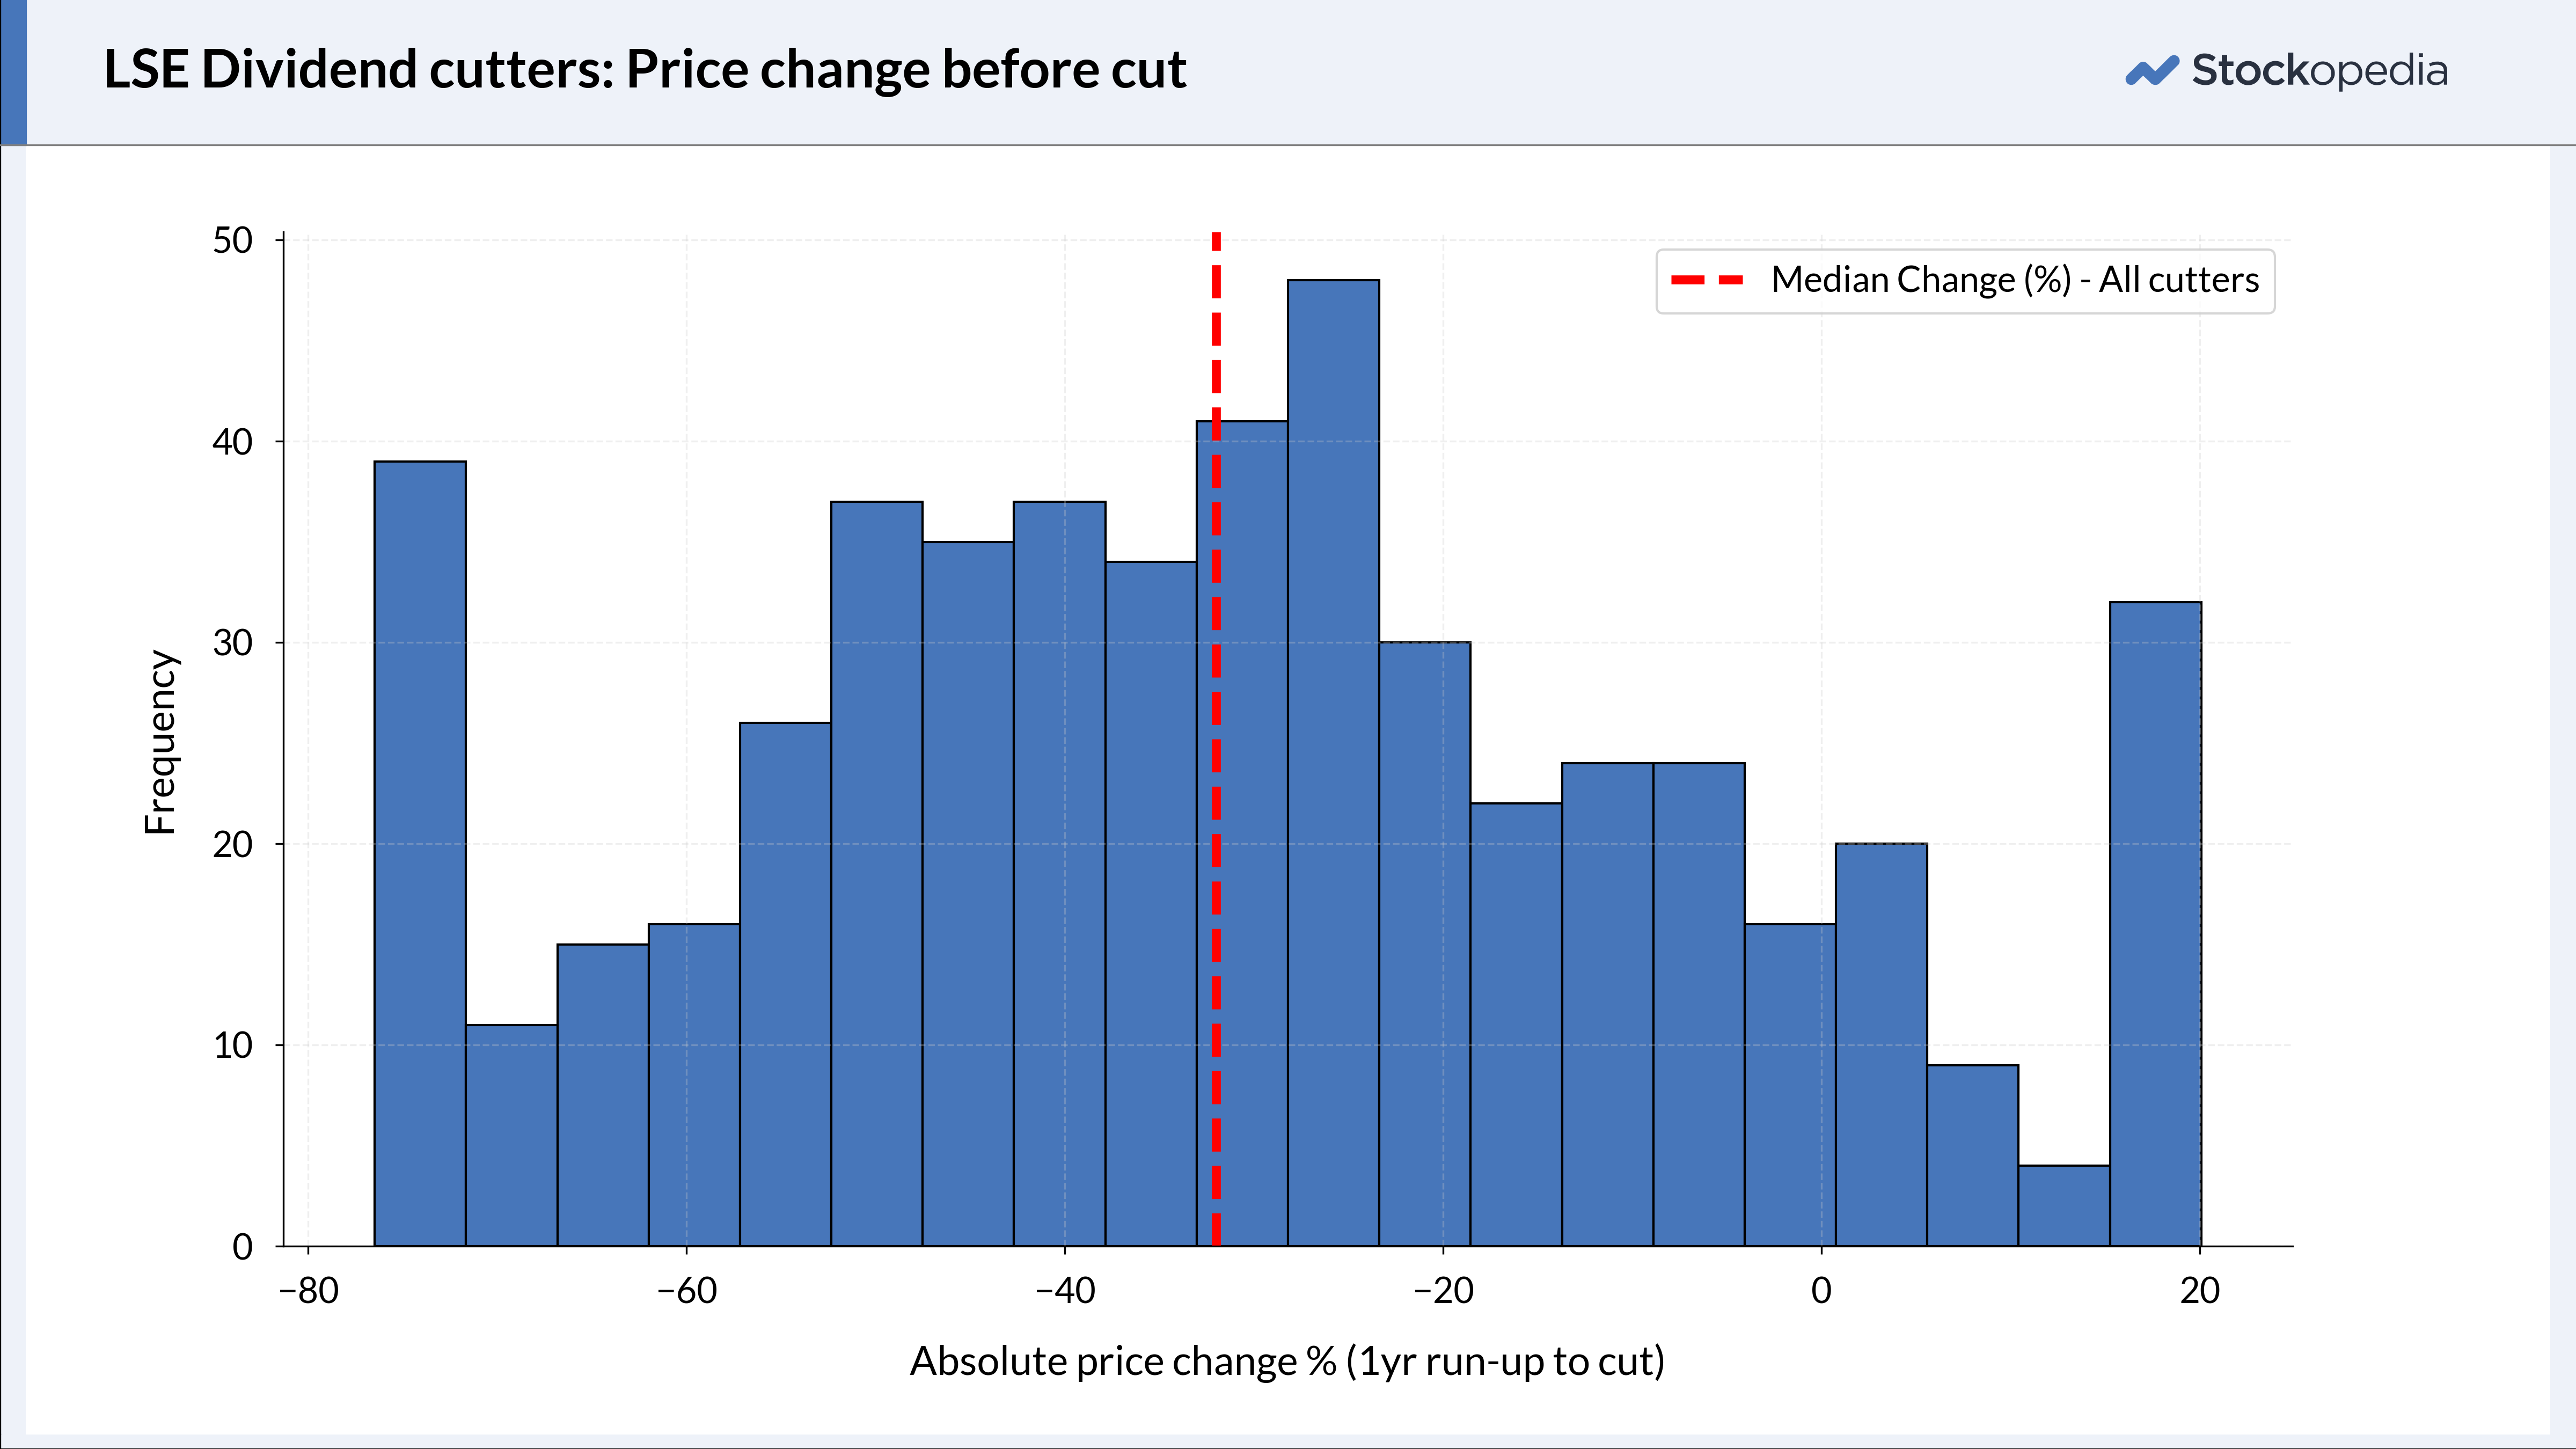
Perhaps we should take Buffet’s advise with a pinch of salt. Various factors cause the share price to decile even before the cut is announced. This is often reflected in a company’s MomentumRank, which assigns a higher rank to companies with stronger price momentum. Investors can therefore guard against dividend cuts by honing in on high momentum stocks. This method is employed by the US-based Russell Research as a component of its Russell High Dividend Yield Index Series. They exclude the bottom 10% of stocks ranked by 12-month price momentum.
If it looks too good to be true…
Movement over time can teach us much more than a single snapshot. The top bar chart above suggests that dividend cutters are likely to have a high ValueRank, but there is more nuance to it. More specifically, the ValueRank is high but rising…
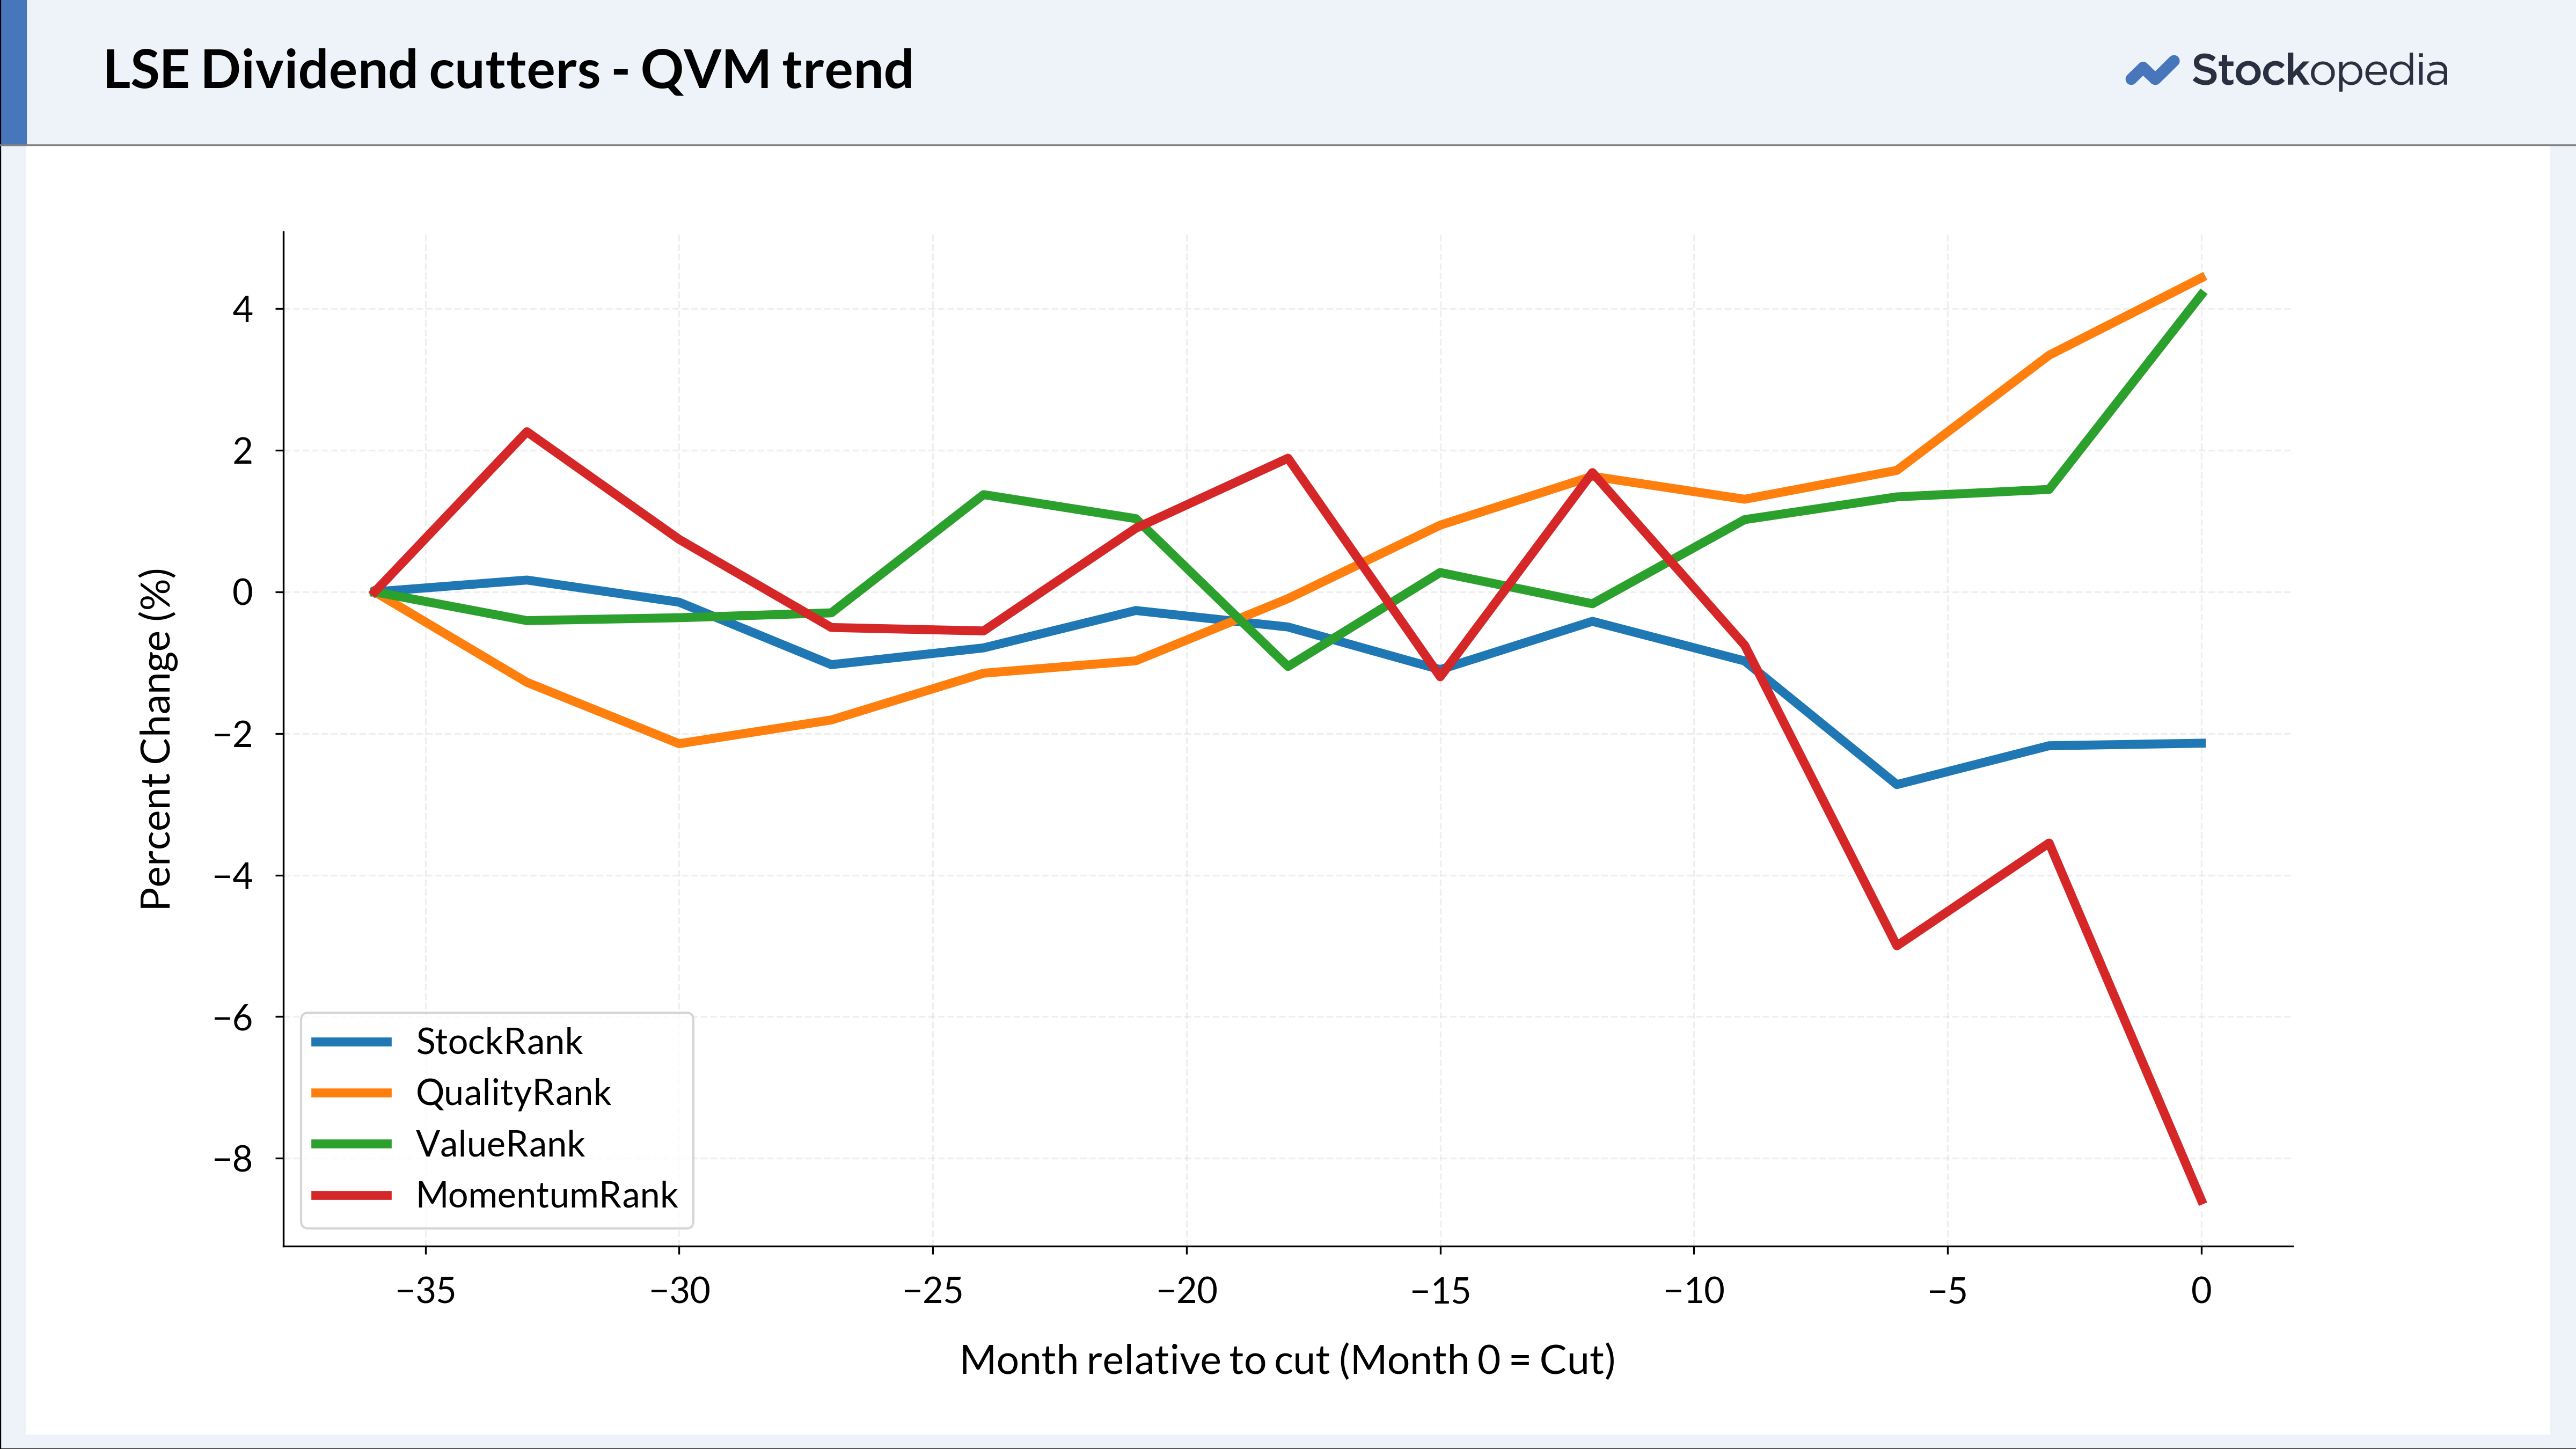
What exactly drives this trend? It is often driven by price momentum. Downwards price movements can penalise the MomentumRank, but as the price goes down, a stock becomes cheaper in terms of valuation ratios like the P/E ratio and the P/S ratio — fields which all feed into the ValueRank. As a result, value and momentum often move in opposite directions. Many readers will know that this trend is inverse correlation.
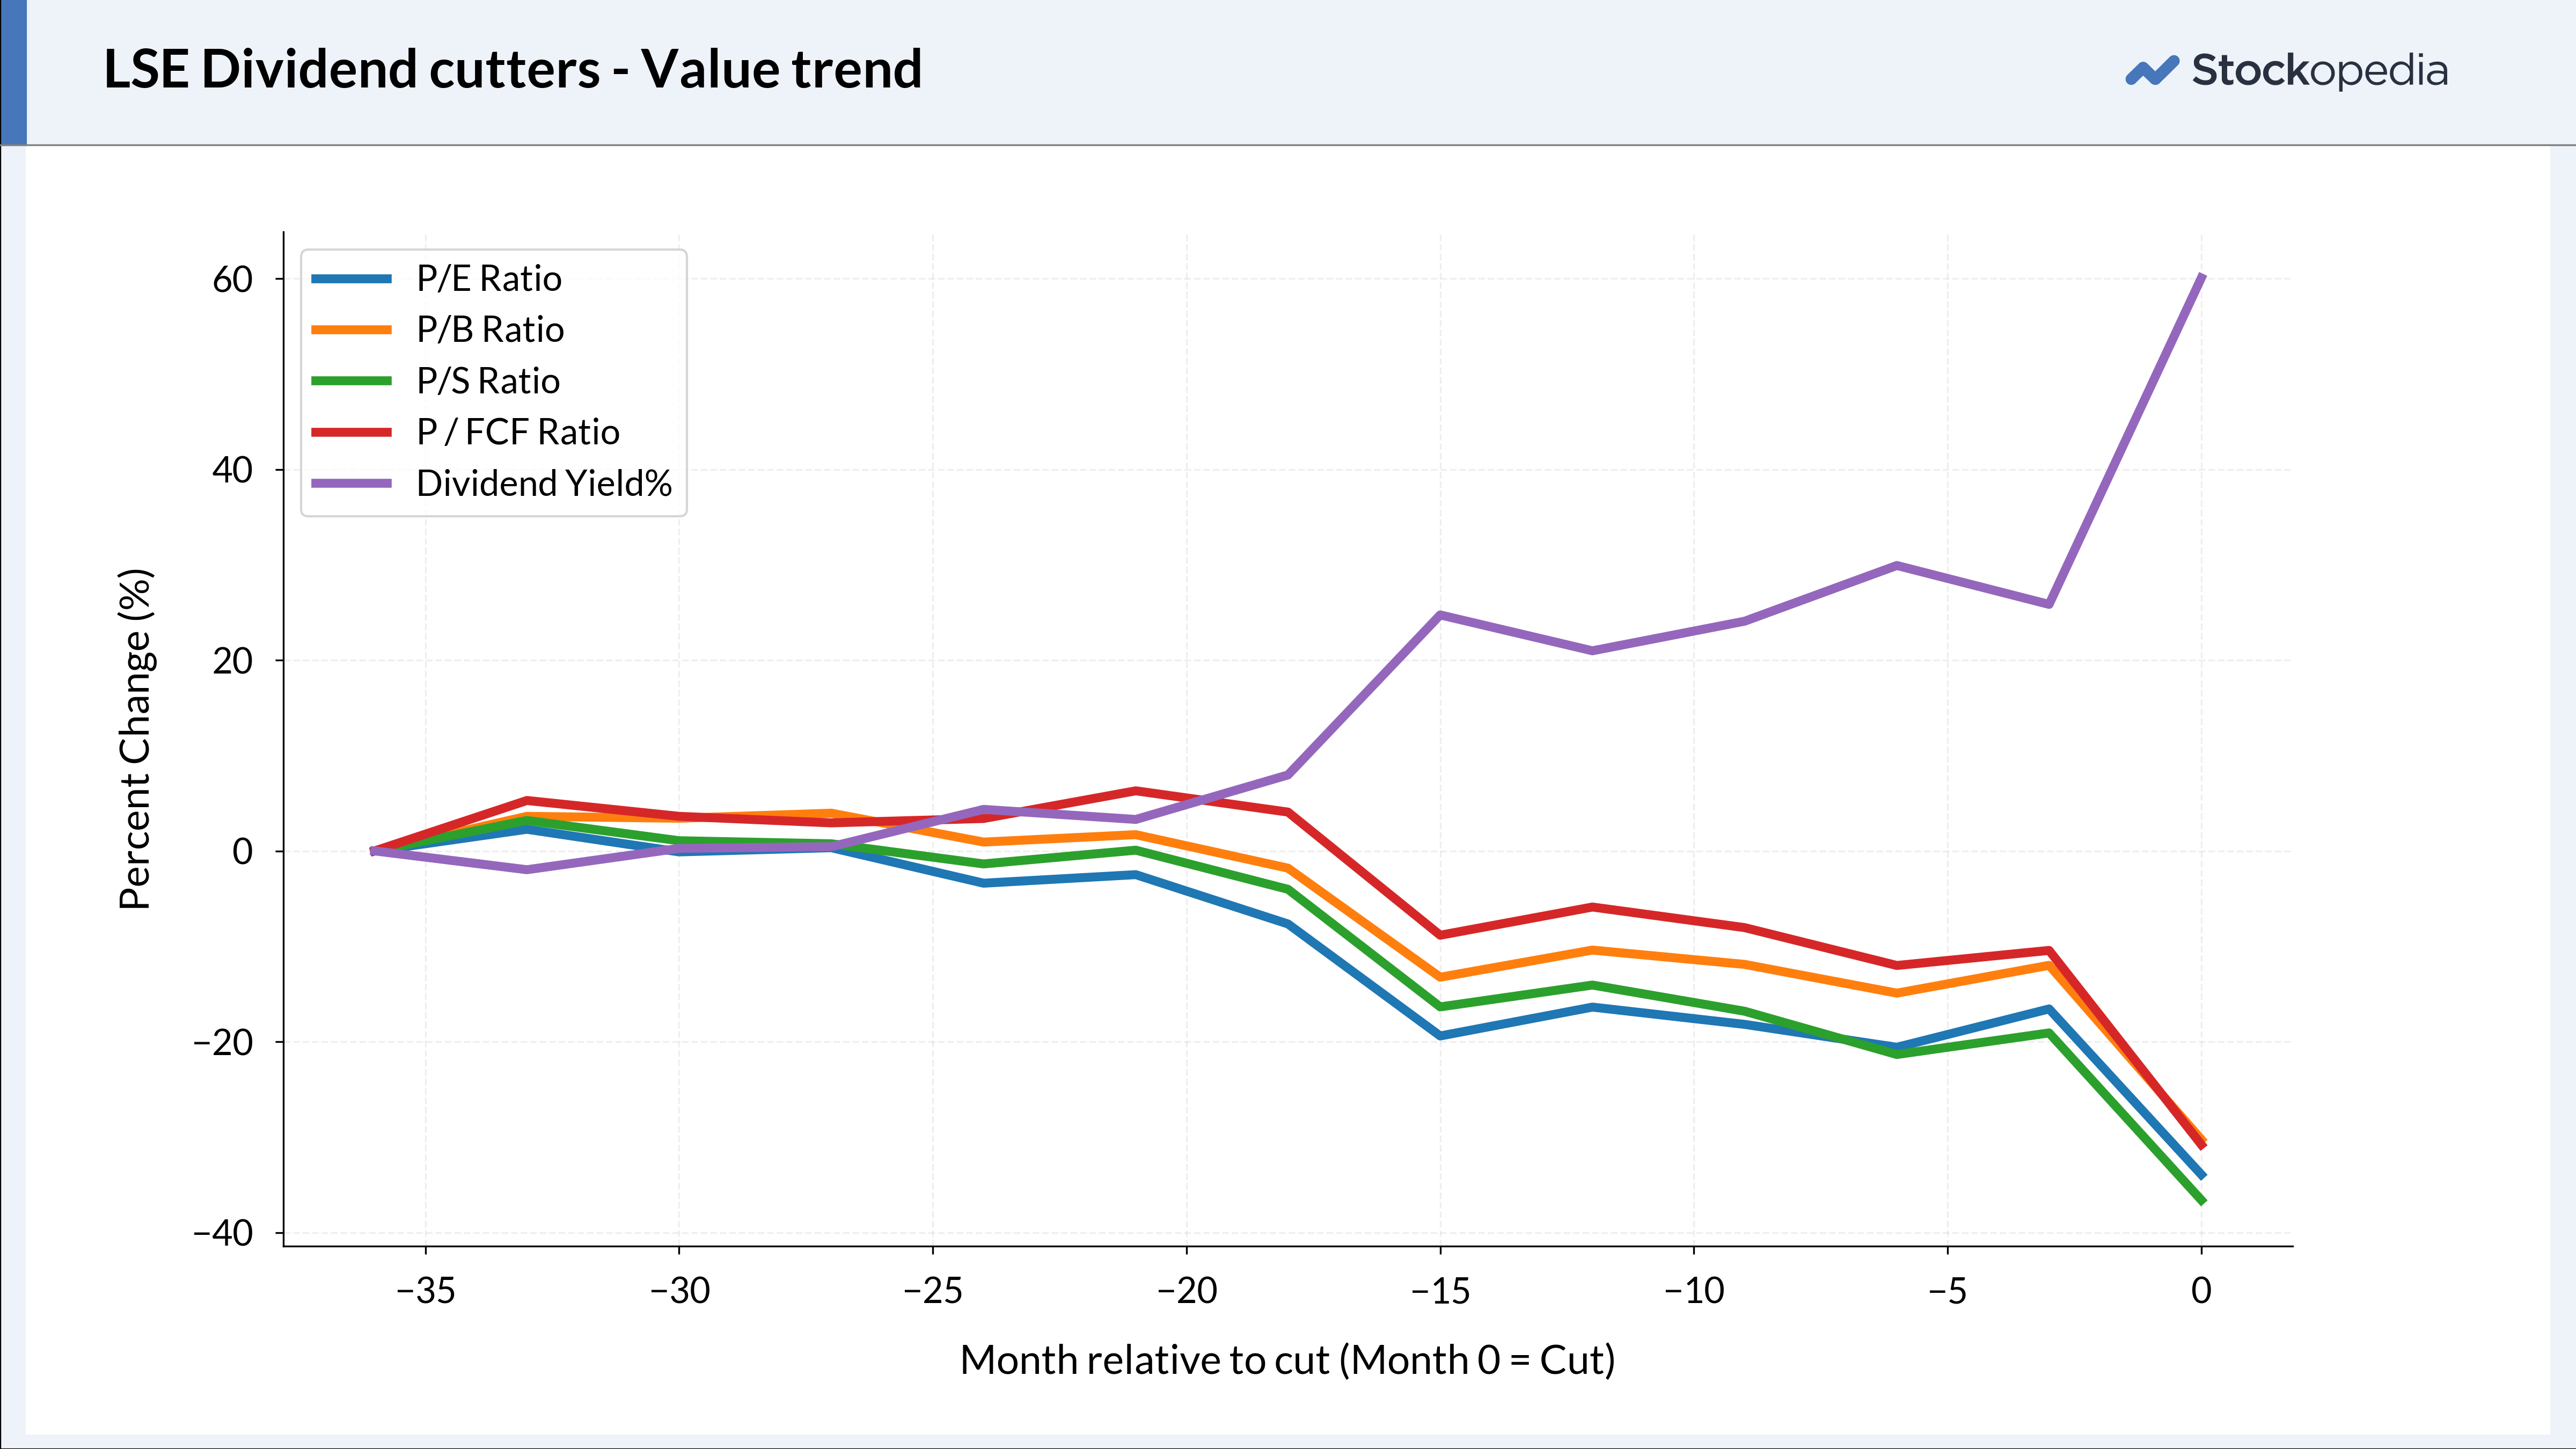
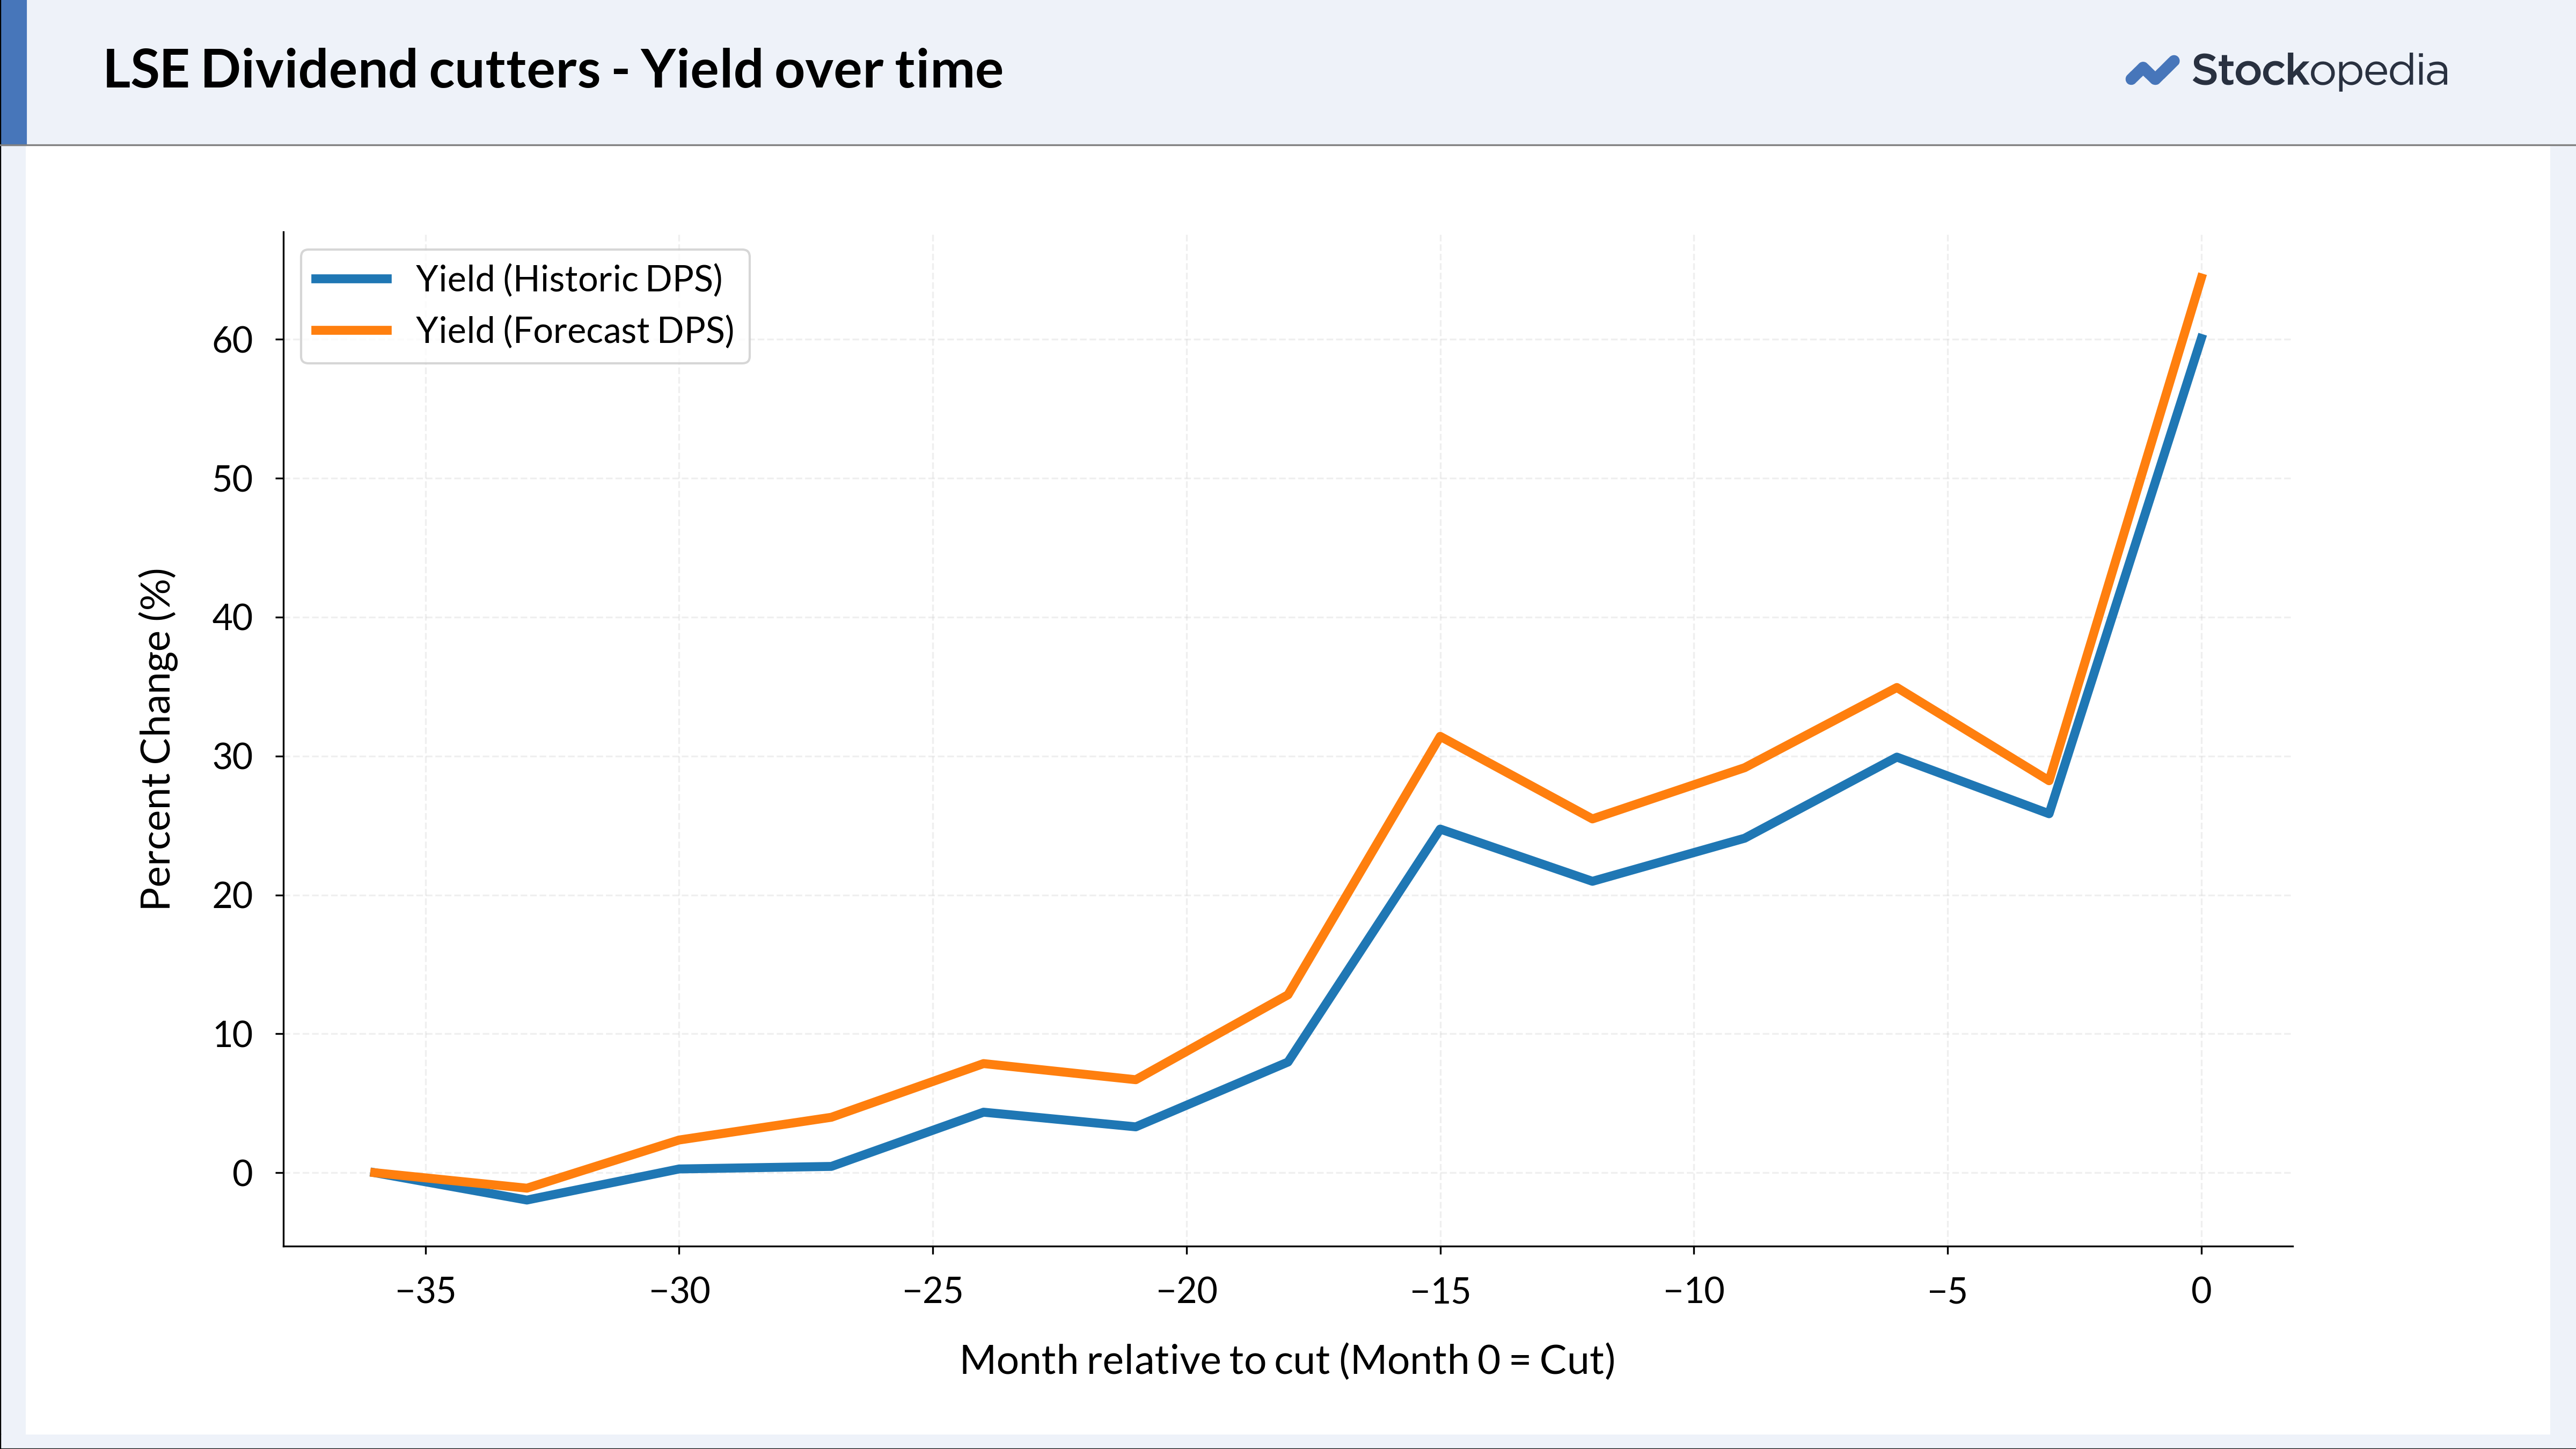
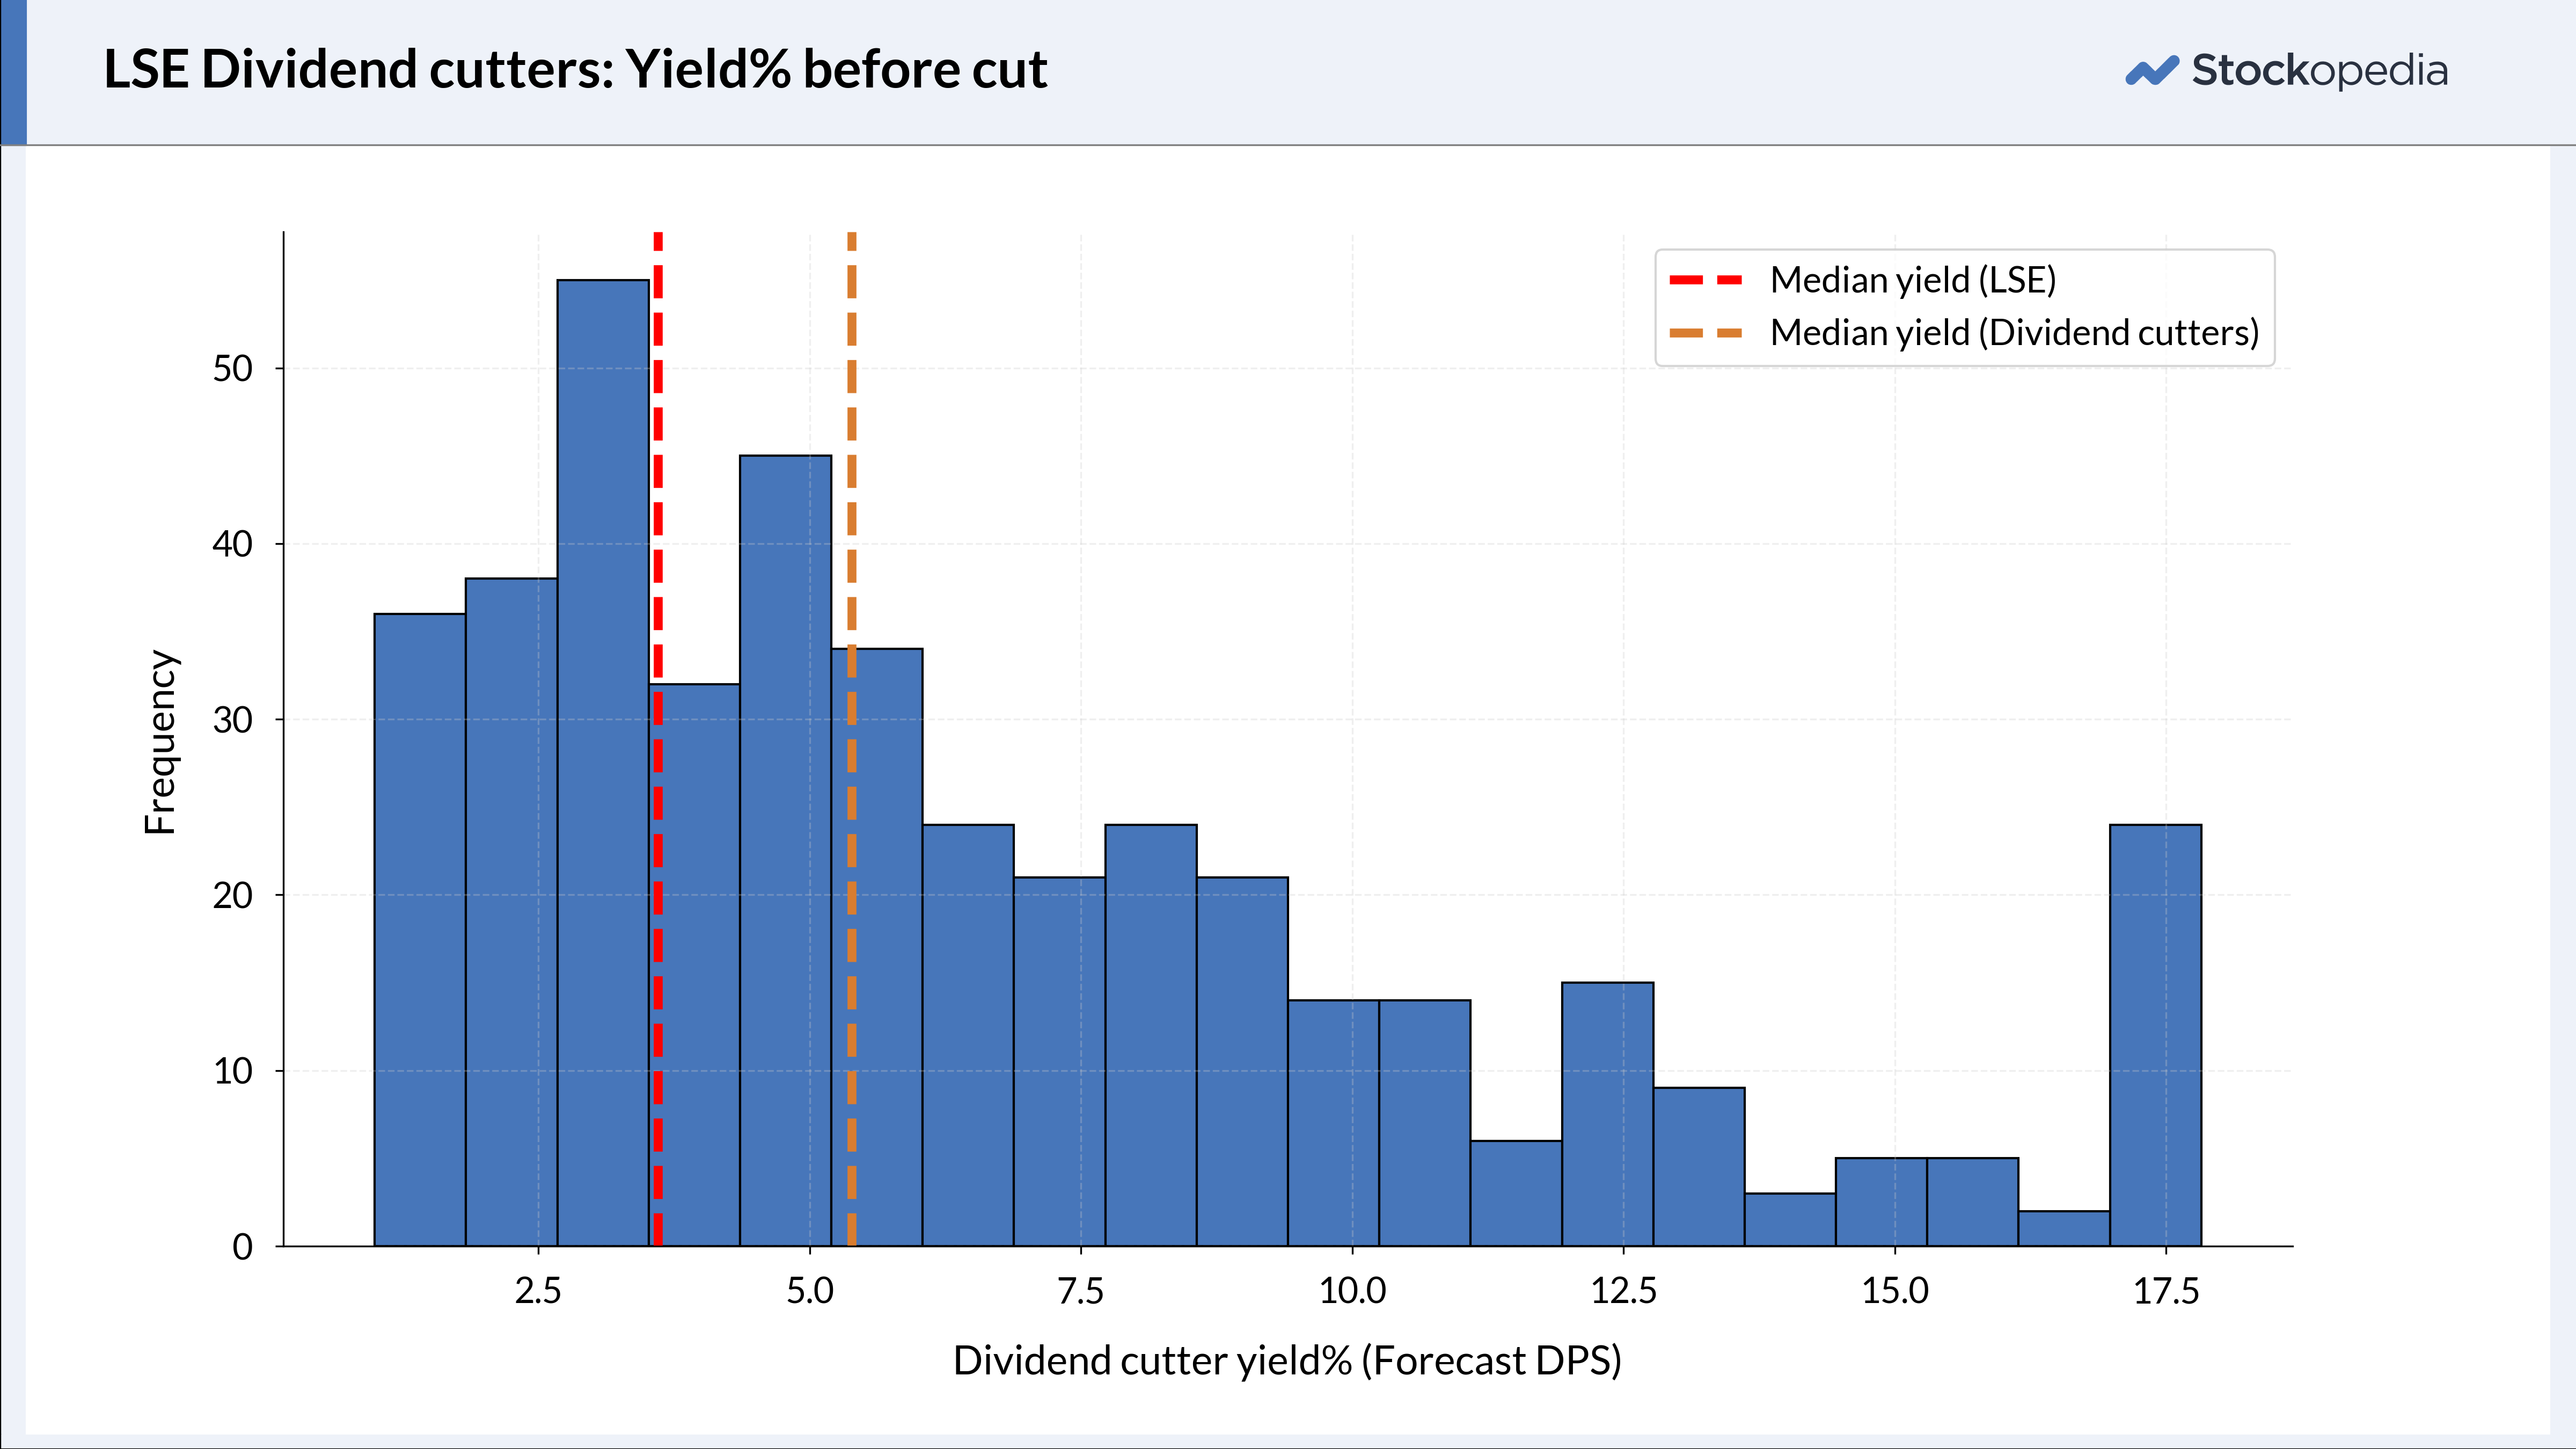
A price drop also causes the Yield to increase. When a company is about to cut its dividend, the yield may actually appear attractive; the dividend yield is usually rising, and on the day of the cut, the company often has a higher yield than the market median.
Be cautious, though — high-yielding companies are a bit like the sirens from ancient Greek myths, luring investors in with false promise. And this raises a critical question: How can investors separate the wheat from the chaff? What metrics can help them distinguish between potential dividend traps and genuine dividend quality?
Separating the wheat from the chaff
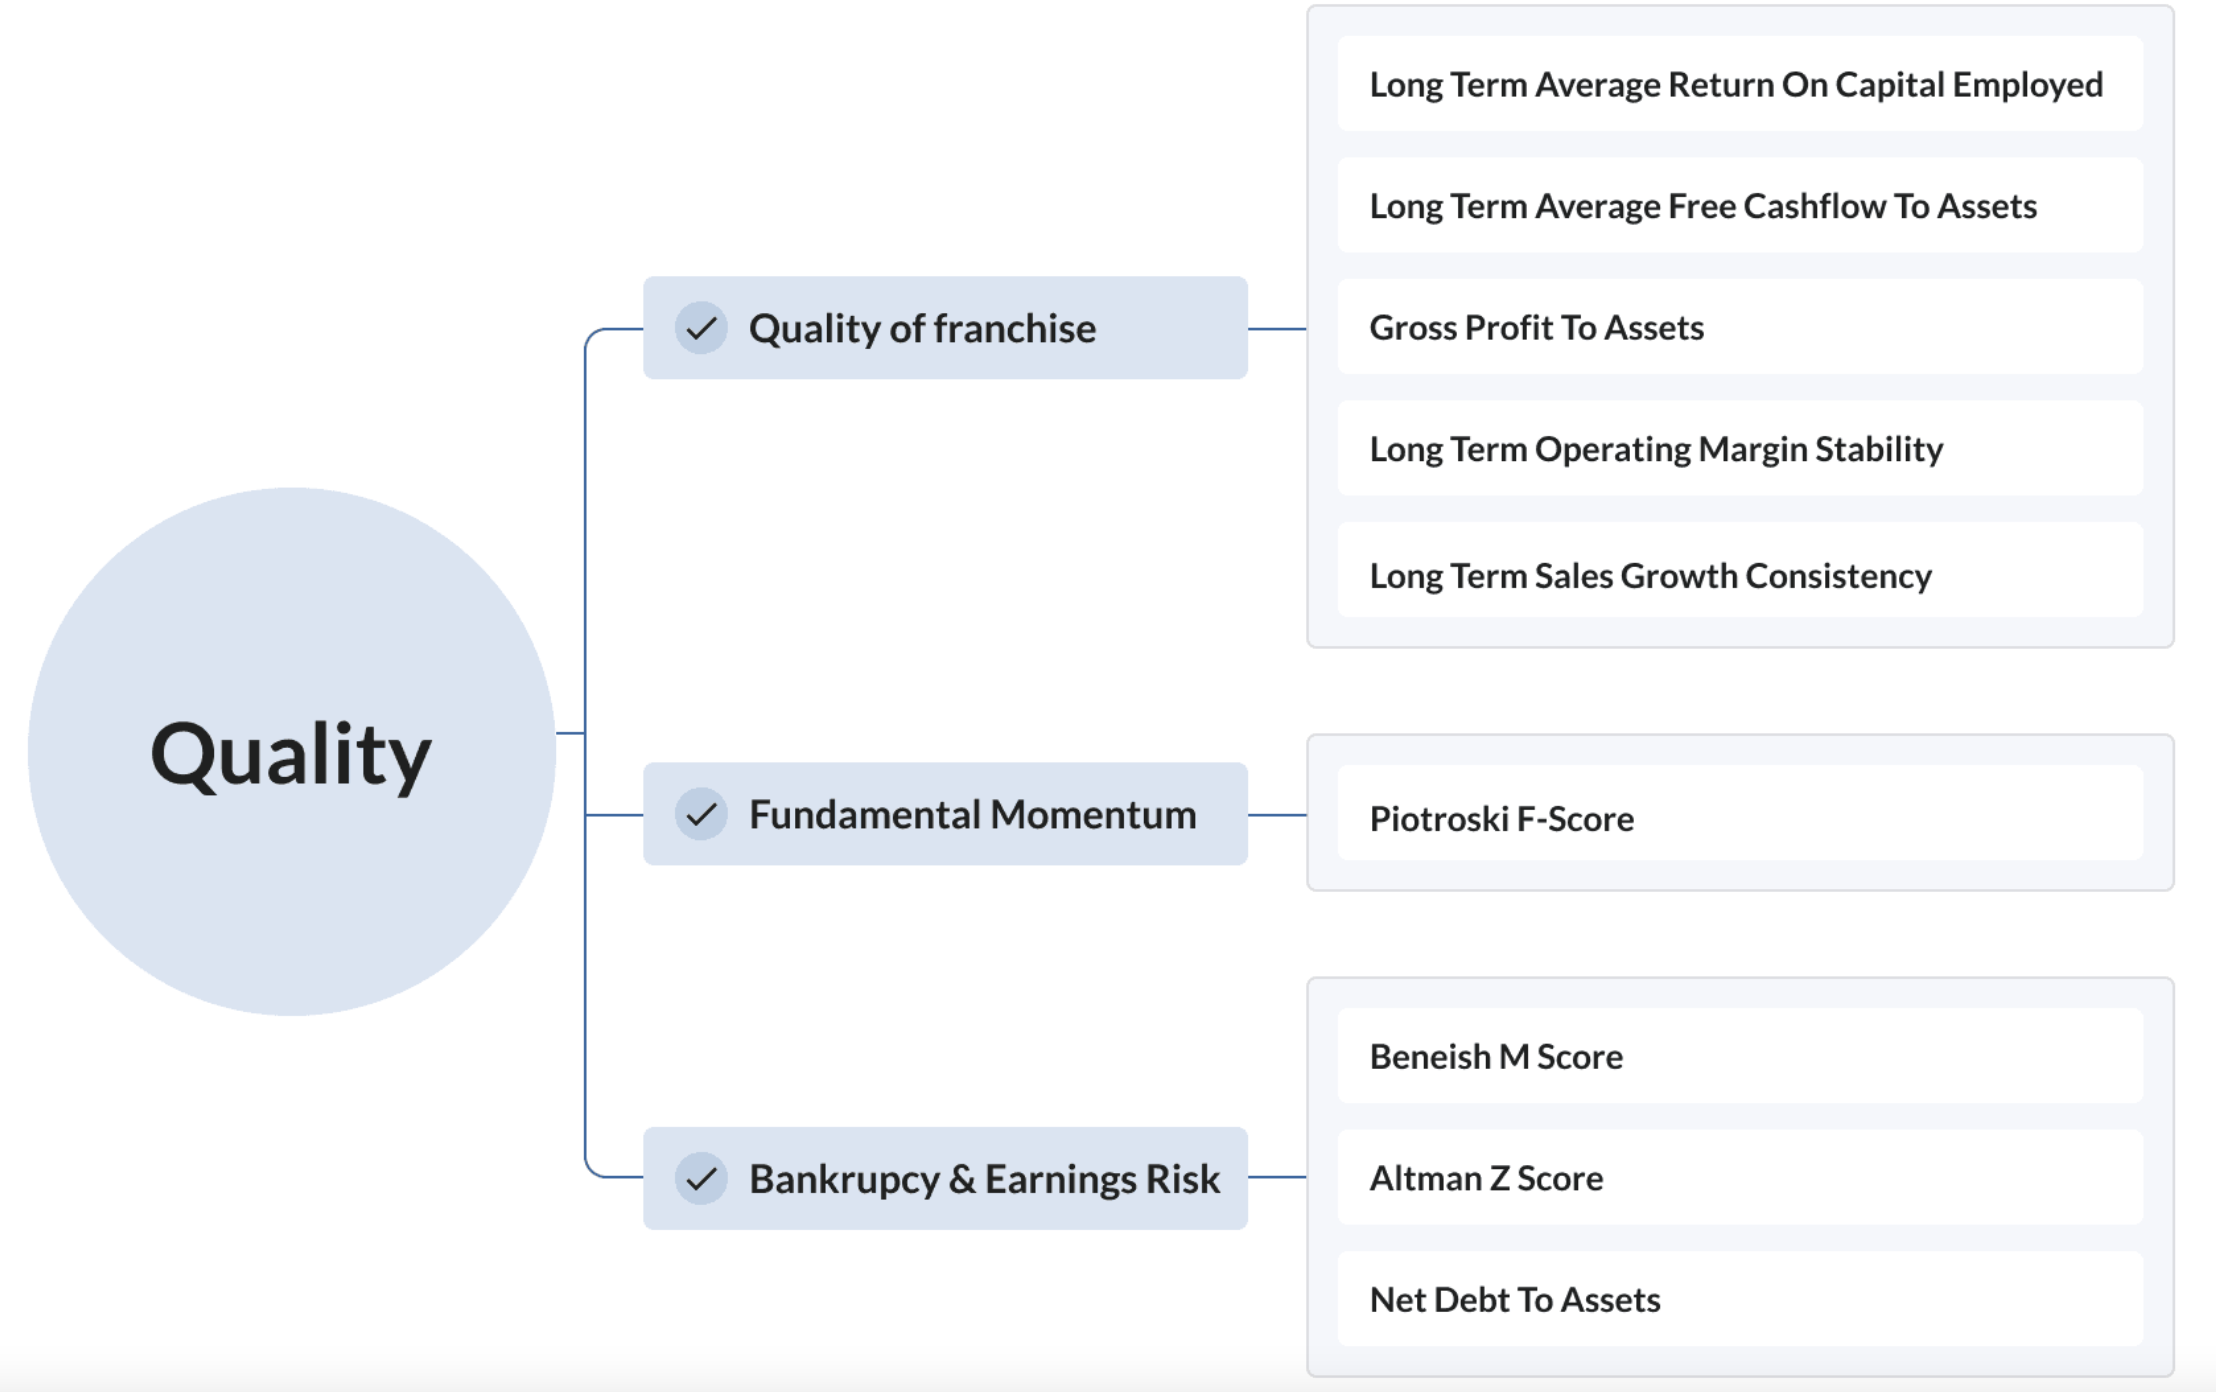
The QualityRank is designed to identify profitable, cash generative, and financially stable companies — companies which are in theory ideal dividend payers, given that dividends are ultimately paid out of profits and cash.
At the same time, various studies have found that the best leading indicator of a dividend cut is fundamental momentum — i.e. the trend or change in profits and cashflow, rather than profits and cashflow at a single point in time. Fundamental momentum is only one component of the QualityRank. The rank also comprises long-term average ratios, which are more slow moving and may not be impacted by recent changes in a company’s financial position.
To analyse dividend safety, we should look at quality themes, like profitability and cashflows, but rather than look at the long-term average, we will look at recent fundamental trends.
Profitability
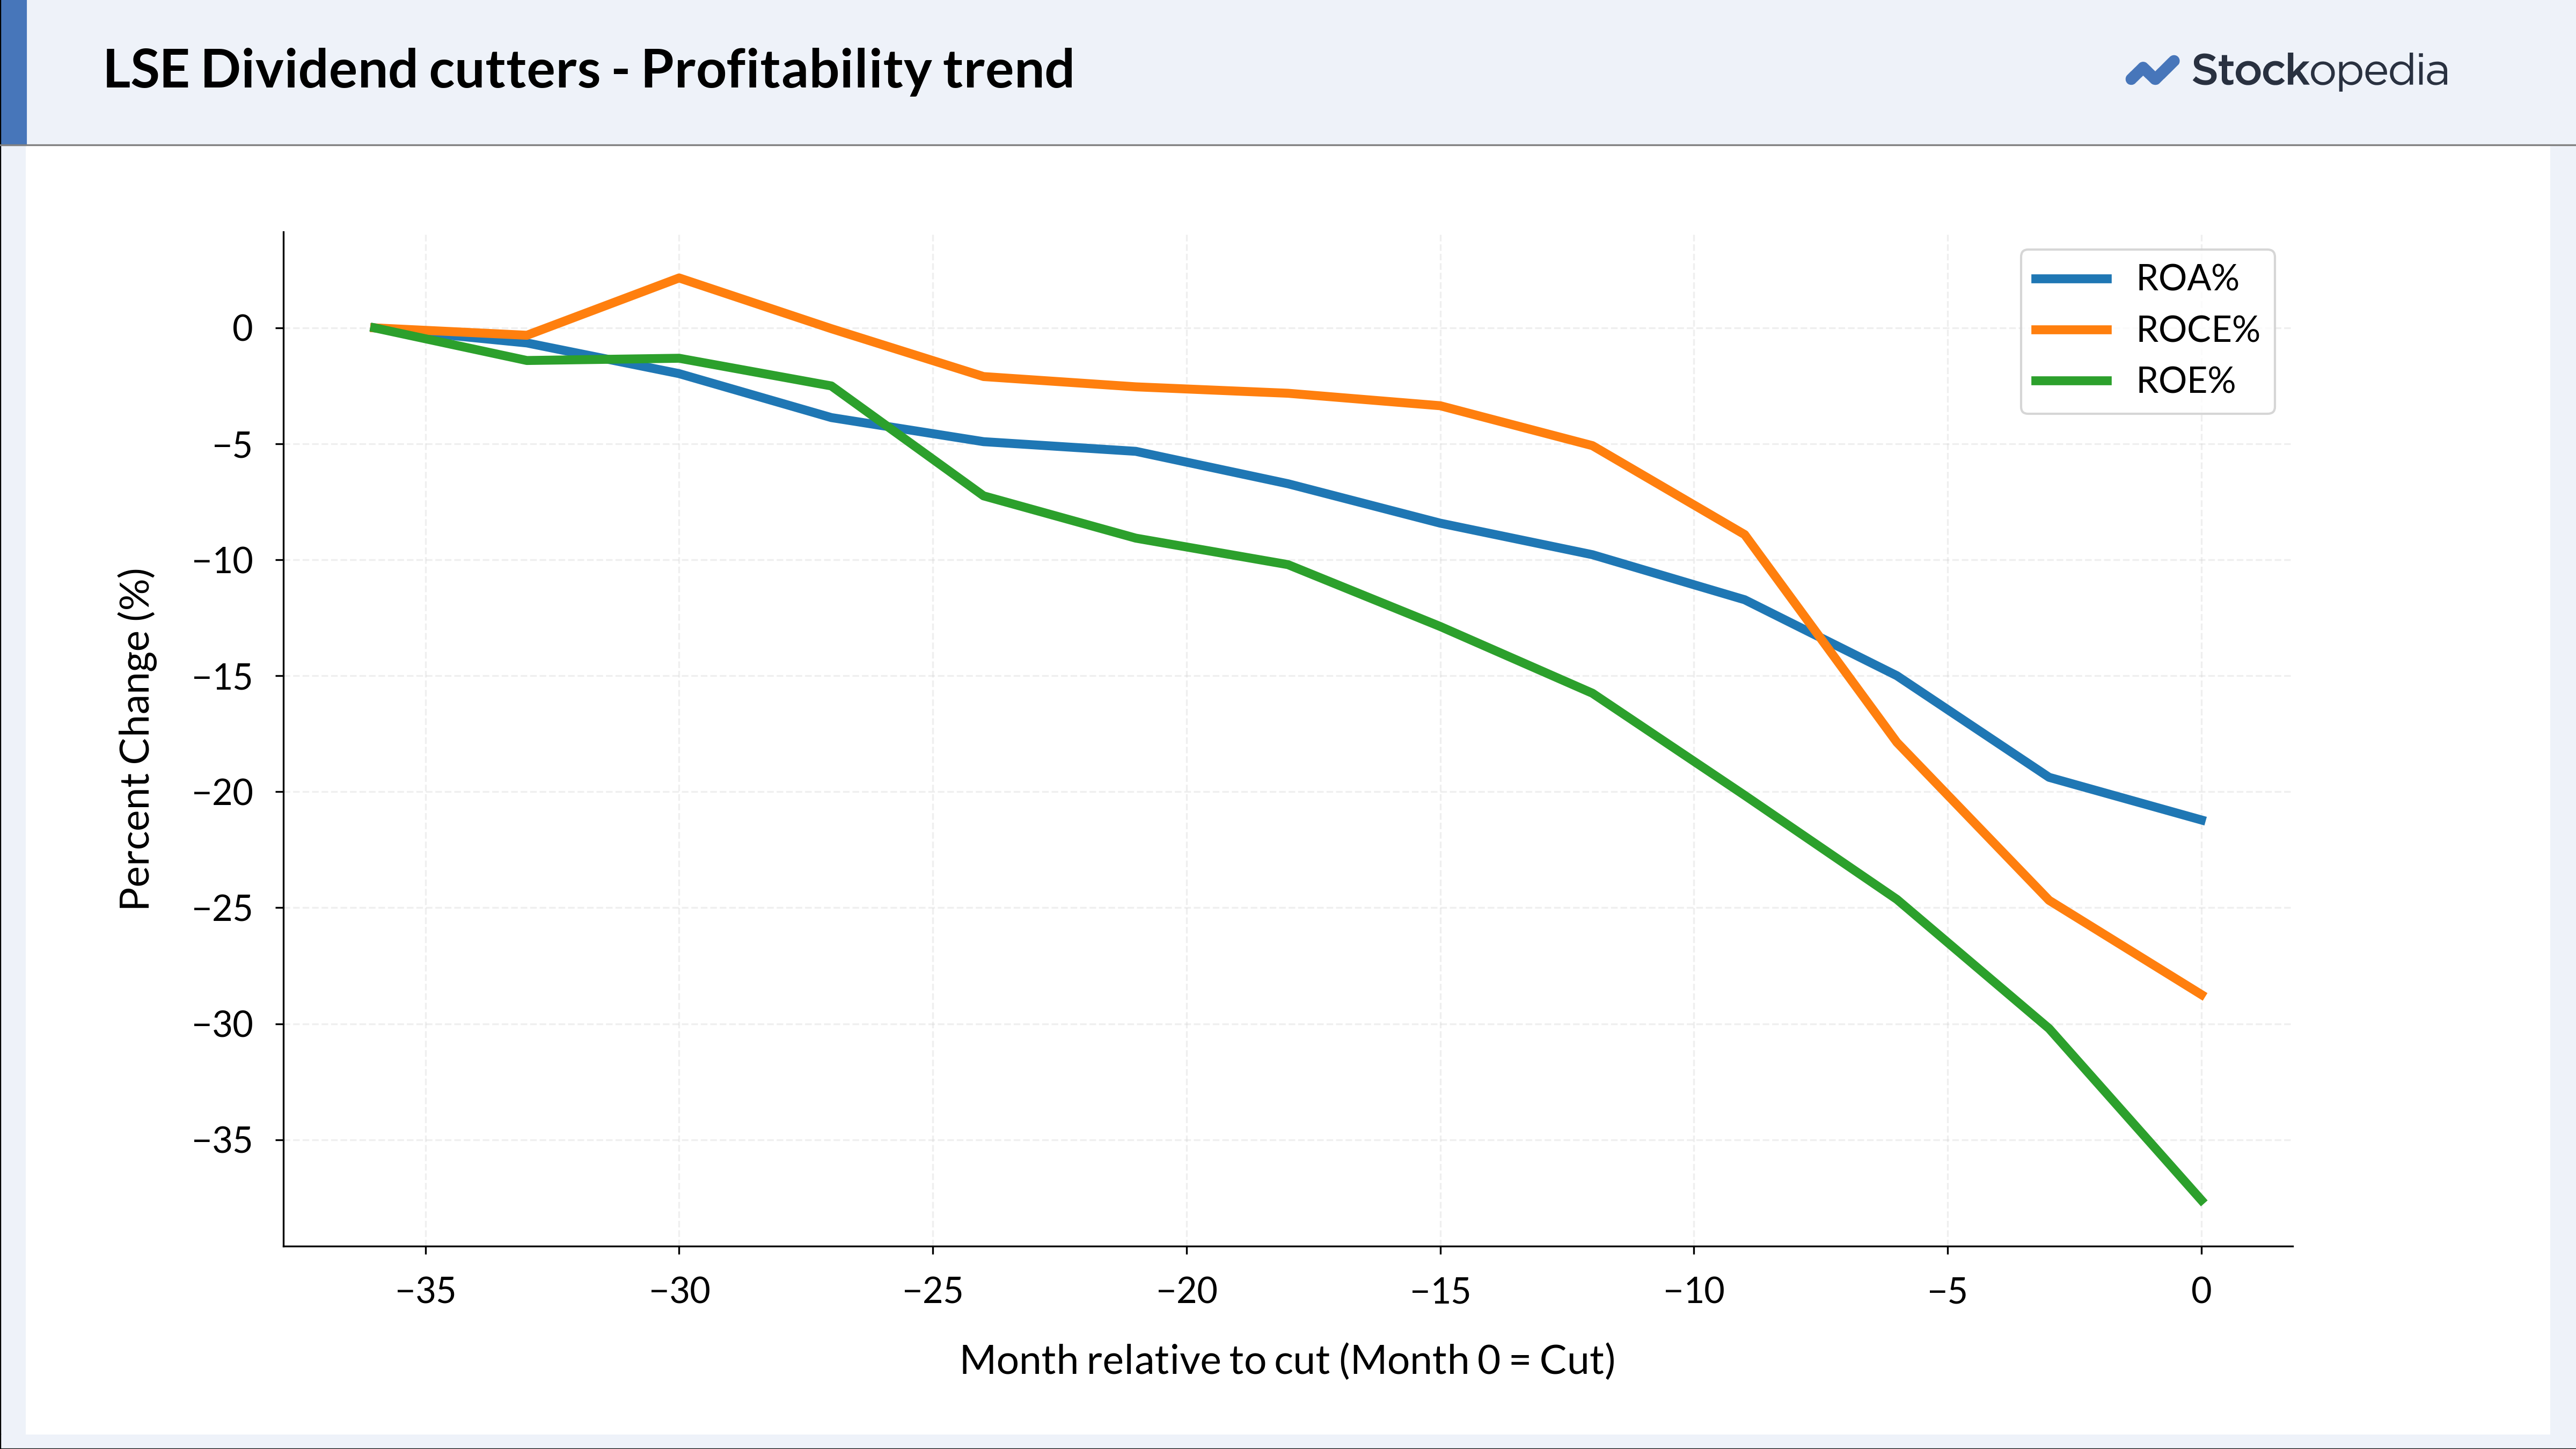
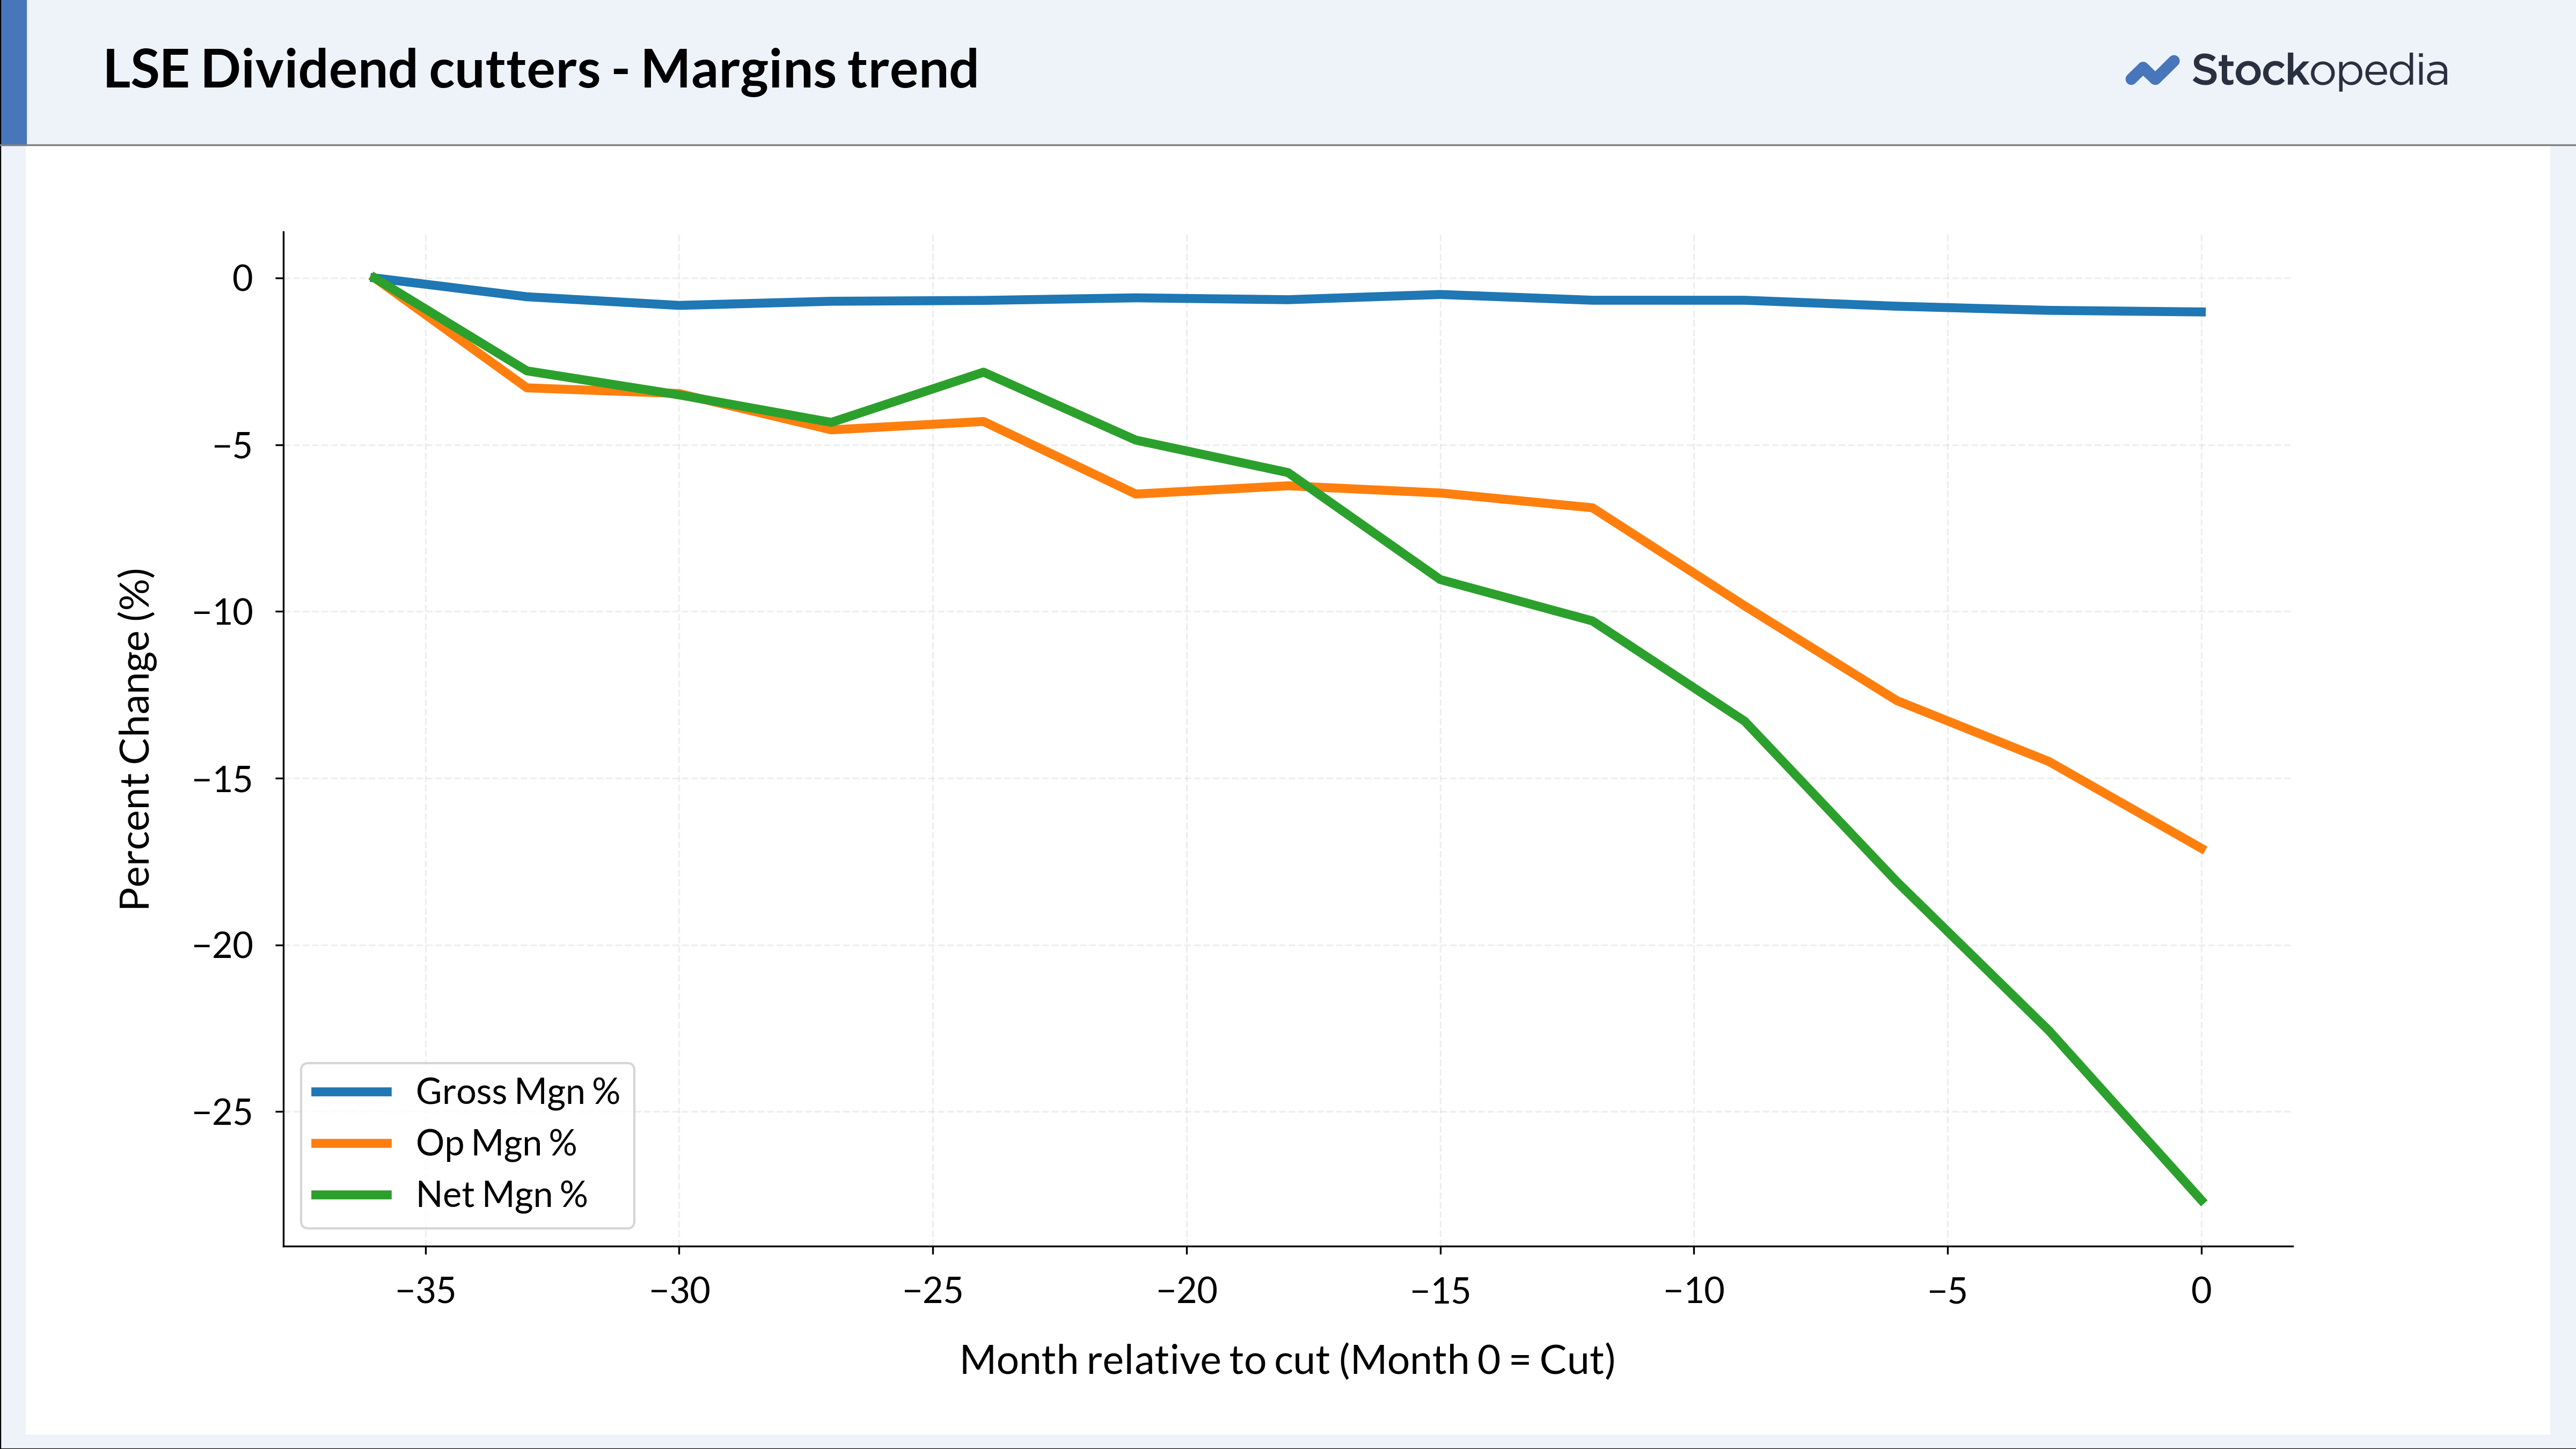
In the run-up to a dividend cut, we see a downwards shift in returns as well as margins.
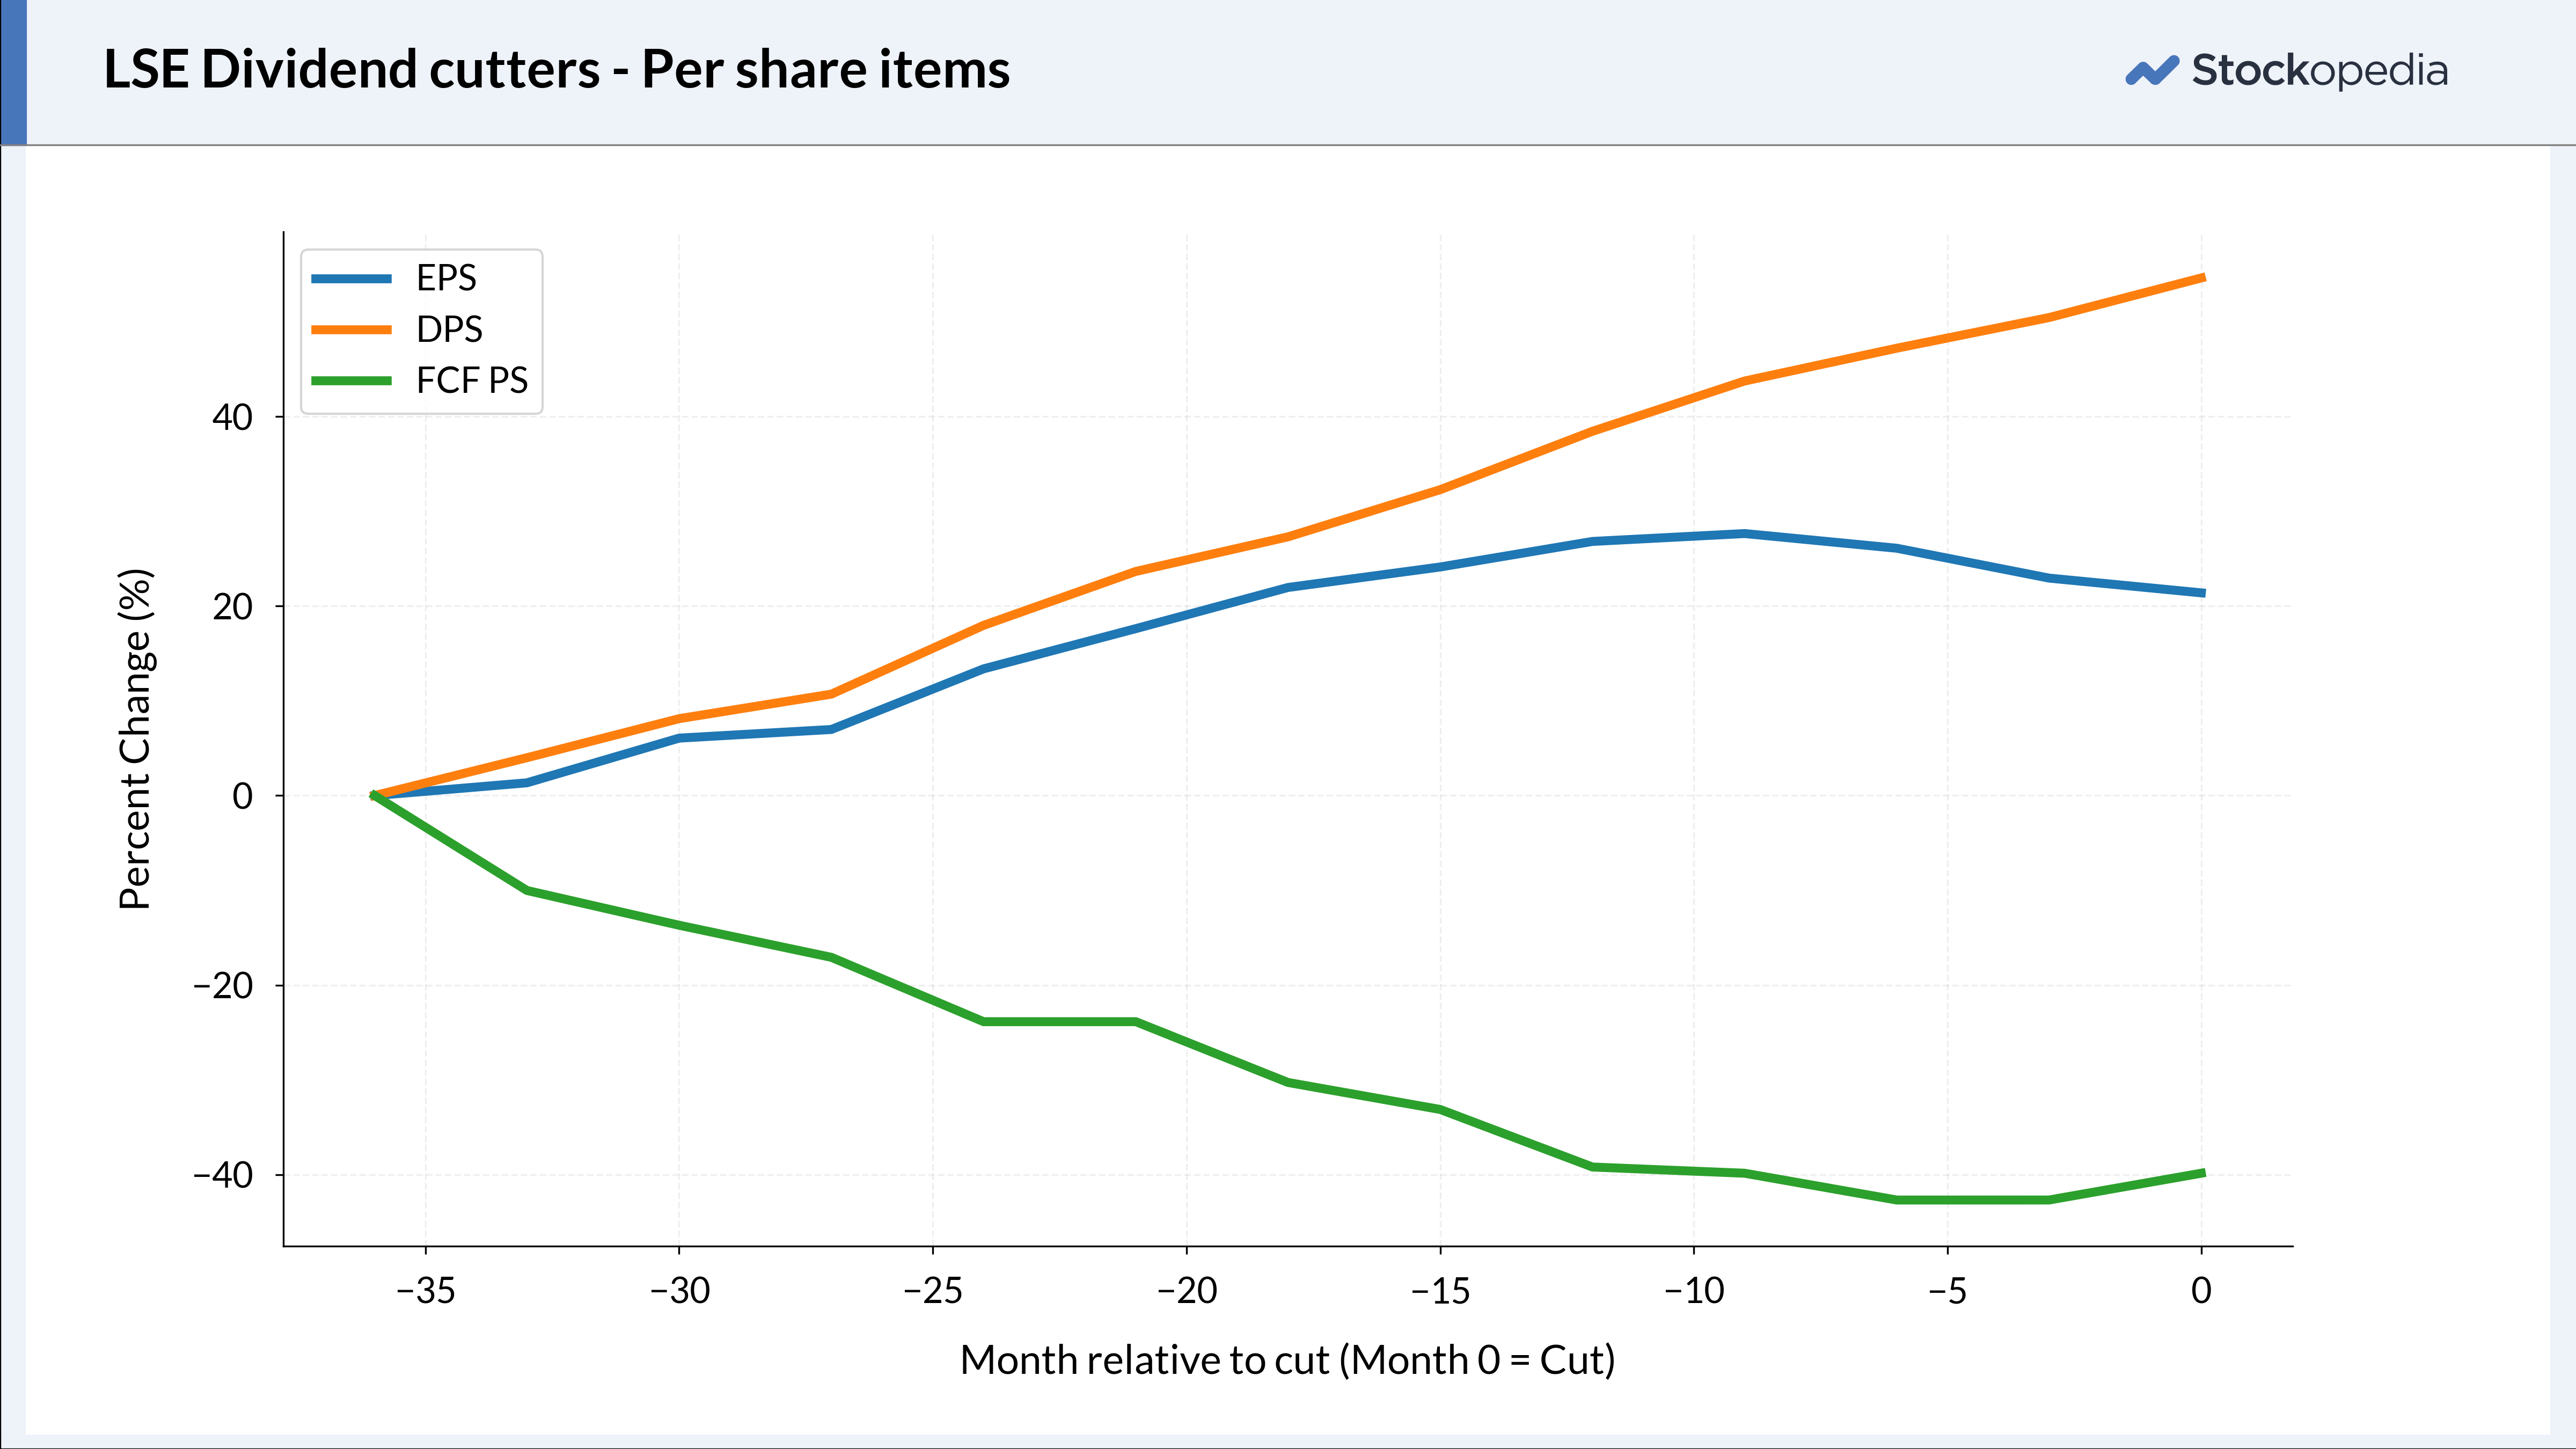
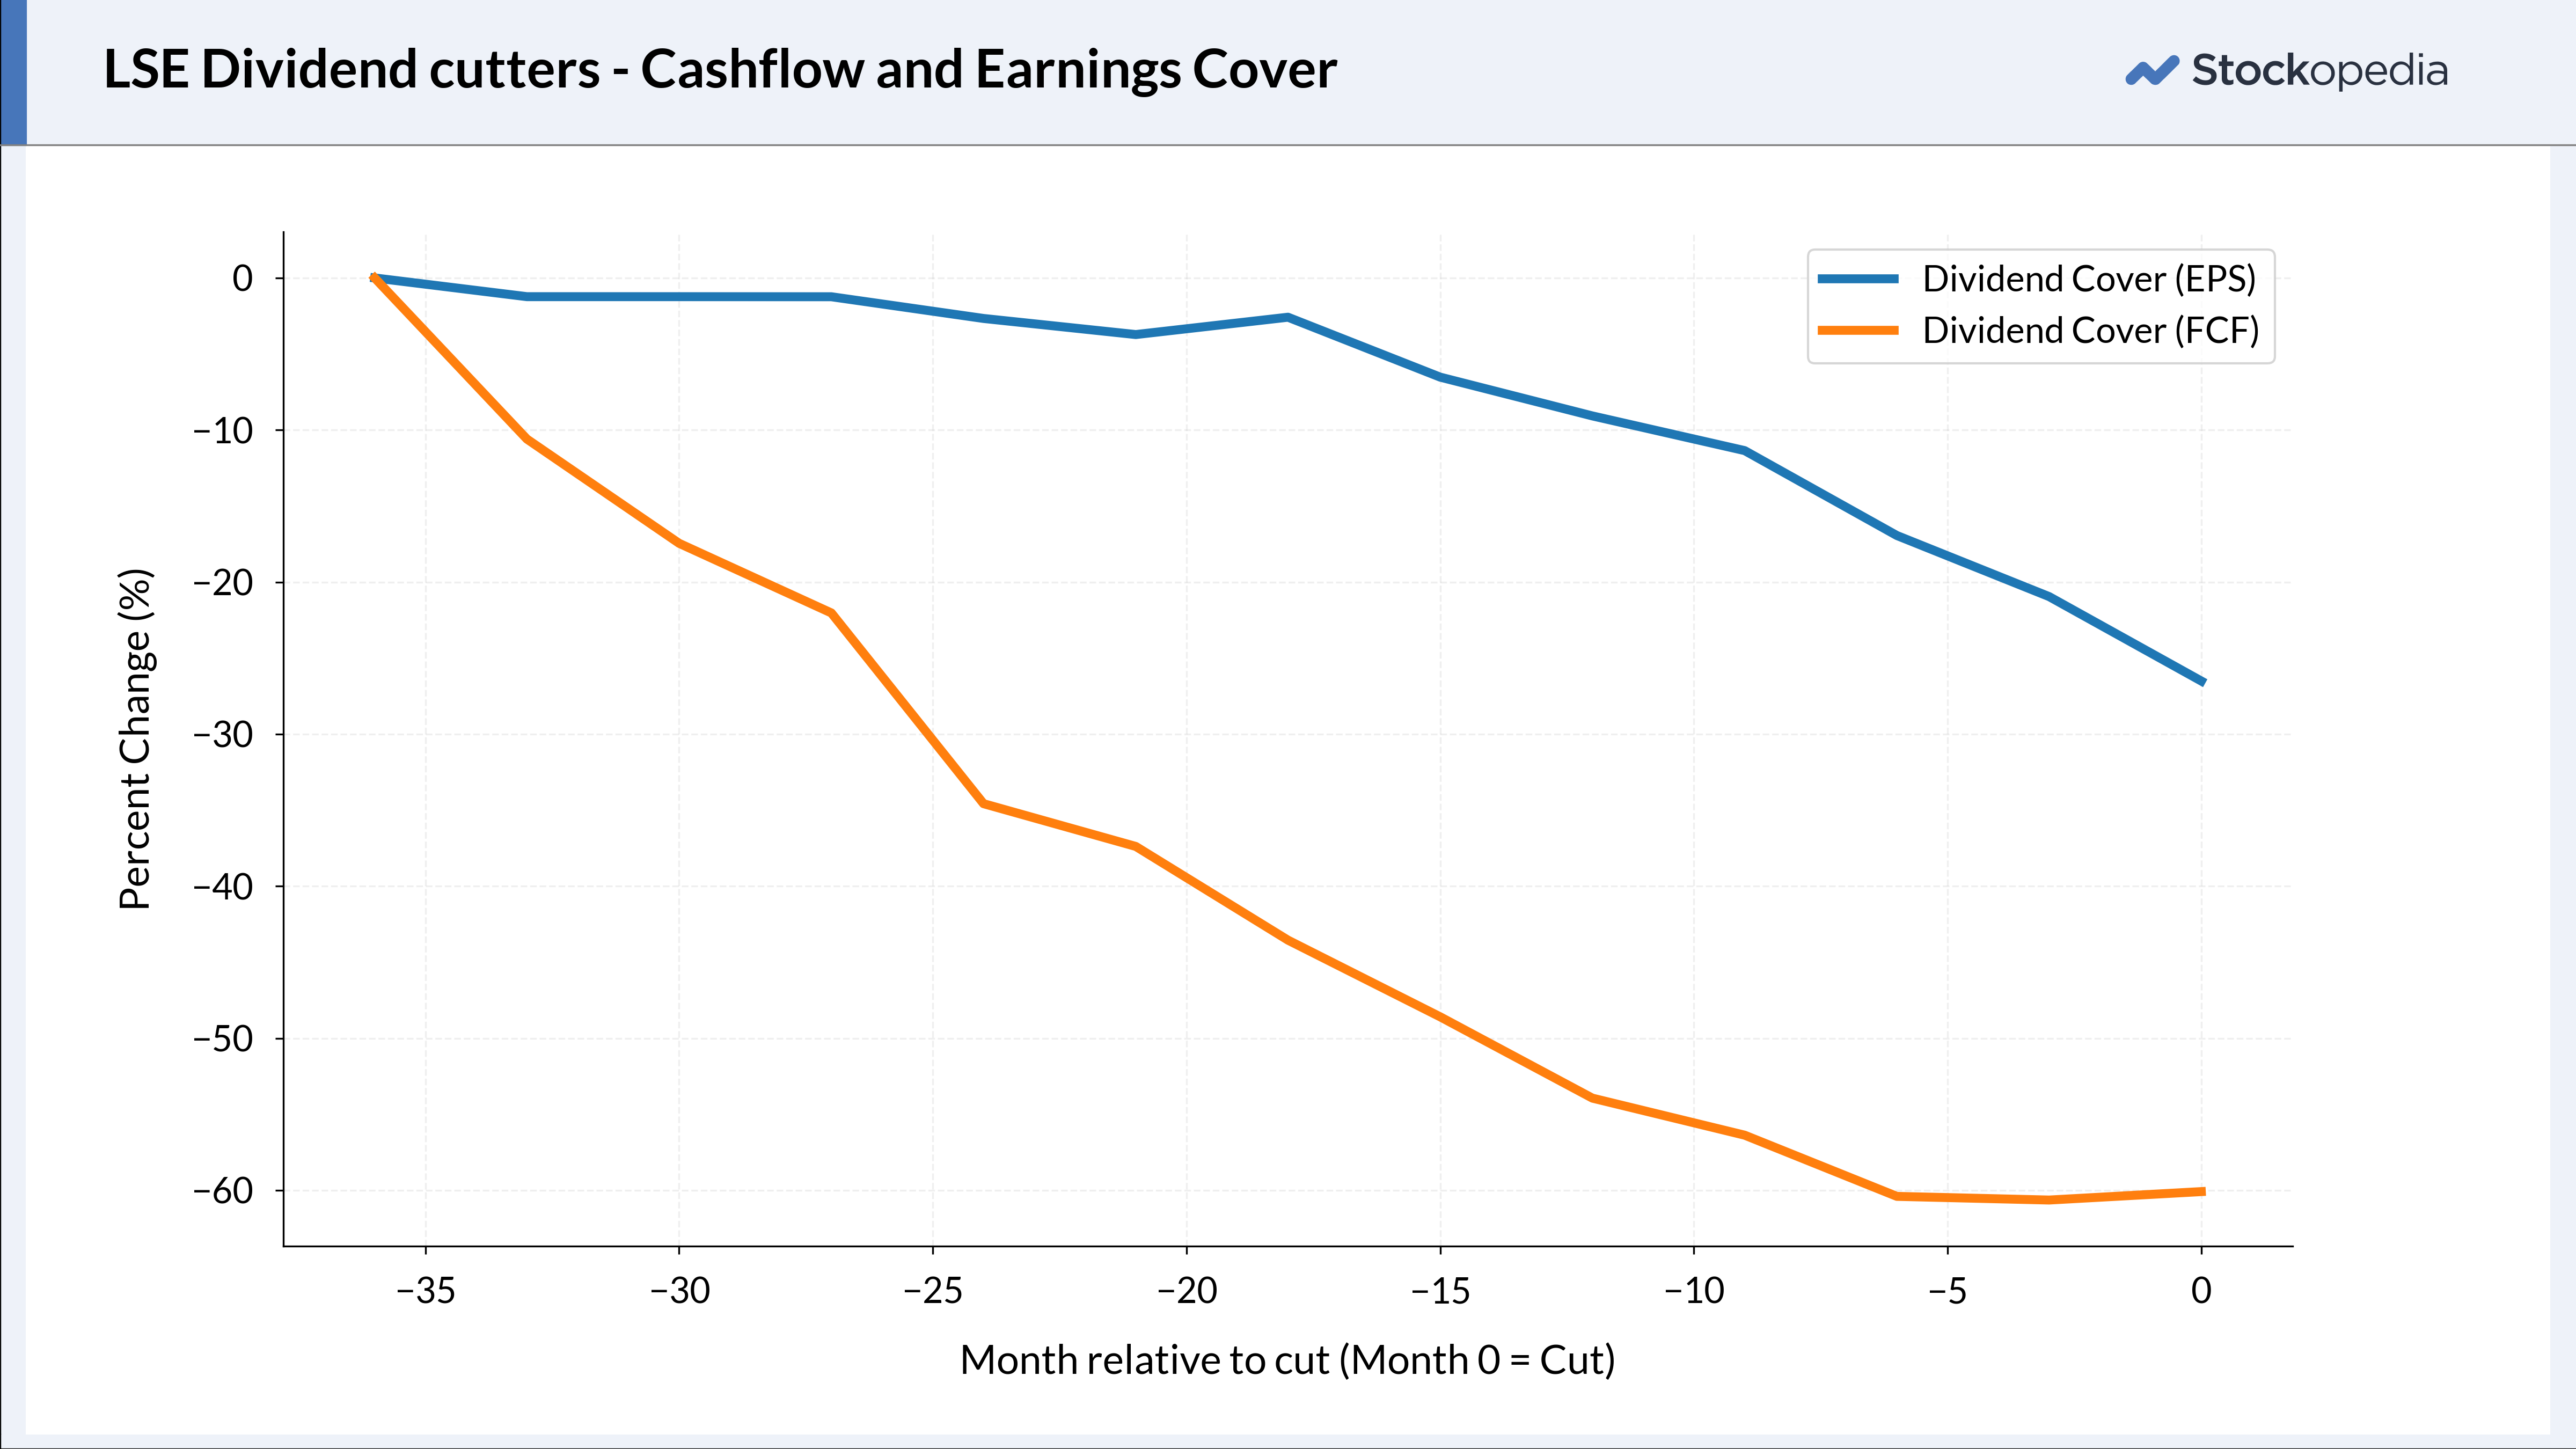
A decline in profits and earnings is a bad sign. It translates into a lower Dividend Cover ratio. This datapoint measures a company's ability to pay dividends from earnings. It is a key dividend safety metric, calculated by dividing earnings by dividends. We can also use a cash based ratio — i.e. Free cashflow divided by dividends (FCF PS/DPS).
There are some rules-of-thumb:
- A cover above 2x is considered robust.
- A dividend cover below 1.5x might signal a potential risk of a dividend cut. This is arguably arbitrary, but it emphasises the importance of maintaining a margin of safety.
Before a dividend cut, the Dividend Cover trends downwards, as dividend growth outpaces earnings growth. If companies pay dividends without the requisite cash or earnings, investors face a situation where dividends are likely propped up by borrowing, asset sales, or dwindling reserves — all inherently unsustainable.
Financial Health
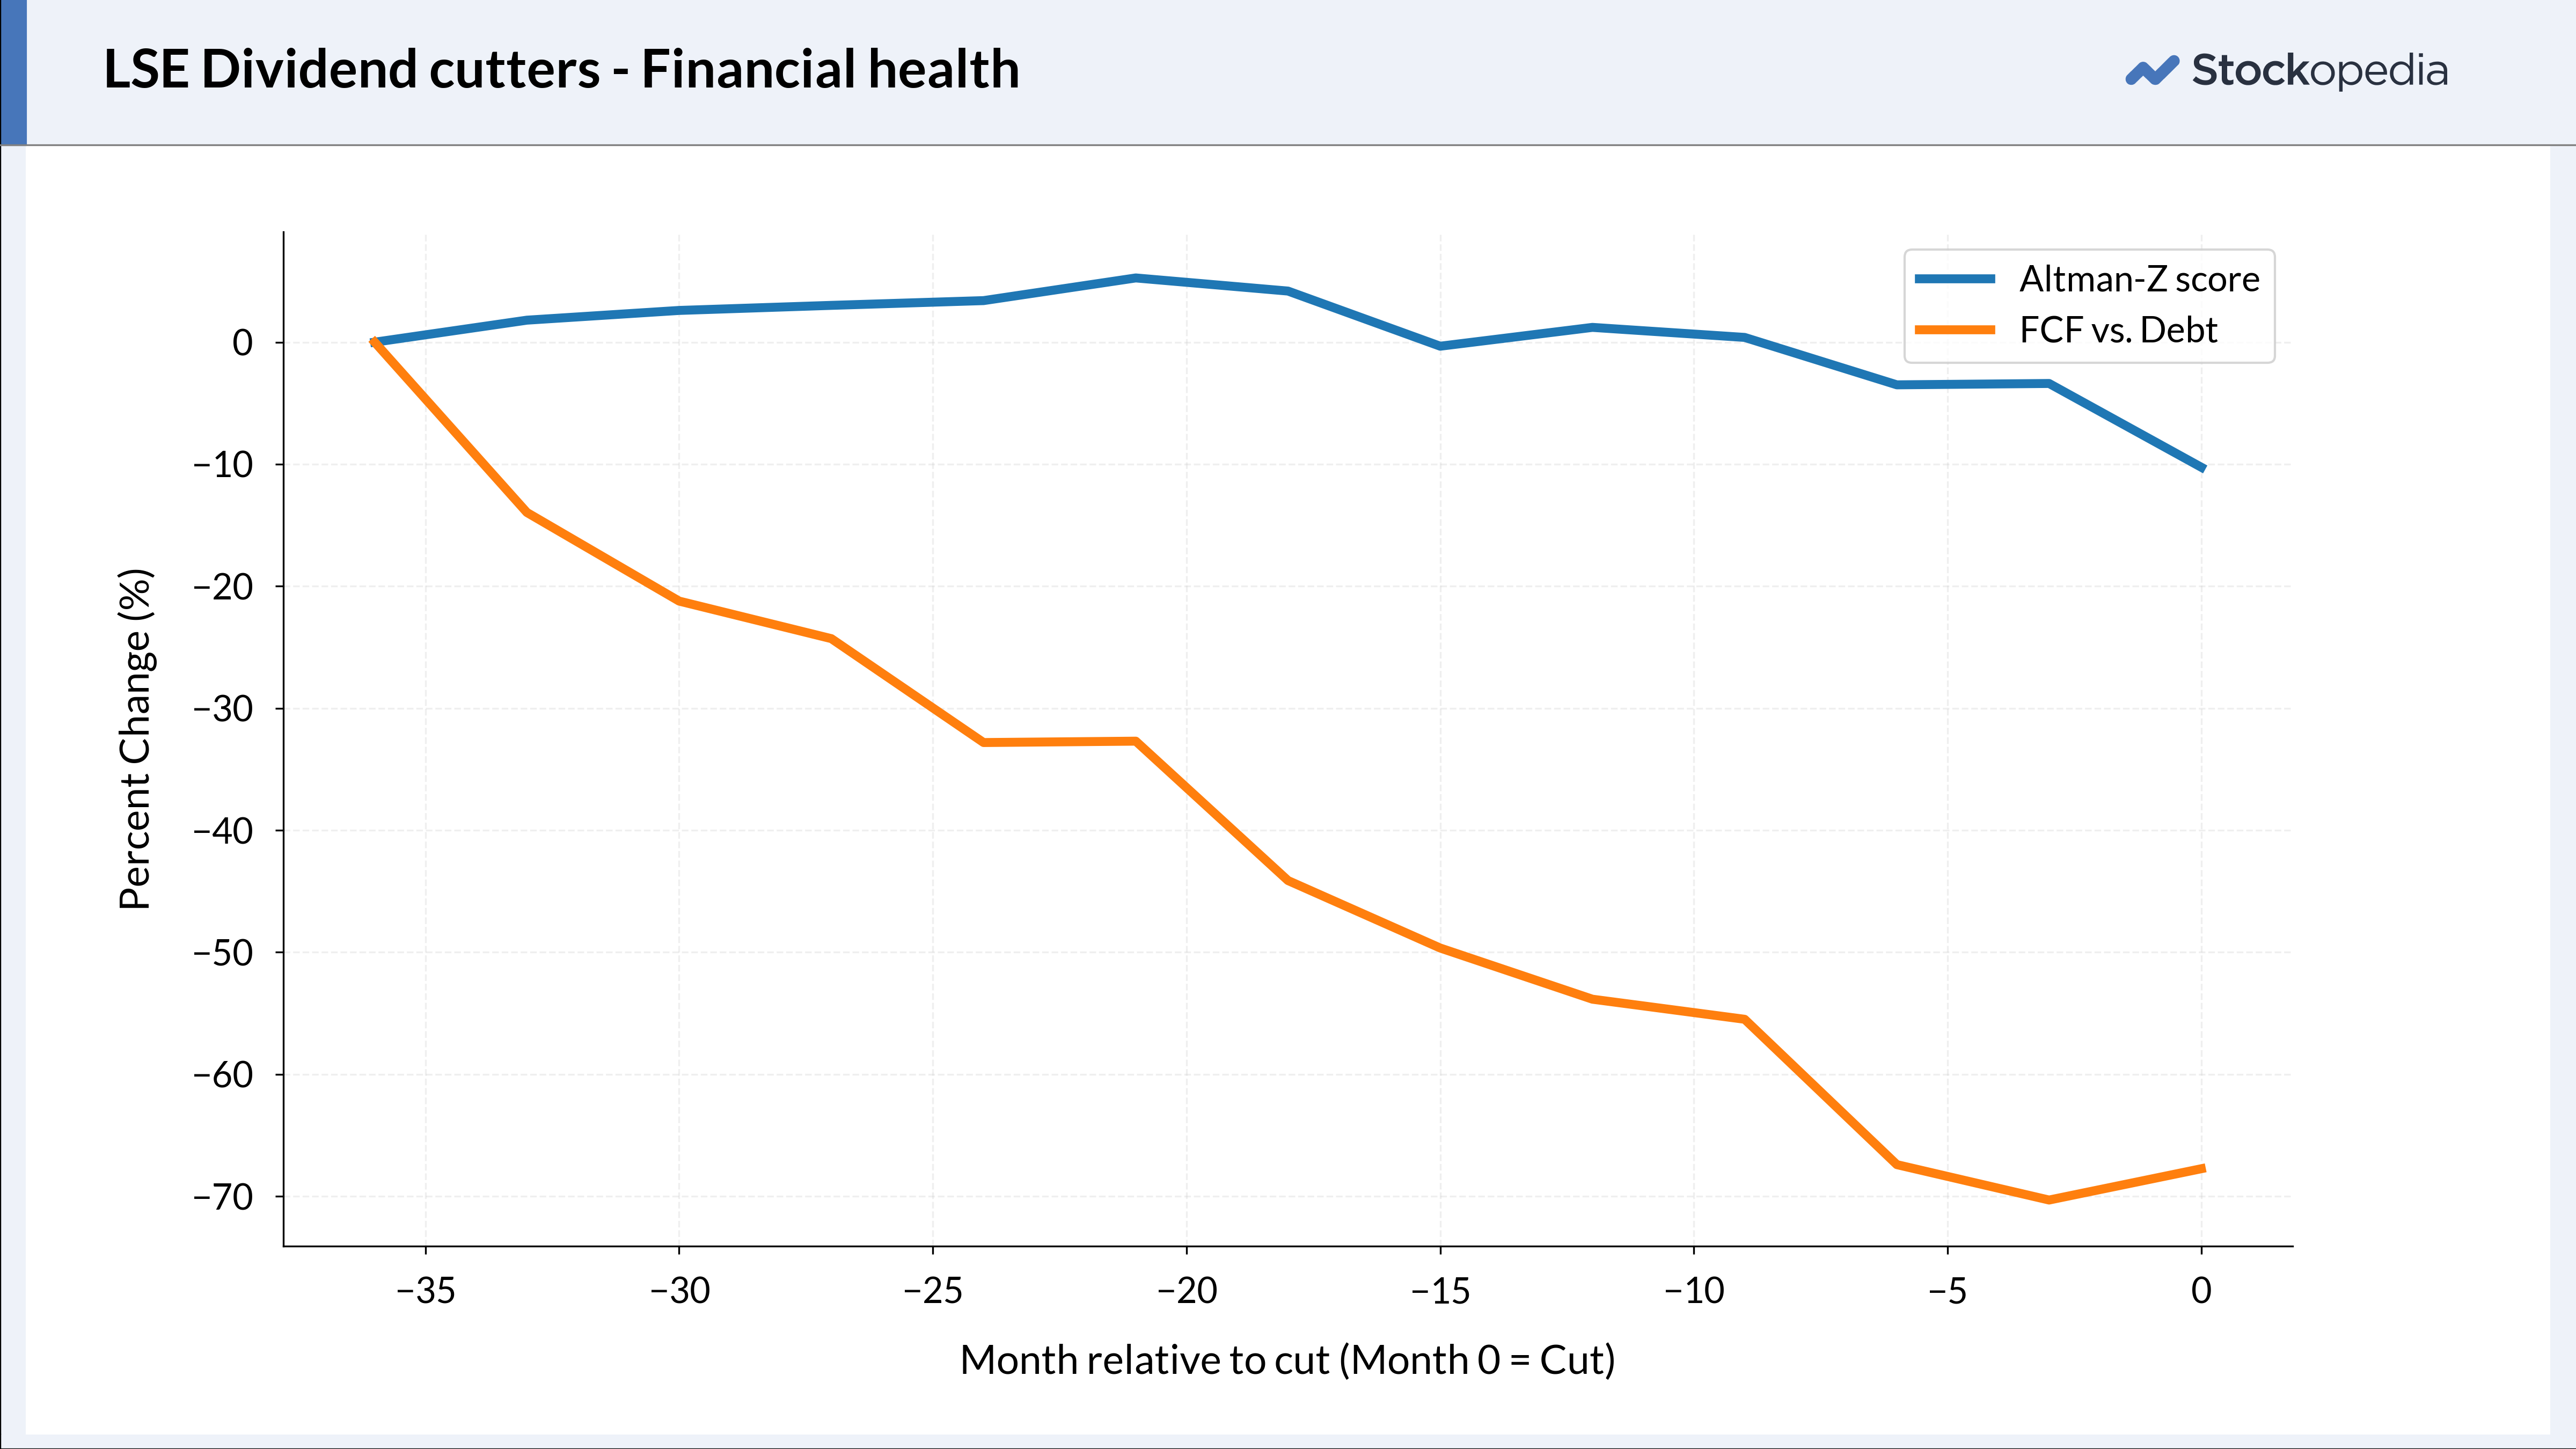
Investors hunting for dividend safety should also pay attention to financial health, with cash flow being a crucial factor. Companies need cash to meet financial obligations, including paying dividends and also servicing debt. In a company's capital structure, debt holders (creditors) are generally higher in the hierarchy than equity investors (shareholders). If companies are forced to choose between penalising investors and penalising creditors, investors may draw the short straw. Perhaps it is not surprising that dividends are cut when cash becomes tight and firms struggle to service debt.
The Altman-Z score is another useful ratio. It encompasses profitability, leverage, liquidity and solvency metrics and is essentially a ‘distant to default’ formula. We can see that the Altman-Z score declines in the run-up to a dividend cut, implying that the ‘distant to default’ becomes smaller.
Key takeaways
When building an income portfolio, investors should look for safety above all else
Last week, Mark Simpson showed that share prices plummet when companies cut their dividends. He said: ‘investors should be selling at the first sign of news that has the potential to leave a company unable to maintain its dividend’. He added: ‘When building an income portfolio, investors should look for safety above all else’. This week, we elaborated on what safety looks like. We examined the red flags around dividend danger so that investors can steer clear of risky dividend traps. The key takeaways were as follows:
- Dividend cutters often have deceptively high yields, usually above the market median;
- Dividend traps have weak price momentum, typically reflected in a low MomentumRank;
- Just before a company cuts its dividend, it usually has declining profitability, measured in profit margins and also returns on capital (ROE, ROA, ROCE);
- In the run-up to a dividend cut, a company will often have a weak Dividend Cover (measured using earnings and/or cashflow);
- The financial health of a company will be declining just before a cut, as can be seen from trends in the Altman-Z Score and the ratio of cashflow to debt.
By recognising these red flags, investors can better protect their portfolios from the financial fallout of dividend cuts. Prioritising safety and diligent analysis can help ensure a more stable and reliable income stream, even in uncertain markets.
Disclaimer
This is not financial advice. Our content is intended to be used and must be used for information and education purposes only. Please read our disclaimer and terms and conditions to understand our obligations.

22 comments
*Buffett
I use a “screen” that works very well in avoiding dividend cuts. It’s a simple “screen.” It’s simply take note of what the Companies say in their updates. And if after always giving future dividend guidance, there is sudden silence on future dividends in a Results update, that’s a warning sign for a cut. As obviously is an explicit warning they will have to cut it.
Here are examples of those comments along with figures like current dividend yield from some of the shares and Investment Trusts I hold, and some of those are long term holdings:
M&G (LON:MNG) 10% dividend. . They continue to promise stable or increasing dividends.
Phoenix group (LON:PHNX) 10% dividend.They continue to promise “progressive and sustainable “ dividend policy.
Aviva (LON:AV.) 7.8% dividend.They continue to promise mid single digits dividend increases.
Legal & General (LON:LGEN) 9.8% dividend. They were also promising mid single digit dividend increases but their latest change to just 2% increases and a buyback with the cash saved, was met with the share price fall from 250p to 220p.
Liontrust Asset Management (LON:LIO) 14.6% dividend. But note…..they promise at least 72p to March 2025, but silence on what happens after that is a dividend cut warning sign.
Premier Miton (LON:PMI) 11% dividend. BUT….they say we’re “pragmatic about future dividends.” Already there’s been a cut and clear warning there that there might be again.
Chesnara (LON:CSN) 10% dividend. They’ve increased dividends for 20 years in a row and no indication that’s about to change.
Amedeo Air Four Plus (LON:AA4) 14% dividend. They’ve promised at least to maintain it until 2016.
Aew UK Reit (LON:AEWU) . Dividend yield was 13% when I bought in 2020 at 62p. They’ve expressed determination to maintain that dividend and have succeeded. Current dividend yield is a still good 8.5%.
Gulf Keystone Petroleum (LON:GKP) 8% dividend. They paid 80p in dividends in 2022. That’s an annual 60% yield at the current buy price. It didn’t need a screen to realise at once that the dividend would be cancelled when the key pipeline was closed! Now it looks close to opening again. Already they’ve resumed paying big dividends. Yiannos also highlighted the recent strong buy opportunity when the share was just 120p ahead of the gain to mid 140s.
Ferrexpo (LON:FXPO) Another huge dividend payer. Again the war made it obvious the dividend would be cancelled.
Each to their own when investing, but isn’t what the Companies themselves say (or fail to say) about future dividends a much better guide than any screen?
Hi Alex, it would be great if Stocko could add total return performance figures. This info would be valuable!
Some interesting charts. Are these available for us to construct? If so, I need some training!
Hey, not right now, but we can monitor customer feedback here. If more people get in touch with a similar request, then this could be something we prioritise in the product.
Alex - until Stocko can chart/analyse total returns there sadly isn't much point in maintaining a portfolio in Stocko's Folios or using Stocko for anything to do with income.
Try getting an accurate perception of how any high-yielder (like Vodafone (LON:VOD) )or any company that pays frequent special divis (like Berkeley group (LON:BKG) ) have performed over the past decade or so within Stocko.
You can't.
Now...if you pop across to Sharesight.....
Yes please to total return figures
Thanks Alex, Very helpful article but it would be very helpful if within the Stocko Screener to be able to measure the trends you highlight for at least 3 periods
Are the Ithaca Energy (LON:ITH) very generous dividends dangerous? They announced another big dividend with their upbeat Results on Wednesday. It’s a $0.12 special (about 9.5p) and it goes ex that dividend this Thursday. And they promise more big dividends ahead too. See the Results comment for more on those:-
https://www.stockopedia.com/sh...
The share price is down 70% from the too high 250p IPO Nov 2022 price but now that the share is bouncing off that low, Ithaca Energy (LON:ITH) could well be a very rewarding share to hold. I already held for a small loss and averaged down on Thursday. The share finished the week strongly.
Hi Ken,
That's an interesting question.
I don't have a crystal ball, so I’ll offer my thoughts, but please don’t take this as advice.
If I were a dividend investor looking for consistent cash flow, I would not allocate all my funds to companies like LON:ITH. There are a few red flags here that make me cautious (see below).
On the other hand, if I were following something like Nassim Taleb's 'barbell strategy,' where most of my portfolio is in low-risk, conservative investments and a smaller portion in high-risk speculations, then I might see a place for a stock like LON:ITH. This approach limits the downside while still offering potential upside from a high yield.
NB - Credits for the photo go to hmmrmedia (link here).
As for LON:ITH specifically, here are some concerns:
In light of this, the 'special' (i.e. one-off) dividend could be seen as a sign of weakness, in the sense that the dividend is perhaps unsustainable. Just something to consider...
Best,
Alex
Thanks for that really interesting reply Alex. I’ll respond to it later.For now just a bit of general info about my own big dividend paying investments. I always look to buy them when they have fallen heavily either in big bear markets or as is the case with Ithaca Energy (LON:ITH), when a specific share or Trust has fallen to longer term, or multi year lows. That greatly reduces the risks of further big share price falls, as a lot of bad news is priced in, and I will have invested near the bottom if that share or Trust then recovers.
This tactic can even work with a share where a dividend cut is likely or possible. E.g Liontrust Asset Management (LON:LIO where the share has now fallen so far that it might not take a dividend cut too badly or even see it as a plus. This method works far more often than not and most of my big dividend paying investments are in profit, with the best tripling, since this became my main investment tactic. Those gains which are excluding the big dividends on top that provide regular big income….that I can use to buy more of the same from the dividend proceeds!
More another time.
Great article Alex, very useful for setting up a dividend strategy.
Have you looked at dividend growth in regard to this? Is a company which is currently growing its dividend payment less likely to cut the dividend than one where the dividend growth is flat or close to zero. In particular at the moment do we not need dividend growth to offset the fact that bond yields are rising, and that you can now get 5% yield for most lengths of bond maturity , which is a major increase on the 1-2% you could get on bonds from 2009-2022.
Hey - I'm afraid I have not looked at dividend growth in the exact way you describe, but I think the above charts do give us scope to read between the lines. In many cases, dividend cutters have yields which are high and even growing. The problem is not in the growth rate per se, but in the extent to which earnings and cashflows are able to keep up with dividend payments. A dividend cut is more likely if a chasm opens up between DPS on the one hand, and EPS/FCF PS on the other.
Thanks Alex. Great analysis supporting clear graphs.
Is there any chance you could construct a screen for risk of dividend cuts?
I was mulling over the idea of a screen for this purpose after reading the article yesterday, but I came to the conclusion that this isn't a job for a screener unless you are planning to short the results.
What would do the job pretty well is a folio containing your current holdings and wish list. Select the parameters that point to a possible looming dividend cut according to the signals described in Mr. Naamani's highly practical article, keep your own records of all changes in these values that take place, decide how much adverse movement you are going to tolerate before selling, and there you have your very own canary.
A lot is said about 'compounders' and 'multi-baggers', but in so doing we risk neglecting Warren Buffet's two golden investment rules: rule one, don't lose money; rule two, don't forget rule number one.
Hey,
Thanks for the question.
In the image below, I've outlined some rules for analysing company fundamentals and dividend safety.
The Compare rule allows you to compare one ratio against another, for example, comparing this year's Return on Equity (RoE) against last year's RoE. This is a way to identify companies where the fundamentals are trending negatively.
The Rank rule ('Rank in Market') lets you identify companies with a high "Yield Rank" (as it were), meaning their dividend yield is higher compared to their industry peers. This is particularly useful when screening for high-yield stocks that might be "dividend traps"—companies offering a high yield but with potentially unsustainable dividends.
Conversely, if you're looking for companies with more sustainable dividends, you can reverse these rules. For instance, you could compare this year's RoE to last year's and look for companies where RoE has improved.
I hope this helps.
Best,
Alex
Excellent article Alex. What is your view on Liontrust Asset Management (LON:LIO. A 15% yield, decreasing price momentum, fall in revenues, profits and margins with low dividend cover and yet has plenty of surplus cash. Do you see LIO at risk of cutting its dividend?
With FCF falling to less than the dividend and dividends estimated to be held constant , spare cash will be used up quickly. If I were CEO I’d cut the high dividend.
That is the likely outcome although the CFO bought £500k of shares yesterday.
Thank you Alex for showing how much there is to consider to stay on the ball when investing for dividends. My plan is to have my eggs in multiple baskets as an answer to the fragility of a high-yielding share. What can fog the issue is the price paid for that share, what I see may not be what I get. On the other hand a share with a middle of the road yield bought when bottom fishing may out-perform the current high-yielders. I note that a high yielder can go either way in the near future, the dividend may cut, it may be reduced by the share price rising, or the share price may fall and the yield increase correspondingly. I also hedge my bets by investing in growth companies which don't pay dividends, again, eggs and baskets.
Thank you. A good, common sense presentation highlighting obvious indices, of which we lose sight when enamored by a stock.