This week, Megan has been looking at Adventurous Growth strategies, which are stocks on the Stockopedia Style Map that are high quality and have high momentum:
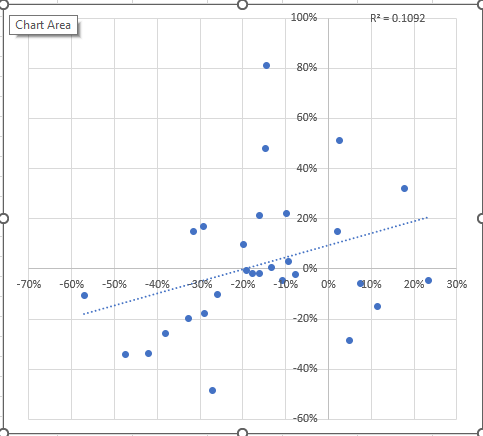
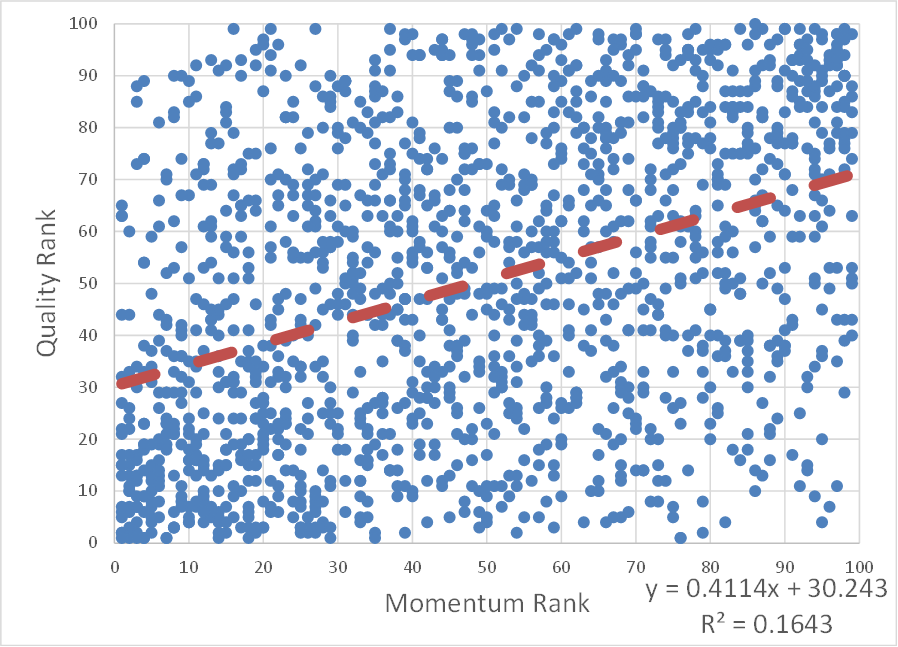
We know that the Quality and Momentum Rank are positively correlated due to the inclusion of measures of earnings momentum in both measures:
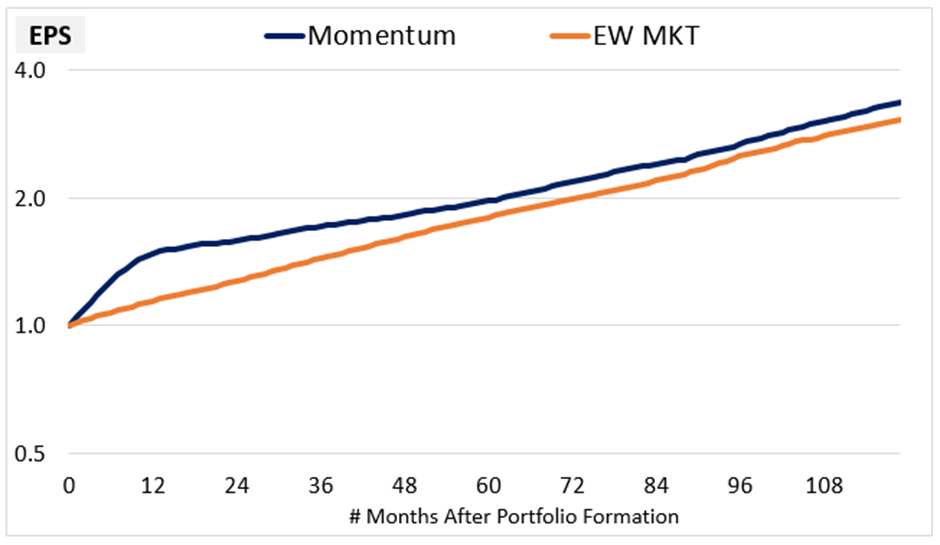
However, in many ways, they are very different strategies. Quality strategies require patience as better companies compound their re-invested capital. Whereas, Momentum is short-lived and requires regular rebalancing into recent winners, as this chart from one of my favourite studies (Factors from Scratch) shows:
So, the big question is when should an investor sell a QM stock? Should they sell quickly as momentum fades, or can they hold for the long term and minimise trading costs and other frictions? I set about trying to find the answer with some data.
Methodology
Starting with the 30 highest-ranked QM stocks at the end of each year, 2014-2021, I looked at how these stocks performed over the subsequent time periods. For example, these are the 30 highest QM-Ranked stocks on 30 December 2014:
Character (LON:CCT) Zytronic (LON:ZYT) 4imprint (LON:FOUR) Jet2 (LON:JET2) Atlantic Lithium (LON:ALL) Advanced Medical Solutions (LON:AMS) Avon Protection (LON:AVON) James Latham (LON:LTHM) Animalcare (LON:ANCR) City of London Investment (LON:CLIG) £RM Benchmark Holdings (LON:BMK) Idox (LON:IDOX) Portmeirion (LON:PMP) FD Technologies (LON:FDP) Solid State (LON:SOLI) Hill & Smith (LON:HILS) FDM (Holdings) (LON:FDM) K3 Business Technology (LON:KBT) CVS (LON:CVSG) Safestyle UK (LON:SFE) Costain (LON:COST) Gooch & Housego (LON:GHH) Mattioli Woods (LON:MTW) Liontrust Asset Management (LON:LIO) Churchill China (LON:CHH) CML Microsystems (LON:CML) YouGov (LON:YOU) Tracsis (LON:TRCS) Impellam (LON:IPEL)
Since the Stockopedia data began in 2014, I couldn’t go any further back, but it means we have one 8-yr period, two 7-yr periods, …., and eight 1-yr periods of performance to study. I then looked at the average cumulative outperformance of these sets of 30 QM stocks based on prices from Google Finance.
Results
Here is the key finding:
…