Whither the price of oil?

The price of oil (and energy in general) is significant for all investors, not just those invested in oil companies, as energy costs are a key input to the economics of many businesses. Hence the recent sharp decline in prices will have widespread economic ramifications, not just the obvious impact it has already had on the share prices of businesses linked to the sector. A key question is therefore "are we there yet?" - have we reached the bottom after the declines of the last few months and are we likely to see a rebound?
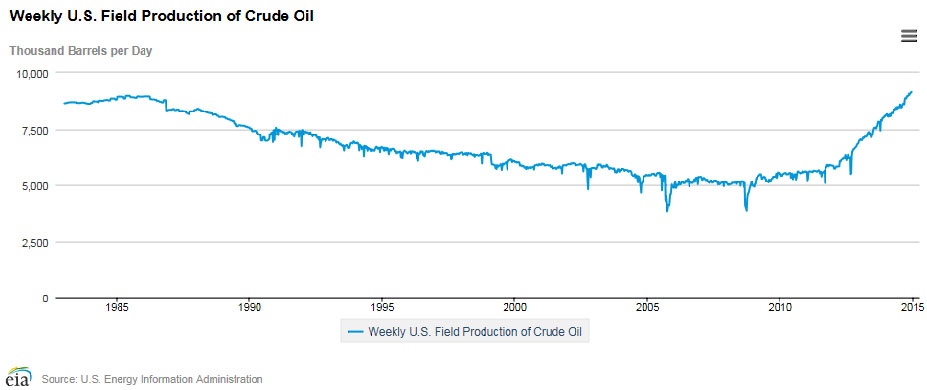
As my Twitter followers will know, I have been bearish on the oil price for some time now, since it became clear that the world was facing an oversupply. To a significant degree this oversupply has been driven by recent rapid growth in US oil production, to such an extent that it has now overtaken Saudi Arabia as the world's largest oil producer, combined with lacklustre global demand in a slowly growing world economy. The dramatic recent US production growth can be seen in this chart:
 C
Much of this production growth is driven by the application of recently refined horizontal drilling and fracking techniques to shale oil deposits. Such techniques, however, have an interesting characteristic: shale wells typically have strong initial flows, followed by a steep decline in production, typically declining by 70% within the first year. The implication of that is that whilst drilling proceeds at a rapid pace, production too will rise rapidly - but when drilling slows, production can decline equally rapidly, as the rate at which wells decline starts to exceed the amount of new production coming on stream
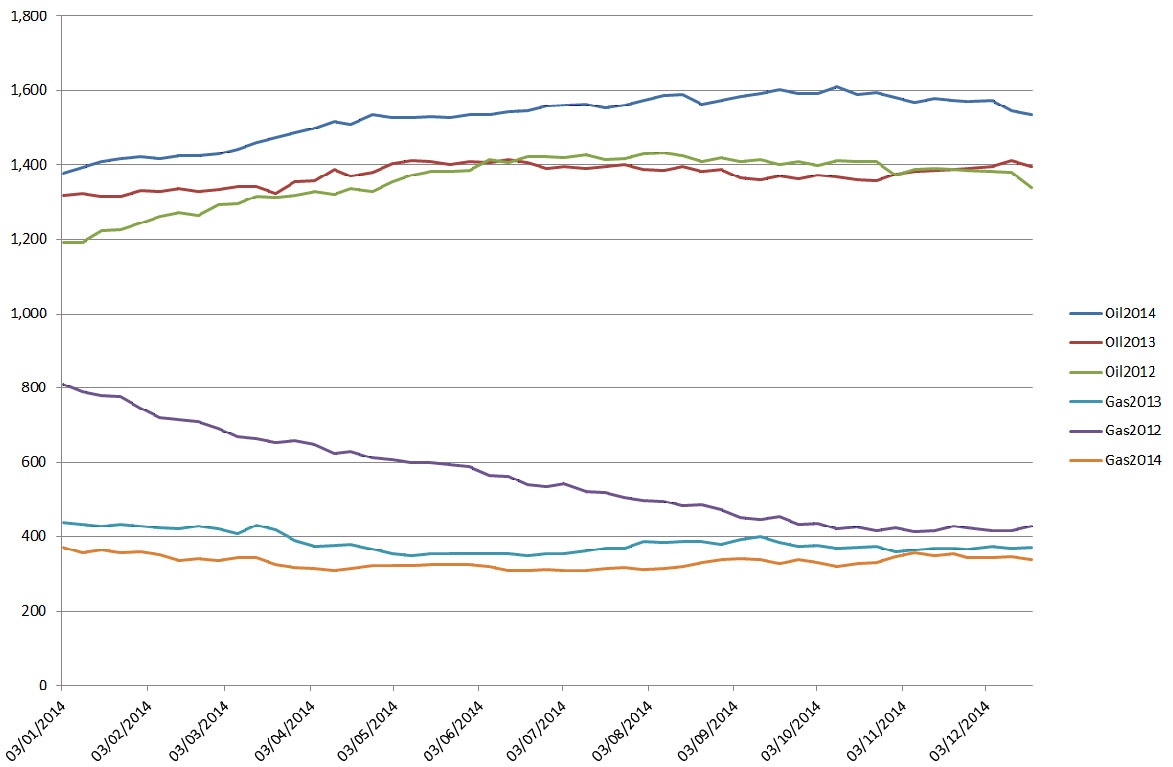
I have therefore considered the weekly rig count figures published by Baker Hughes as an important leading indicator for production, which in turn will drive prices, and have been monitoring the rig count closely. The latest figures suggest that we might finally be starting to see some slowdown in drilling activities, as more and more producers find drilling to be uneconomic at current prices. I wished, however, to get a clearer picture of whether the recent cutback was significant or merely seasonal (year on year rig counts are still substantially above prior year figures for North America as a whole, though down for Canada). I therefore plotted the data, with the following results:
Click here for a larger version of the chart
Having split the rig count figures between oil and gas, the trend becomes clearer: oil rig counts have actually been declining pretty consistently, though slowly, since the onset of the price crash in October. This decline is exacerbated by a general seasonal decline, apparent in prior years in the run up to Christmas. What is particularly instructive, however, is to examine the gas rig trend and correlate with the gas price chart:
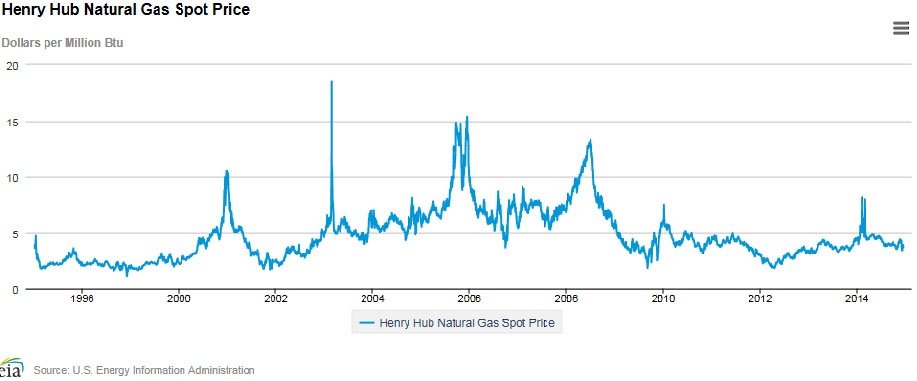
History has some important lessons to teach us! It can be seen from the price chart that, after many years when the price typically averaged around $5/mmBTU, it bottomed at $2/mmBTU in April 2012. US gas production had followed a similar path to the more recent oil production surge: the "shale gale", resulting from shale gas drilling, led to oversupply which in turn led to a price crash. We can see from the rig count chart that gas well drilling collapsed in 2012, in response to the uneconomic gas pricing. In turn, gas prices began to recover from the trough and seem to have settled around $4/mmBTU in recent times. Gas rig counts have also stabilised, at around half prior levels.
So, I draw the following conclusions from this analysis:
- Whilst we are starting to see a decline in US oil rig deployment, that decline probably has a long way to go before a stable level of production is reached. This will impact severely the revenues of oil service companies, especially those with a US focus (though this may already be reflected in sharp share price declines of those companies). In the US, that revenue diminution is likely to be long-lasting
- We may now be approaching the bottom in oil prices, though I wouldn't be surprised to see a final downward plunge before we start to see a slow but steady recovery.
I will continue to monitor rig counts closely.
Disclaimer
This is not financial advice. Our content is intended to be used and must be used for information and education purposes only. Please read our disclaimer and terms and conditions to understand our obligations.
30 comments
Baker Hughes oil rig count down 31 on the week at 703.
Art Burman suggests that on past performance the rig count fall should see US tight oil production fall 600k BOPD 'by June'.
http://www.artberman.com/tight-oil-production-will-fall-600000-barrels-per-day-by-june/
Burman is skeptical on the financial viability of much unconventional oil and gas production away from the few sweet spots. The majority of companies were cash flow negative at 90+ dollar WTI. And yet now the realised price is apparently in the 30s for Baken oil, punters are lining up to buy new 'hi yield' bond and share issues.
Whilst the RBC piece was positive on the future of US shale oil output and economics, this article is not:
http://www.peakprosperity.com/blog/90220/dangerous-economics-shale-oil
Shale economics crash porn.
Shame on has to pay to read part 2.
According to the director of the Department of Mineral Resources in North Dakota the average realised price for Baken crude has been in the thirties for months:
https://www.dmr.nd.gov/oilgas/directorscut/directorscut-2015-04-14.pdf
Be a while till those producers hedges run out, and then we will see who's figures are backed up by reality. The Saudis no doubt have a shrewd idea.
Found by Ohisay on TMF:
https://rbcnew.bluematrix.com/docs/pdf/6df7d27a-f1a7-4981-9125-9e85e634a149.pdf
An exhaustive analysis of the US shale plays.
Baker Hughes US oil rig count down 26 to 734 on 17/4/2015
The article below is forecasting there to be a rather abrupt end to the shale boom. However, with 3,000 uncompleted wells ready to be brought into use whenever prices allow, this will surely be replaced by a de facto cap mechanism on oil prices, outside of OPEC's control and whatever the Saudis decide to do?
"Temporary Relief
The relief may prove temporary as U.S. drillers are building a backlog of drilled wells that they plan to hydraulically fracture and place into service as soon as prices rebound. Analysts including Wood Mackenzie Ltd. have estimated that the inventory has grown to more than 3,000 uncompleted wells."
http://climateerinvest.blogspot.in/2015/04/the-shale-boom-ends-with-whimper.html?m=1
This would also mean, perhaps, the worst possible scenario for oil services companies supplying the shale producers, one of uncertainty, permanent pressure on pricing of oil and gas and of equipment and services, lack of long-term visibility?
Prodcution holding up well despite the incessant fall in the rig count.
These inefficient rigs beign binned first really mus be bad.
It's not just inefficient rigs, but also switching focus from combined explo./development, to concentrating on optimising production from the "sweet spots" in shale fields. Eventually all the sweet spot locations will be fully exploited, and then the declines will set in, absent more explo., but that could take years, rather than the months most analysts seem to be expecting.
Baker Hughes rig count down another 42 this week, total now 760
http://gis.bakerhughesdirect.com/Reports/StandardReport.aspx
It seems remarkable that storage is about to fill up at Cushing:
http://www.mrt.com/business/oil/article_2e6b5f54-d984-11e4-aaef-af07a6053323.html
even with BOGOF POO . Had the Saudis not acted, surely this in itself would have caused a price crash?
(The cheery source quoted in this article thinks 30USD WTI will be the bottom).
If Cushing (WTI) oil reaches 30usd, what would the well head price be for a remote Dakota field that ships by rail?
http://www.zerohedge.com/news/2015-04-07/buffett-bailout-rail-based-oil-transit-tumbles-lowest-over-year
Hi Mark
Another big decline in the rig count.
The number of US rig counts fell by 41 last week to 825, according to the latest data from oil driller Baker Hughes. This is the lowest oil rigs in use since March 2011.
Combined oil and gas rigs fell by 56 to 1,069, the lowest since October 2009.
Since hitting a peak of 1,609 in late October, the number of oil rigs is use is down about 49%.
http://uk.businessinsider.com/baker-hughes-rig-count-march-20-2015-3?r=US
I wonder if there will be much impact on production levels as higher priced hedges expire.
Not immediately, but it's concerns about expiring hedges that are driving producers to slash their drilling expenditure, which is reflected in the rig count.
Cheers Mark,
An interesting read.....
"how much storage volume is actually available at Cushing. The answer is 71 million barrels (with more storage under construction). So even if inventories there continued to build at the recent pace, it would be nearly four months before Cushing would actually be full. But, there are several mitigating factors that minimize this possibility."
"We are currently in the season when refinery utilization is lowest. Refiners take equipment offline in fall and spring to do maintenance, so they use less crude oil at this time of year. This maintenance usually peaks in March, and then crude oil demand picks back up as refiners gear up for the summer driving season. The difference in refinery demand between this time of year and summer is generally around a million barrels per day, so even if nothing else changes that storage build should start to flatten."
Have those strikes ended at the refiners - tken my eye of that. Last I saw Shell, for example, were still negotiating...
Pretty clear that with the 71m storage,and refiners set to make their return in the next couple of weeks the scaremongering about Storgae Glut is just that - a tad "over exuberant"
Appreciate the link......
What about the substantial storage glut everyone is talking about Mark?
What do you make of that- quickly digestible?
Brent comes off 6-week low to rise above $54, but glut worries drag
http://www.reuters.com/article/2015/03/17/us-markets-oil-idUSKBN0MD0AH20150317
A good refutation of the "herd" storage glut view here: http://oilprice.com/Energy/Energy-General/The-Truth-About-U.S.-Crude-Storage.html H/T to @Conkers3 on Twitter.
Here's the latest rig count chart:
Click here for an enlarged version.
I've posted again because the pace at which both the oil and gas rig counts are falling is now truly dramatic, as you can see. Counts are falling off a cliff, with oil rigs down by 42% since the start of this year, and gas rigs by 22%. There are a couple of implications I can see. Firstly for oil service companies serving the North American market, the impact & outlook must be truly dire. Secondly, it is causing me to modify my view on the mid-term oil price outlook, as follows.
Whilst efficiency gains can improve output per well, it strikes me that the rate at which such gains can be obtained is unlikely to be able to keep pace with such a dramatic drop in drilling. Therefore, I foresee production growth stalling and perhaps reversing sooner than I had previously expected. Once the market sees that, we might start to see a reversal in the current price declines. I don't expect a terribly big bounce, because traders know that if the price rebounds too much, it won't take long for drilling to resume. Nevertheless, a sustained bounce of some sort within the next few months looks increasingly likely to me. I still doubt we'll see an average WTI price above $55 for 2015, nor much above $60 for 2016, which is below most current analyst forecasts I've seen.
Cheers,
Mark
An interesting article here: http://www.ft.com/cms/s/0/1977c546-c639-11e4-add0-...
Whilst I knew that the broadening contango had led to traders stockpiling oil on VLCCs, I was not aware that they had recently been selling that stockpiled oil, following price gains over the last few weeks and a narrowing of the contango.
Suggests to me that this trading will act as a natural damper on price movements: when the short-term price falls too low and the contango widens, the price fall will be damped by traders buying oil for storage and later delivery, and acting as support. Should that reverse, those stockpiles get released, which will act as resistance to rises in the short-term price.
Mark
Mark,
John Mauldin's latest Outside the Box has the interesting point that merely counting rig numbers "is of limited use":
"Unfortunately, these efforts have yet to actually cut production; year-over-year production is still up. Companies have idled rigs for 12 consecutive weeks, bringing the rig count to its lowest level in five years, but they will need to do much more to stop the growth in production. The same improving technology that gave rise to the fracking boom and the ability to exploit the most promising acreage has rendered the rig count of limited use as an indicator of future production." (my Bold)
http://www.mauldineconomics.com/outsidethebox/the-kingdom-of-denmark ,about 2 thirds the way through. Michael Lewitt's views on the massive build-up of debt, the main thrust of the article, are very interesting too.
It seems that my views have support from high places, namely Rex Tillerson, Exxon's CEO: http://www.ft.com/cms/s/0/20fda1f8-c285-11e4-bd9f-...
"...The fall of about 50 per cent in oil prices since last summer has led to expectations that US production, which has grown rapidly in recent years, will soon level off and perhaps go into decline if prices do not rebound quickly.
However, Mr Tillerson said the precedent of the shale gas industry, where production has continued to grow even as prices slumped and the number of rigs drilling wells dropped sharply, suggested that US oil output would be more robust than assumed.
The same companies that had cut costs and increased productivity in shale gas were often involved in shale or “tight" oil as well, he added, meaning that the industry would not be crushed by low prices and competition from other regions. “I think you're going to see some of the same resilience on the tight oil side, too. And therefore it will compete globally," he said..."
Has he been reading this blog? :0)
Some more support here: http://washpost.bloomberg.com/Story?docId=1376-NKA...
Time for an update since my original post in December. Things seem to be playing out pretty much as I had expected then, so far. Here's the latest rig count chart:
Click here for an enlarged version.
We can see that in 2015 the oil rig count has plunged dramatically, as I expected. Natural gas prices have weakened further and currently stand below $3/mmbtu. Despite the continuing slow decline in the gas rig count, production has held up (see http://www.eia.gov/naturalgas/weekly/#tabs-supply-... ) and remains 13% above the year-ago figure, implying increasing productivity per rig. This bodes ill for US focussed drilling service companies.
Oil prices do seem to have stabilised and rebounded somewhat. There is some very interesting evidence on the likely future trajectory of drilling and prices in Nighthawk Energy (LON:HAWK) 's news release today. I do not currently hold Nighthawk, as I feel that its current share price does not fully reflect the impact on future earnings of the oil price trajectory I expect, despite its successes. In a recent presentation, Nighthawk claims to be one of the lowest all-in cost producers in the US. Nevertheless, today's release shows that the company has decided to suspend drilling operations in the first half of 2015, pending a recovery in the oil price. It will focus instead on lower cost recompletion activities, to maintain current production.
If Nighthawk's action can be taken as a microcosm of the US oil industry, this has the following implications, in my eyes:
This suggests that the US really has taken over the role of "swing producer" from Saudi Arabia and will put a cap on prices, as oil traders will know that demand can be met, quite rapidly, if prices are sufficiently high.
It may be a long time (years) until prices pass $80/bbl again.
Cheers,
Mark
This suggests that the US really has taken over the role of "swing producer" from Saudi Arabia and will put a cap on prices, as oil traders will know that demand can be met, quite rapidly, if prices are sufficiently high.
It may be a long time (years) until prices pass $80/bbl again.
This is exactly my analysis, the provisor being that oil prices are driven by sentiment and geo political instability plays a significant part, so I would expect spikes beyond 80 but for them to be pretty short lived as there is plenty of capacity that can be bought on line at $70-80 to satisfy demand. We keep hearing about poor demand, if europe starts recovering this will make a significant difference both in their demand, and the demand they create for manufacturing and transportation elsewhere.
This is a fantastic situation for the US, and the world economy, if not the world of oil investors, effectively enough supply at a reasonable price and protection from oil shocks for a generation.
K
There is a strong contango in the futures! Anyone got a tanker to lend fora year?
http://mazamascience.com/Market/Futures/
The large specs have been wrong footed since august
Oil will probably recover when the large specs have finished taking their losses and new specs are going long again; it looks as though we might be close? However there are still alot of long contarcts still out there.
http://www.cotbase.com/
Some comments on the comments...
Firstly, schober thanks for that chart, which suggests that rig count is a lagging rather than a leading indicator! Balancing the fact that oil supplies seem likely to rise for some months ahead, putting downward pressure on the physical spot market is the fact that the futures market is forward looking and will anticipate future supply reductions. That is why it is hard to have much confidence in the direction of short-term price outlook, as it's hard to judge the impact of reality on expectations, and why I would not be surprised to see a further fall in the near term.
However, if the rig count is a lagging indicator, the fact that it is clearly starting to turn down supports my theory that the price-bottom is close. Unless the rig count drops off very suddenly now, supplies will continue to rise for some months to come, before finally decelerating and starting to fall. The key issue near term, IMO is whether the pace at which the rig count slows is as fast as the market is expecting, or not, hence worth keeping a close eye on it.
Concerning the price transmission mechanism, the parallels between oil & gas are actually quite strong. The US has banned the export of crude since the 1970s oil crisis: http://www.ibtimes.com/why-us-bans-crude-oil-expor... (quite amusing that that article from March states that the US may overtake Saudi in 2015, when it actually happened a few short months later!), so very similar issues apply to the US local oil market to those applying to gas. The chief price transmission mechanism is that the US is the world's largest oil consumer, as well as largest producer (and is still a small net importer), so the reduction in draw on the global market from substitution by local US supplies reduces demand on other suppliers, putting downward pressure on global prices.
Underlying this, are the economics of oil production. This chart is rather useful:
We can see from this that only a small proportion of prospective future production, globally, is economic with Brent below $70/bbl (including much US shale production). There is therefore every reason to expect the fall in rig count to accelerate as more uneconomic projects & drilling gets canned.
Another clue is in the contango in future oil prices. June 2015 WTI is currently trading at a premium of just $1.36 to February WTI, but December 2015 is at a premium of $3.59. It appears that the market isn't expecting much tightness in supplies until the second half of next year, which seems logical at present, given the lag between a slowdown in drilling (which has barely started) and any reduction in output.
Nice post mark.
I think we also need to consider other high cost producers such as Canadian sands, north sea and deep water.
Market price of oil will be the ultimate arbiter and signs to me that a bottom is being attempted. Hard to imagine you'd go badly wrong buying either oil futures or current cash rich producers such as soco.
On the comparison between natural gas and oil: it's changing but in the past few years the US natural gas sector has largely been a closed market: there are/were legal (a ban on exports) and technical (no pipes/ boats/ liquefaction kit) impediments to NG exports, hence supply side events having a greater impact domestically than for oil, which can be imported/exported more easily. This can be seen in prices: US oil prices are similar to international prices, give or take things like the WTI/Brent spread, while natural gas prices diverged drastically between the US and rest-of-world prices. The point here is that past events in the US natural gas market may have somewhat limited predictive value when applied to oil.
a graph from 1995 onwards
http://fm.cnbc.com/applications/cnbc.com/resources/files/2014/12/19/us-oil-rigs.png
http://www.cnbc.com/id/102284420
looks like rig count need s to fall much more before oil rises again
Marben, so the 2014 rig count still exceeds that of 2012 and 2013, during which oil production steadily rose, implying there's sufficient drilling to continue the production rise . No imminent rise in oil price in view IMHO.
Phew, have finally managed to complete the article, using the Chrome browser - there seem to be problems with the editor in I.E. Please let me know if you still cannot view it properly, or have problems with any of the links.
.
Good job that I saved the text elsewhere, as half of it has now gone missing - will reinsert and advise when editing is complete.
Unfortunately it is proving a total nightmare to edit the article.
Interesting article, Mark. Unfortunately the right hand sides of your figures is truncated on my system - Chrome - so all I see is a steady fall in US production to 2005 or so!
Nor can I get enlarged figures by clicking.
Regards
Peter
Trouble with Stockopedia's editor, which mangled my OP somewhat... am fixing now, wait one...
Note that it also chopped off some key text, which I have now reinserted.