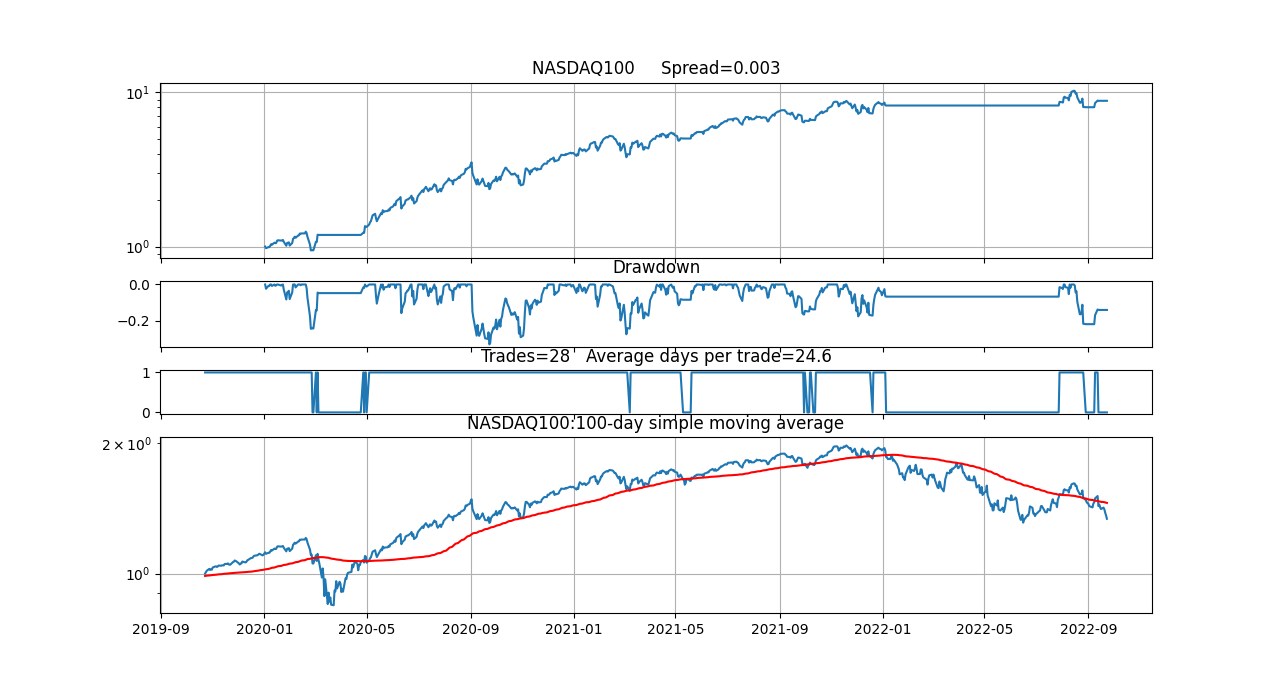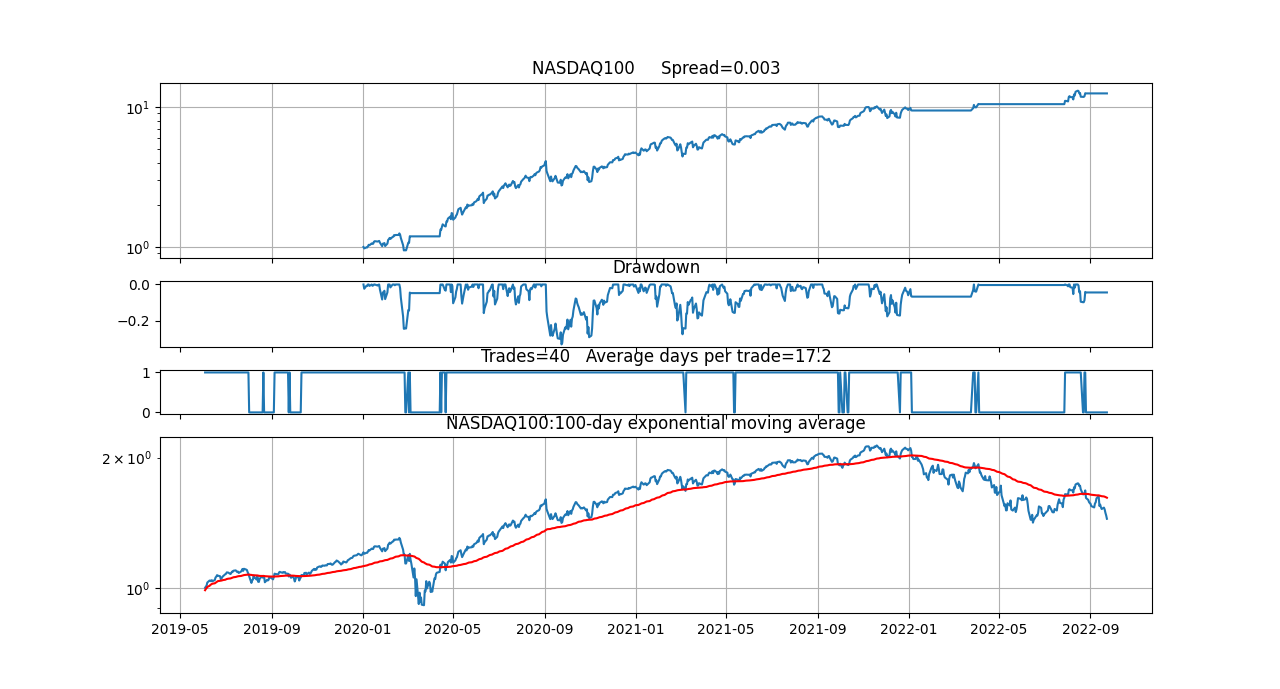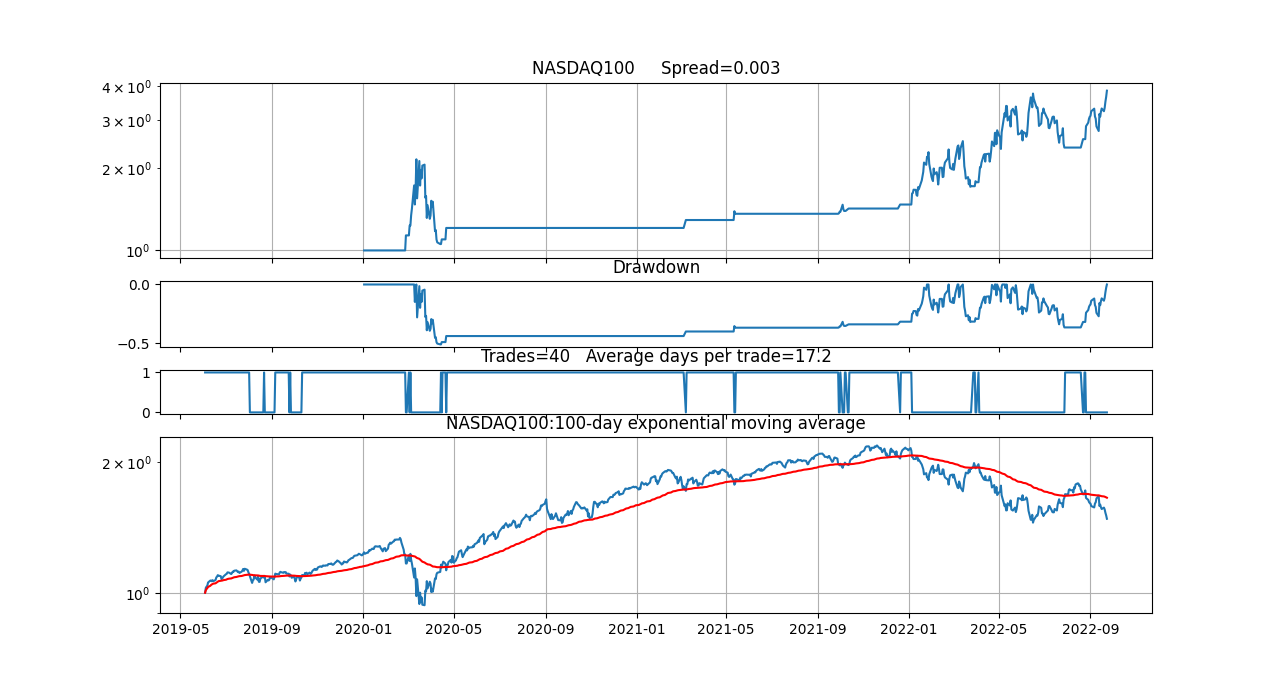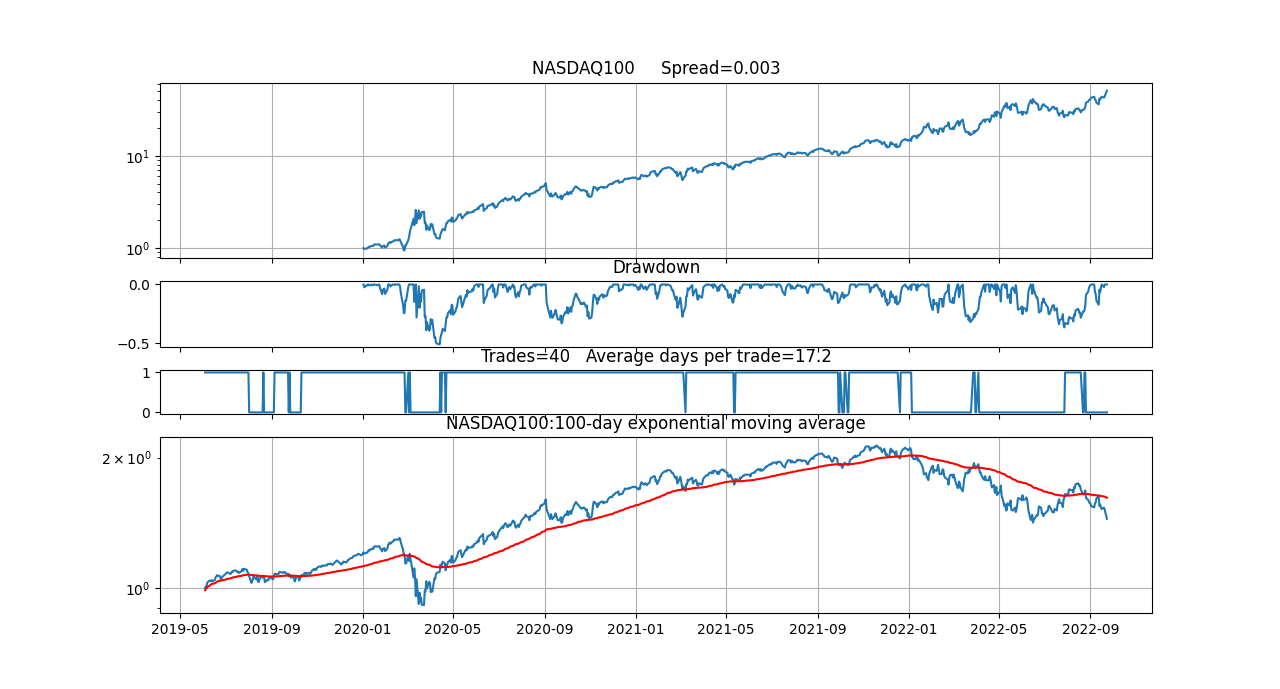
Today a buy signal was generated for 3xleveraged NASDAQ100, as you will notice on the far right of the bottom chart - the NASDAQ100 has just crossed the 100-day EMA upward. The strategy until now had been short. You will also notice that, in spite of being short, the strategy has taken credit for the upswing - clearly seen in the far right of the top two graphs. There is obviously an error here and that error pervades the whole discussion of this post - until now. Once corrected the picture is not so rosy:
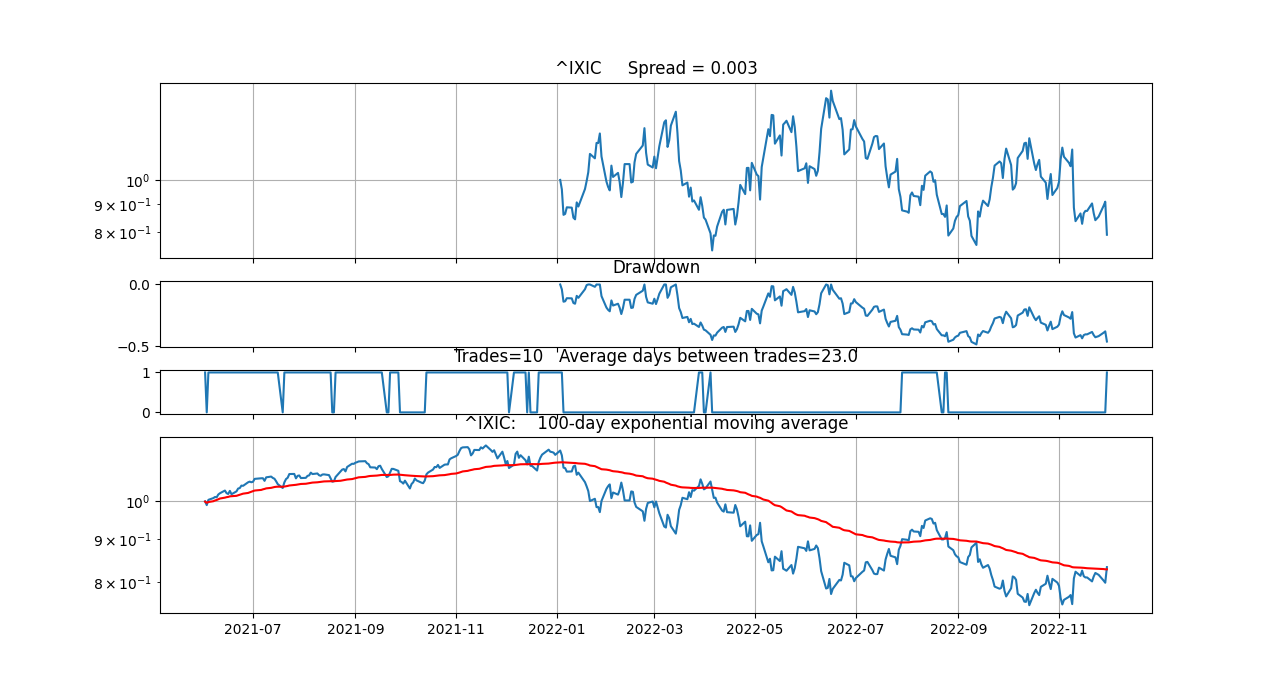
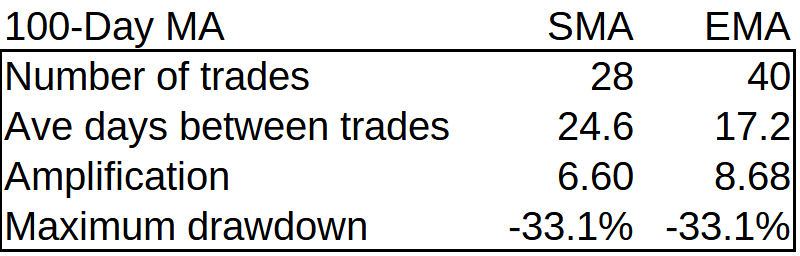
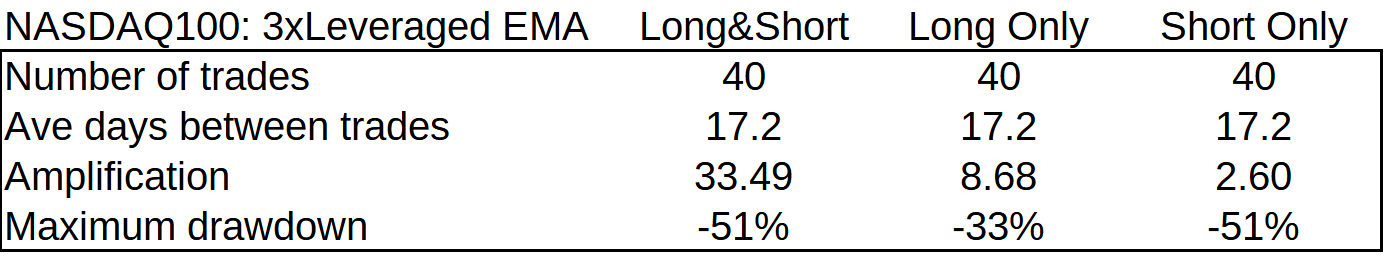
Clearly, such a simple strategy based on an EMA crossing does not work. I am always suspicious of my own results and the advice has always been to do your own research (DYOR). In spite of the algorithm being relatively simple and transferable to a spreadsheet for further critical analysis, no-one seems to have spotted the error. I am sorry to disappoint my followers. It just shows how difficult it can be to get things right - vigilance is always needed to try to spot errors. Nevertheless, the discussion has led to many positive insights.
Bitbug 01/12/2022
The original article follows:
____________________________________________________________________________________________
Obviously, leveraged ETFs are risky investments but I cannot understand why retail investors are discouraged from using them. For instance, Tom Bailey in an Interactive Investor article of 10 August 2020 titled: "The risks of holding leveraged ETFs for more than one day" states in his final paragraph:
Whether investors want to run the risk is their own choice to make. But the important thing to keep in mind is that these products are not to be used as a long-term investment instrument and are suitable only for day traders trying to predict the daily movement of the market.
I can only assume that the 'long-term' investors referred to are the 'buy and hold' type. I decided to look at the Wisdomtree NASDAQ 100 3X Daily Leveraged (USD) (QQQ3) ETF to see how an investment, though not 'buy and hold' but traded on the basis of the NASDAQ100 being above its 200-day moving average, would fare. The results, depicted below, are astonishing as one might expect.
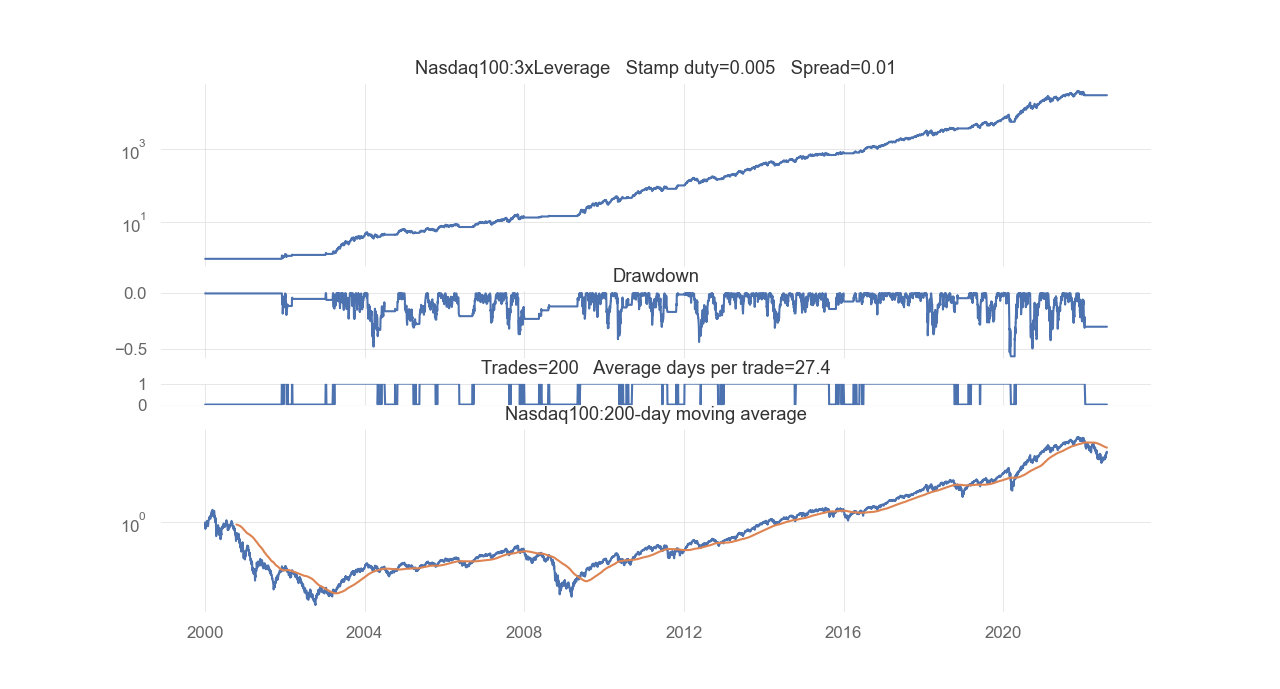
The test period, using normalized data, starts at year 2000 at the height of the 'dot com'…