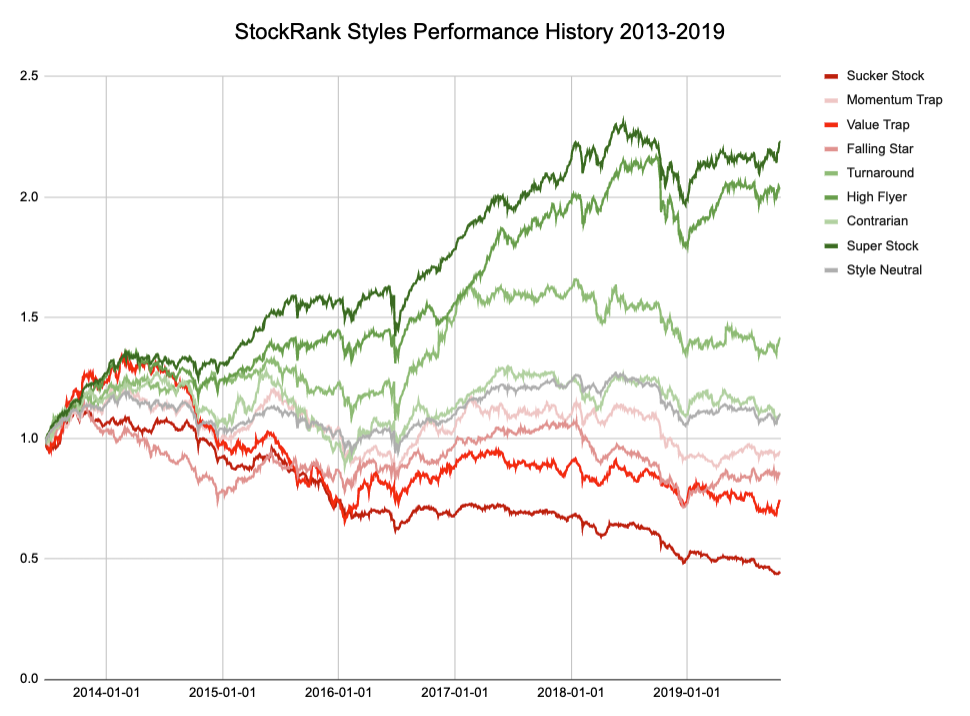
Just been looking at different styles on Stockopedia. The four winning styles are Super Stocks, High Fliers, Contrarian and Turnaround. The four losing styles are Sucker Stocks, Momentum Traps, Value Traps and Falling Stars.
OK fair enough but when I look at the performance since inception I read:
Super Stocks: +279.57%
Style Neutral: +231.32%
High Fliers: +184.45%
Momentum Traps: +164.52%
Turnarounds: 99.84%
Value Traps: 93.79%
Contrarian: +34.46%
Falling Stars: +0.53%
Sucker Stocks: -16.62%
So is the guidance correct? The surprise for me is Style Neutral, I knew Momentum Traps have performed quite well.
I'm confused how Style Neutral has performed so well.
I believe the results are from the top 25 stocks in each style, I don't know how often these are adjusted, is it quarterly?
Maybe Stockopedia has some more data to substantiate this guidance? But as it stands it looks like Super Stocks, Style Neutral, High Fliers and Momentum Traps are winning styles and Contrarian, Falling Stars and Sucker Stocks are losing styles with Turnarounds and Value Traps in between.
Another thing I noticed is under say High Fliers it says the style is Neutral, which I don't understand, surely they should be High Fliers.