I thought it time to revisit this, approx three months on.
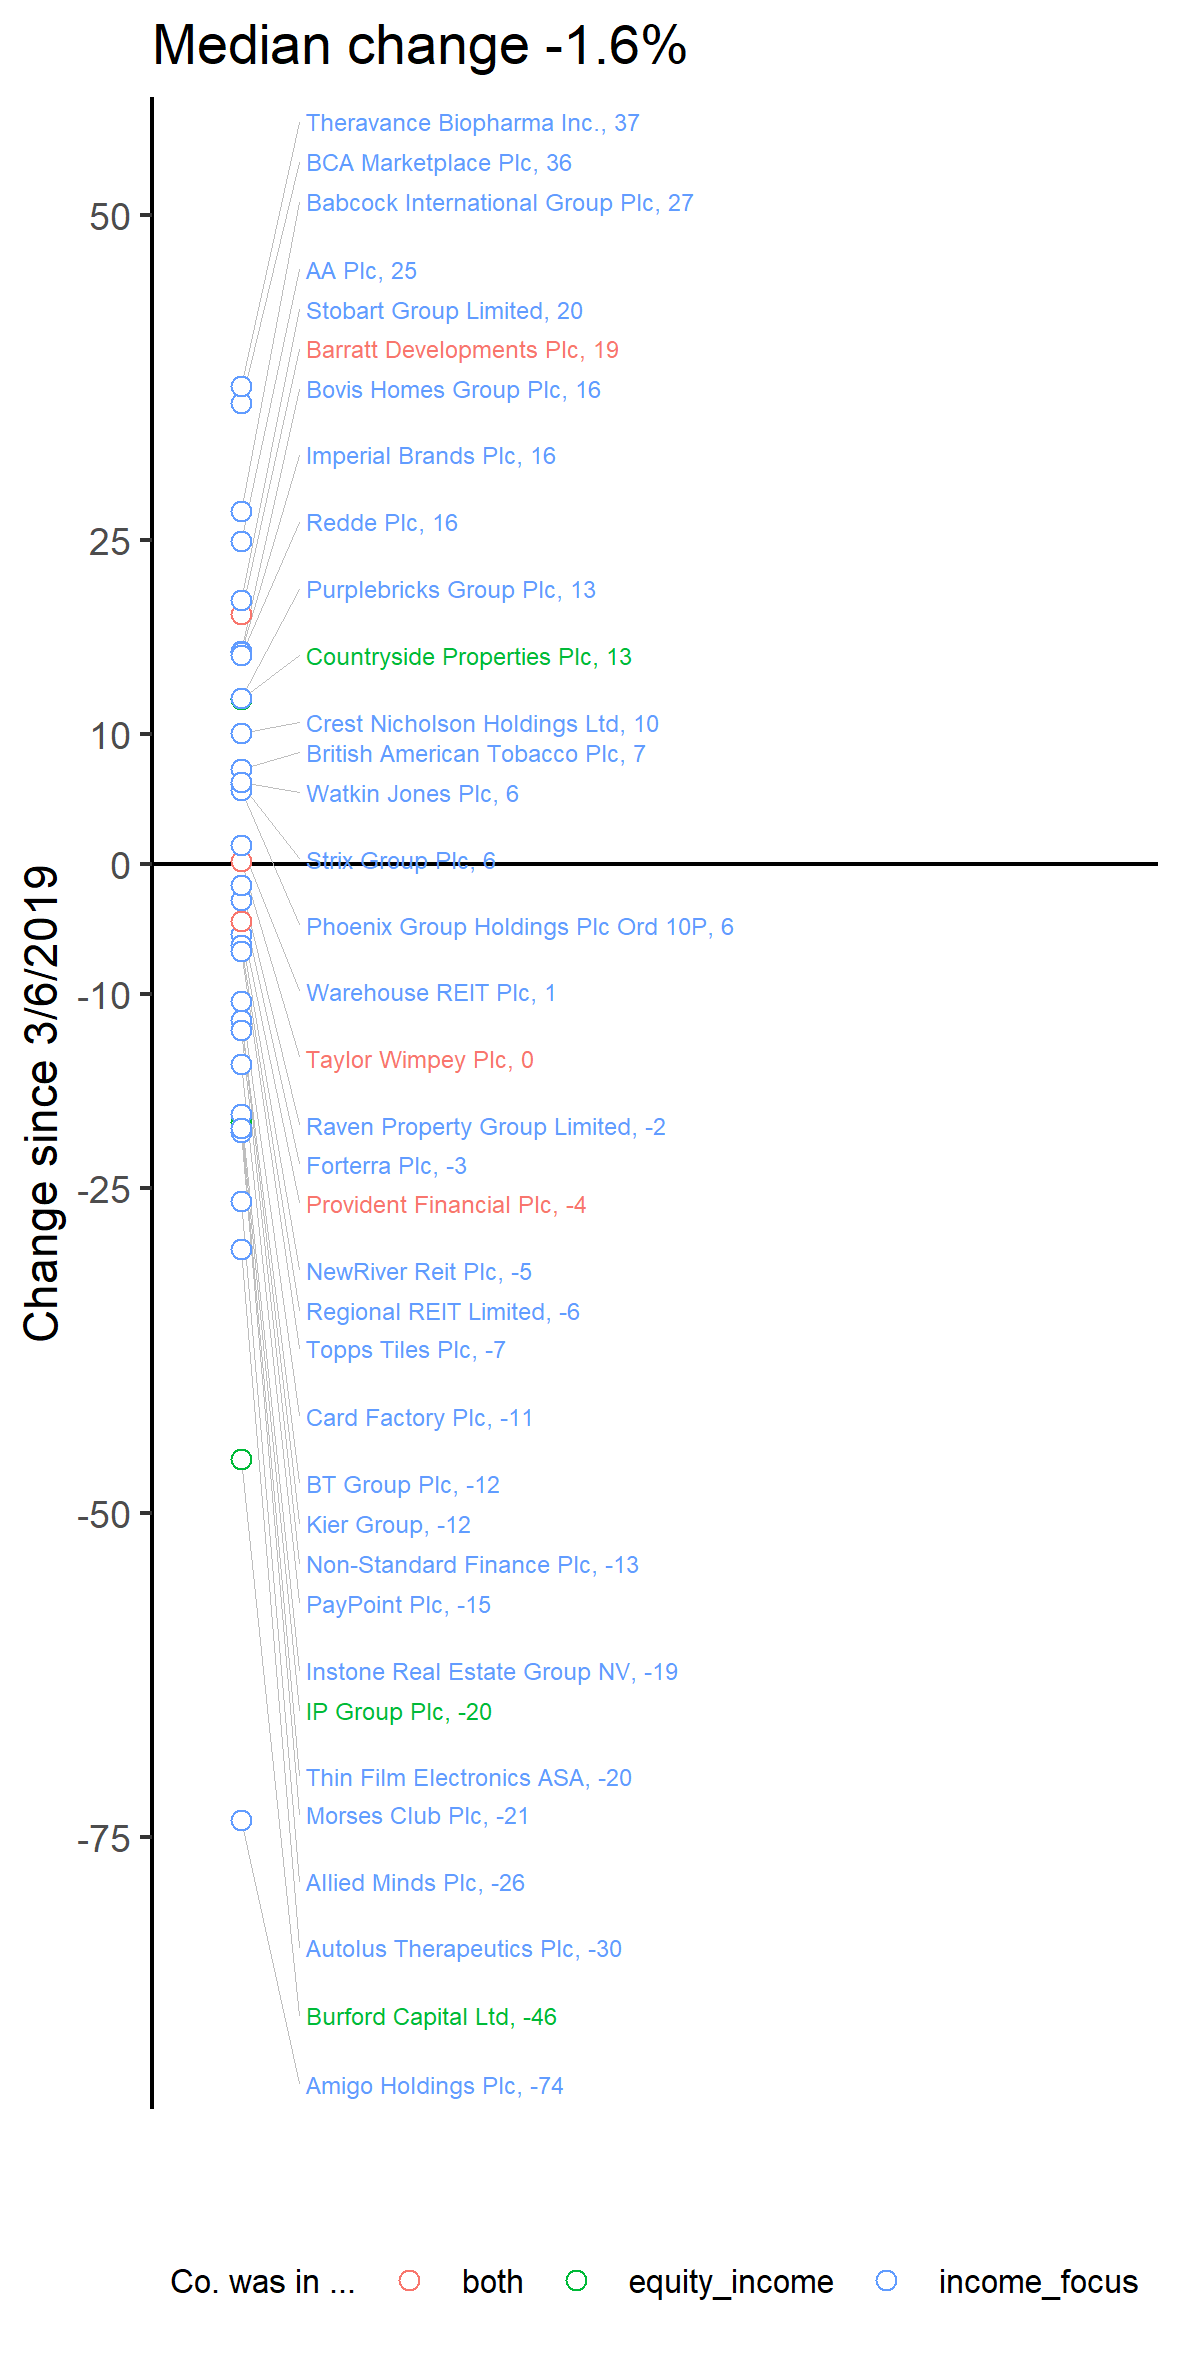
The chart below summarises the net change in price, since the suspension of Equity Income, for those companies that I have easy access to their price data (mainly Income Focus). The labels contain the percentage change, however, spacing means that you should follow the faint lines to the corresponding dot to 'see' the relative changes.
I'm surprised that the median change is only -1.6% after three months.
It has been reported that redemptions won't be allowed at least until December so I'll try to remember to repeat this near the end of November.
I thought it would be interesting to look at the Woodford holdings and their share price direction, possibly revisiting this later, so this is really a stake in the ground which I'll revisit if my interest is sustained. Will buying opportunities show up? I guess the answer to that is yes, eventually!
Information beyond the top 10 in each fund is tricky to get now and this only covers Equity Income and Income Focus. This also only covers UK listed companies where I've managed to get the historical price information.
The first chart for each company is Weekly Heiken Ashi candles. Heiken Ashi smoothes the price points and is thought by some to give a clearer indication of prevailing trends. The purple line is when the Equity Income was suspended. The blue and orange dots are just a visual cue as to peaks and troughs and aren't significant. Originally these were accompanied by log based point and figure charts for additional time/space but width is the limit here, so I left these out as most are unfamiliar with them.
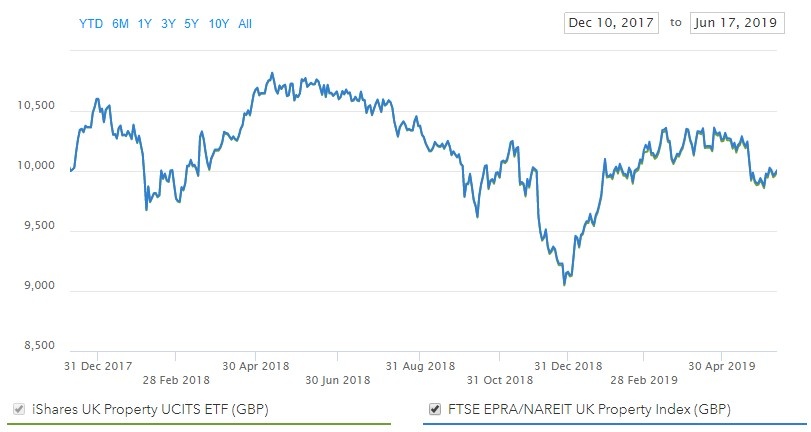
The second chart in each set is daily relative return strength measured against the FTSE250. Actually as a proxy for this I've used iShares FTSE 250 UCITS ETF, as I can get data on this and it is pretty close. The line is indexed against its own value 3 months ago (I mislabelled this). Momentum investors would generally want to see this climbing over several months.
Most holdings weren't looking too healthy prior to the suspension of Equity Income.
First of all those companies held by both funds. Clicking on the image should open them in a new tab if you want…