This post will focus on key giveaways the Composite Operator (CO 'smart money') and Institutions leave behind during trading ranges.
Successfully identifying these will help us determine whether an accumulation or distribution structure is forming. We can then combine fundamental research with the Wyckoff methodology to time low risk optimal entry points with a high probability of compounding capital at fast rates.
A good company does not always make a good stock, hence the combined approach.
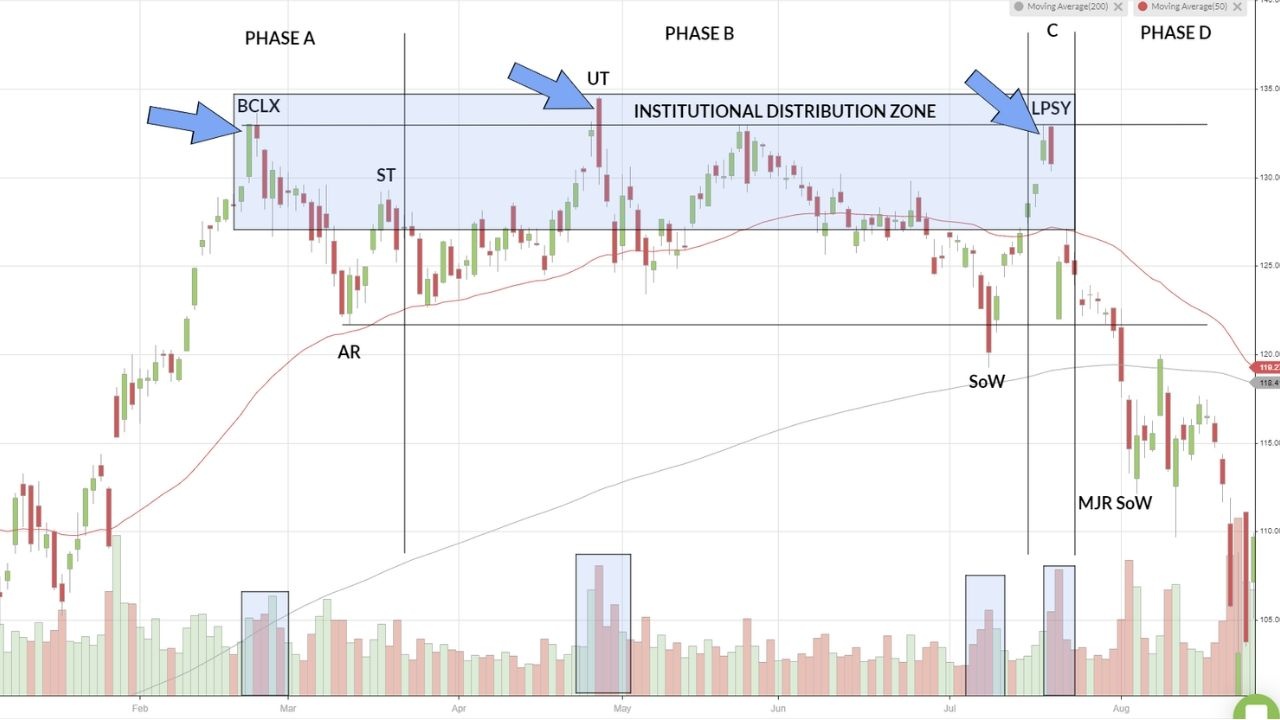
The two trading ranges are Gildan Activewear (GIL) and Apple (AAPL).
Do you notice the subtle difference between these two price structures? What can the Composite Operator (CO) and Institutions not hide?
If you said where significant selling and buying takes place to the first question, well done. If you said volume to the second question, doubly well done.
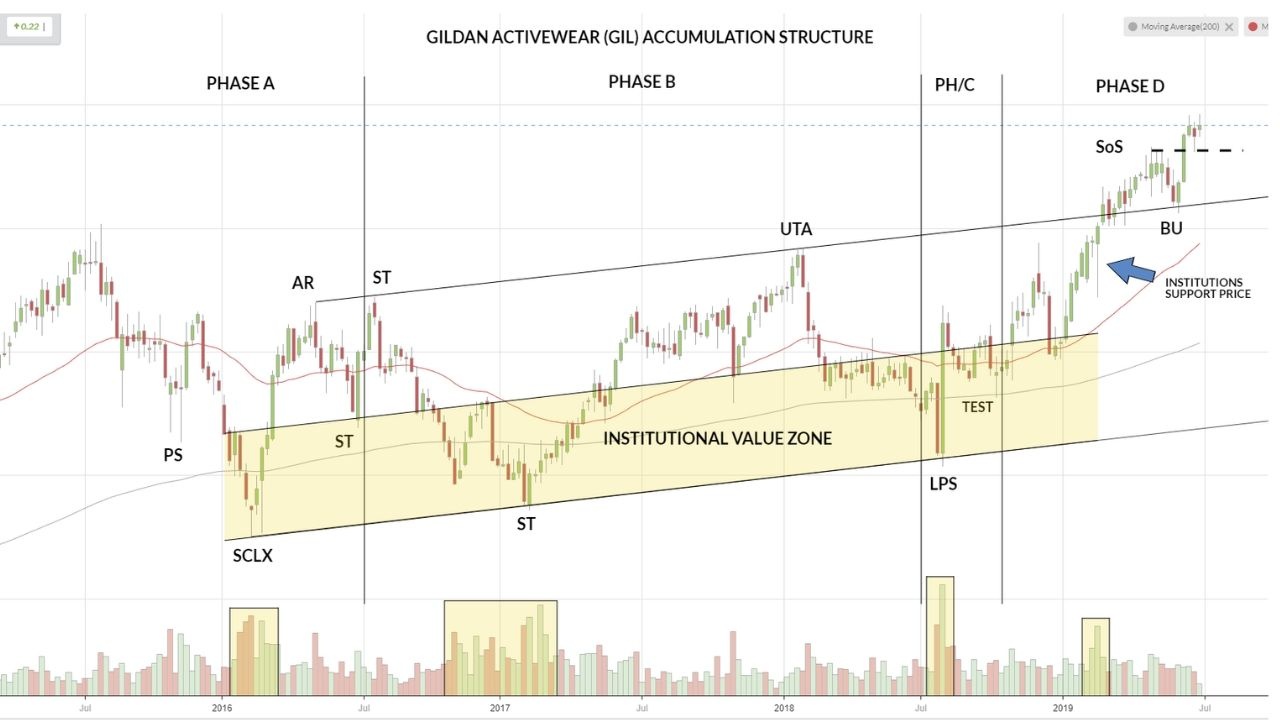
Let's go into the detail for some of the key giveaways that we can use to decipher whether an accumulation or distribution trading range is unfolding. Firstly, Gildan Activewear (GIL), where a yellow Institutional Value Zone is shown. Why is this an Institutional Value Zone?
- As the price sharply decreases into the Selling Climax (SCLX) we see the synchronicity between effort vs result changing. The final down-bar has little downward result yet the highest effort (volume) so far. This tells us that demand is present and beginning to absorb and overcome supply. The large demand tail on this final down-bar is another giveaway. After the SCLX we continue to see above average volume and a steep rally into the Automatic Rally (AR). Due to this continued high volume signature we determine the CO is still actively buying shares.
- The Secondary Test (ST) in Phase B of the SCLX has increased volume again and at a similar price level we saw the CO buying before.
- Notice what happens to the volume in the rally to the Upthrust Action (UTA) in Phase B. On the whole, it is below average. What does this tell us? The CO is most likely not participating in the rally nor are they actively selling. We'll compare this action to the distribution structure Upthrusts (UT) shortly.
- On the decline from the UTA to Phase C where we see the Last Point of Support (LPS) and Test, note the volume signature. On the whole, again, unremarkable. There was not, like we'll discuss in the…