
Good evening. I am writing this on Sunday 20 Mar 2016, and it's the last article from last week to catch up on, then we'll be fully up-to-date. So my apologies for the delay.
French Connection (LON:FCCN)
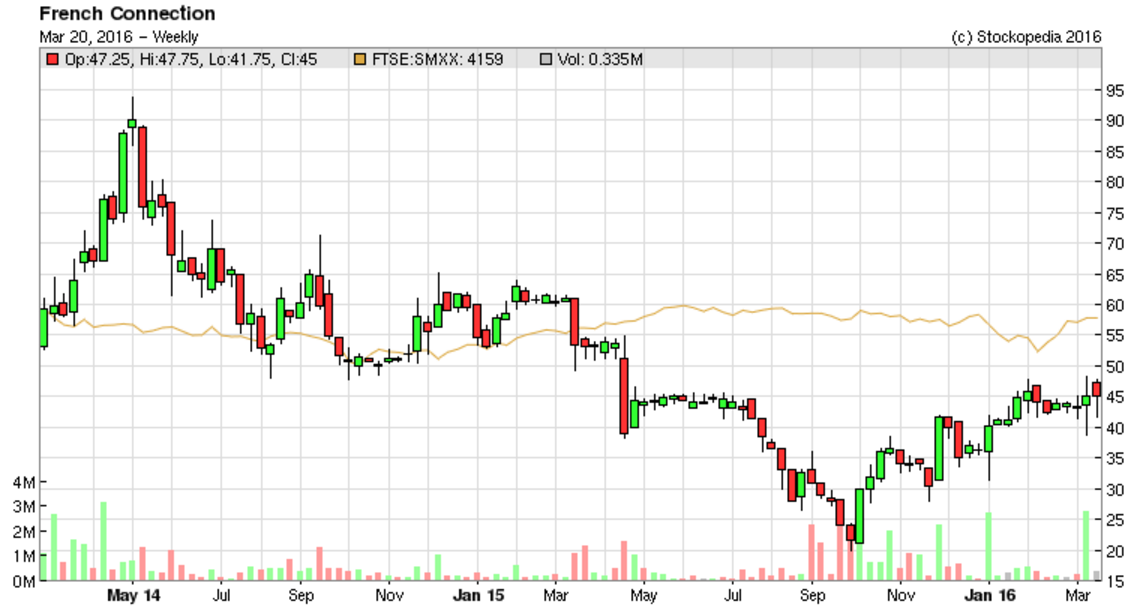
Share price: 45p
No. shares: 96.3m
Market cap: £43.3m
(at the time of writing, I hold a long position in this share)
Results y/e 31 Jan 2016 - looking back through the archive here, I've written about this share 19 times! It's a fascinating special situation in my view - an international fashion brand which is doing well in licensing & wholesale, but which has a disastrously loss-making retail division.
The investment opportunity, as I've said many times before here, is that the retail stores are gradually disposed of, hence shrinking the retail losses, which in the end should result in a decently profitable business.
So the only question really is whether the cash pile will see the company through the roughly 4-5 year process of disposal of loss-making shops (the average lease length is now 4 years). A couple of years ago, things were looking touch & go on that front, as losses were mounting, but I'm fairly comfortable that the cash should last until the group overall becomes profitable.
Interim results were dreadful - a loss of £ 7.9m (£ 4m worse than prior year H1) in the quieter 6 months of the year gave investors a fright, and you could have picked up stock as cheap as 23p last autumn (I know, because I did!). There's often a good trade on FCCN shares each autumn, as often people panic sell after poor interims, forgetting the seasonality of the business, where H2 is usefully stronger.
This year the seasonality was particularly pronounced, because the company had a poor spring/summer season, with clothing ranges not working well. Better performance ensued in H2. So the H1 underlying operating loss was - £ 7.9m, but H2 produced an equivalent profit of £ 3.2m, giving a total loss for the year of - £ 4.7m. That's not too bad, given that we already knew H1 had been a disaster. Although it's still a step in the wrong direction compared with a near breakeven result of - £ 0.8m in 2014/15.
This table shows the key breakdown of profitability, over the 3 activities of the group (retailing, wholesaling, and brand licensing);
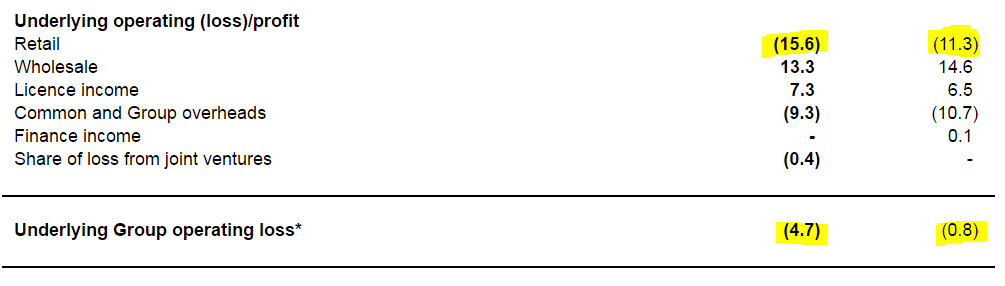
Retailing - as you can see, it's the retail division which is the millstone here, producing diabolical losses of -£15.6m in 2015/16. What concerns me, is that the losses have actually got worse - when they should be reducing, as 13 loss-making stores were closed in the year (this is only possible when leases expire, or it is possible sometimes to assign a lease).
I honestly don't understand how FCCN can lose so much money from its retailing division. It's turnover was only £ 92.4m, so the loss of -£ 15.6m is 16.9% of turnover! That's truly shocking. Mind you, I reckon the bulk of the losses could well be concentrated in just a handful of shops - especially the (soon to close) Regent Street one, and the Oxford Street flagship shop, which is on an astrononical rent of over £3.2m p.a. So that one shop alone probably loses several million pounds each year. Once it's gone (if they can assign the lease), then suddenly the group losses sharply reduce. I suspect just the closure of 3-5 key loss-making shops could move the group into profit overnight.
Regent Street store - a smashing deal was announced in Nov 2015;
Further, due to the redevelopment of the building, we will vacate our Regent Street, London store at the end of March 2016, at which time we will receive a compensation payment of £2.4million, while also removing the ongoing trading losses of the store.
That's wonderful - getting a big cash bung, as well as eliminating future trading losses, couldn't be better. I think the same thing may happen with the Oxford Street store, which would be the big one, and make a very big difference to the group's prospects I believe.
Look again at the figures above - if the retail division were closed down altogether (over a number of years), then the group would move from a loss of - £ 4.7m to a profit of £ 10.9m. Take off 20% tax, and put it on a PER of 20, and you've got a market cap of £ 174m - which is 4 times the current market cap. So there's good potential upside here, longer term.
Upward rent reviews, and the living wage are noted as pressures on costs going forwards, so I think it will still be an uphill struggle.
Licensing - is doing well. Profit in this division rose from £ 6.5m to £ 7.3m, and the DFS furniture (for FC branded sofas) is going well, and has been renewed for another 5 years. There are also perfumes, spectacles, and other. This brand is really valuable! Why else would the company make £ 7.3m p.a. just from selling the rights to put the brand name on other products. This is not in any way reflected in the market cap, but may well be one day, once the drag from retailing has gone.
Wholesaling - the most profitable part of the business, making £ 13.3m (before central costs), although that was down from £ 14.6m prior year. So FCCN can't seem to make it stack up in their own high street stores, but other companies can. Maybe that's the way for FCCN to go in future - concentrating on licensing, wholesale, and internet sales, and shutting down all its own shops?
Outlook - current trading sounds alright;
...the improvement we have seen during the second half and into the new financial year shows that we are definitely moving in the right direction. The reaction to this year's collections has been strong so far showing that we are on track. We are early in the year and have a considerable amount of work to do to take the Group back to profitability although I believe that the actions we have taken to date will go a long way to taking us there.
Remember that H1 last year was dire, so the company is now up against soft comparatives. Therefore the next set of interim results should show a favourable year-on-year improvement.
Balance sheet - it's still bulletproof. Ignoring fixed assets altogether, let's just look at working capital (i.e. cash, and things that will turn into cash, less liabilities).
Current assets were £ 78.9m (including £ 14.0m cash), and current liabilities were £ 36.1m. So the surplus is a whopping £ 42.8m - that's only £ 0.5m shy of the entire market cap! So the business & brand is thrown in for free. There are no long term creditors.
This is a tremendously strong position to be in. The cash has dropped sharply, from £ 23.2m to £ 14.0m, which is due to the trading losses, but also I note that inventories & debtors have gone up, when they really should have gone down. Those unfavourable working capital movements should unwind in the current year, especially as debtors includes the £2.4m due imminently from the Regent Street store closure.
So I don't see any issues with cash. I think you'll see a smaller reduction in cash this year. It really doesn't matter, because with a £ 28.4m debtor book, the group could if necessary borrow against that, using invoice discounting.
Basically, it's not going to run out of cash, unless trading suddenly deteriorates enormously, and for a sustained time.
New Directors - this is very interesting. The founder, who still owns almost 42% of the business, and will be celebrating his 70th birthday shortly, in May. So he must be considering options for retirement.
Two significant new board appointments were announced a few days ago;
Group FD - Lee Williams has joined from ASOS (LON:ASC) where he has been Director of Finance for the last 15 months, and previous retailing experience. A quick look at Asos's last Annual Report shows that Helen Ashton is their Chief Financial Officer, so it looks as if Lee Williams was perhaps in a no.2 role? Director of X is usually junior to X Director.
In any case, it looks a real coup for FCCN to have attracted someone with such relevant experience of internet retailing, that should be able to stimulate growth for them in that key area.
Non-Exec - Christos Angelides is joining the board. Again, a highly relevant & experienced addition;
Christos brings significant expertise in fashion retailing, having spent the majority of his career at Next Plc in a number of senior management roles, with the last 14 years on the main board as Group Product Director. Latterly he was President of Abercrombie & Fitch and Abercrombie Kids in the USA.
That's a real heavyweight, so it should be great news for FCCN, if these new appointments can work with the notoriously cranky Mr Marks!
My opinion - FCCN had a lousy H1, which we already knew about, but H2 was much better. That trend is continuing, so positive there. The balance sheet looks very strong still, despite cash being down sharply, I'm not concerned by that for the reasons given above.
The new Board appointments, if they work out, could prove very significant.
I remain of the view that there's everything to play for here, and taking a long-term view, I think there could be a decent payday here at some point. In an ideal world, Marks might decide to sell, and we wake up one morning to find an RNS of a blockbuster takeover bid! It's no good sitting on the sidelines waiting for good news, as it can often be too late to buy in, if the deal is already announced.
This share won't suit everyone, as it's a special situation, but I like it a lot. In my view an exit at 2-4 times the current price is entirely possible at some stage.
A few very brief snippets;
Zotefoams (LON:ZTF) - I'm intrigued by this company, due to its steady growth, and high operating profit margin. Results for 2015 show 11% revenue growth, and adjusted profit before tax up 14% to £6.4m. Whether that's enough to justify a forward PER of 20, I'm a tad sceptical.
The outlook comments do however dangle some interesting carrots in front of investors, re future growth;
We believe certain of our longer term developments are now reaching the point where market success is much more likely and we plan to further increase resources to support these opportunities. While being mindful of market and macro-economic conditions, the Board anticipates 2016 being another year of growth and remains confident about the long-term prospects for our business"
I've been meaning to properly research this company in more detail, for a long time. But the valuation seems a bit too high for the not particularly exciting profit growth achieved to date. Have any readers looked into this one at all?
Bango (LON:BGO) - the company is trumpeting 100%+ top line growth run rate, but by my rough calculations, it needs to increase revenues by 5-6 fold just to get to breakeven.
It's one of these awful cash-burning, jam tomorrow companies. £11m was raised in Nov 2015. Good job, as it's losing about £5m p.a.
I try to avoid companies like this - it's like trying to find a needle in a haystack. Very occasionally one of these companies succeed, but the vast majority are dismal, value-destroying failures.
Petards (LON:PEG) - a micro cap, but if you delve this low (about £4.5m mkt cap), then this one might be worth a look? Operating profit up 22% to £935k. Order book looks OK. Cash of £2.5m, but £1.5m in convertible loan notes - so it's vital to check the conversion terms, as there could be hidden dilution there if it's lower than the current share price.
Overall, looks potentially interesting. Also it has a StockRank of 99, although I don't feel the StockRanks are well suited to micro caps, as things can change so quickly with them. No divis. Possibly worth a look, but too small for me.
Satellite Solutions Worldwide (LON:SAT) - (I hold a long position in this share) - I'm disappointed that it's loss-making, with a £ 1.0m loss reported on £ 7.4m turnover. I had an interesting telecon with the CEO of this company recently, and it has a well-thought-out business model. It's buying up small, sub-scale satellite broadband providers, at low cost. The aim is to become Europe's premier provider of satellite broadband, for places which are too rural/remote to have conventional broadband. This is being driven by Govt finance initiatives. Although comments in the narrative suggest there are some problems with this.
Speculative, but potentially interesting I think. I only bought some for my SIPP because I was really impressed with the CEO, who has relevant experience, and struck me as very switched on.
All done now. Hoorah, we're up to date! I'll do my best to keep us up-to-date from now on.
Regards, Paul.
See what our investor community has to say
Enjoying the free article? Unlock access to all subscriber comments and dive deeper into discussions from our experienced community of private investors. Don't miss out on valuable insights. Start your free trial today!
Start your free trialWe require a payment card to verify your account, but you can cancel anytime with a single click and won’t be charged.