A Guide to 2017's Winning and Losing Investing Styles

The FTSE All Share rose by around 7.8 percent in 2017. But if you look behind the scenes, you’ll find that some parts of the market did exceptionally well, while other parts lagged.
In the past, if you wanted to know the finer details about these trends and what could be learnt from them, you’d have needed a hedge fund manager or a quant analyst to tell you. But not anymore. With the help of the StockRank Styles and RiskRatings, which we introduced this year, we can see exactly which types of investment approach worked in the market in 2017, and which didn’t.
Understanding Style Investing
Back in April 2013 we launched the StockRanks as a way of seeing the investment strengths of any share. Stocks are scored and ranked based on their exposure to Quality, Value and Momentum (and we use a combination of many measures to make that calculation).
With the combined StockRank we’ve seen very clear outperformance from high ranking shares over the past four years - and that continued in 2017. Indeed, high StockRanks are the foundation of Ed Croft’s NAPS portfolio, which he’ll be reviewing in the coming days.

One of the advantages of exploring these Quality, Value and Momentum ‘factors’ is that their different combinations help pick out radically different styles of investing. These styles map to different investing tastes which come in and out of vogue in different market environments.
We explore these different styles in a lot of our articles on the Stockopedia site. But if you’re new to this, here’s an easy visual way to think about this framework:
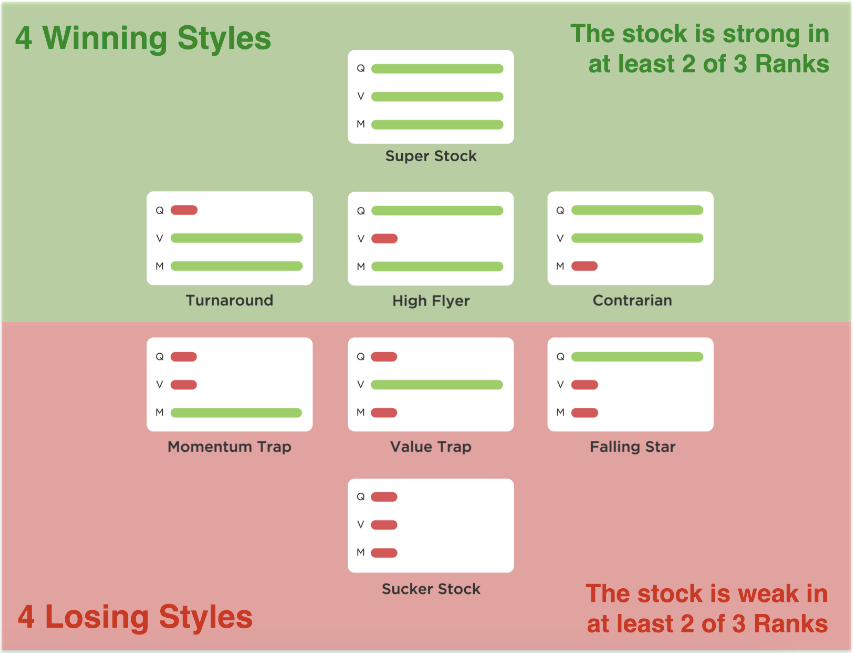
In essence, high exposure to at least two of the three factors (Quality, Value and Momentum) creates a winning style.
High Quality and Momentum (but poor Value) = High Flyers
High Quality and Value (but poor Momentum) = Contrarians
High Value and Momentum (but poor Quality) = Turnarounds
High Quality, Value and Momentum = Super Stocks.
Tom Firth and Oli Cooper, our analysts at Stockopedia, have crunched the performance figures, and their work in the following chart shows just how the StockRank Styles have done since the inception of the StockRanks in 2013.
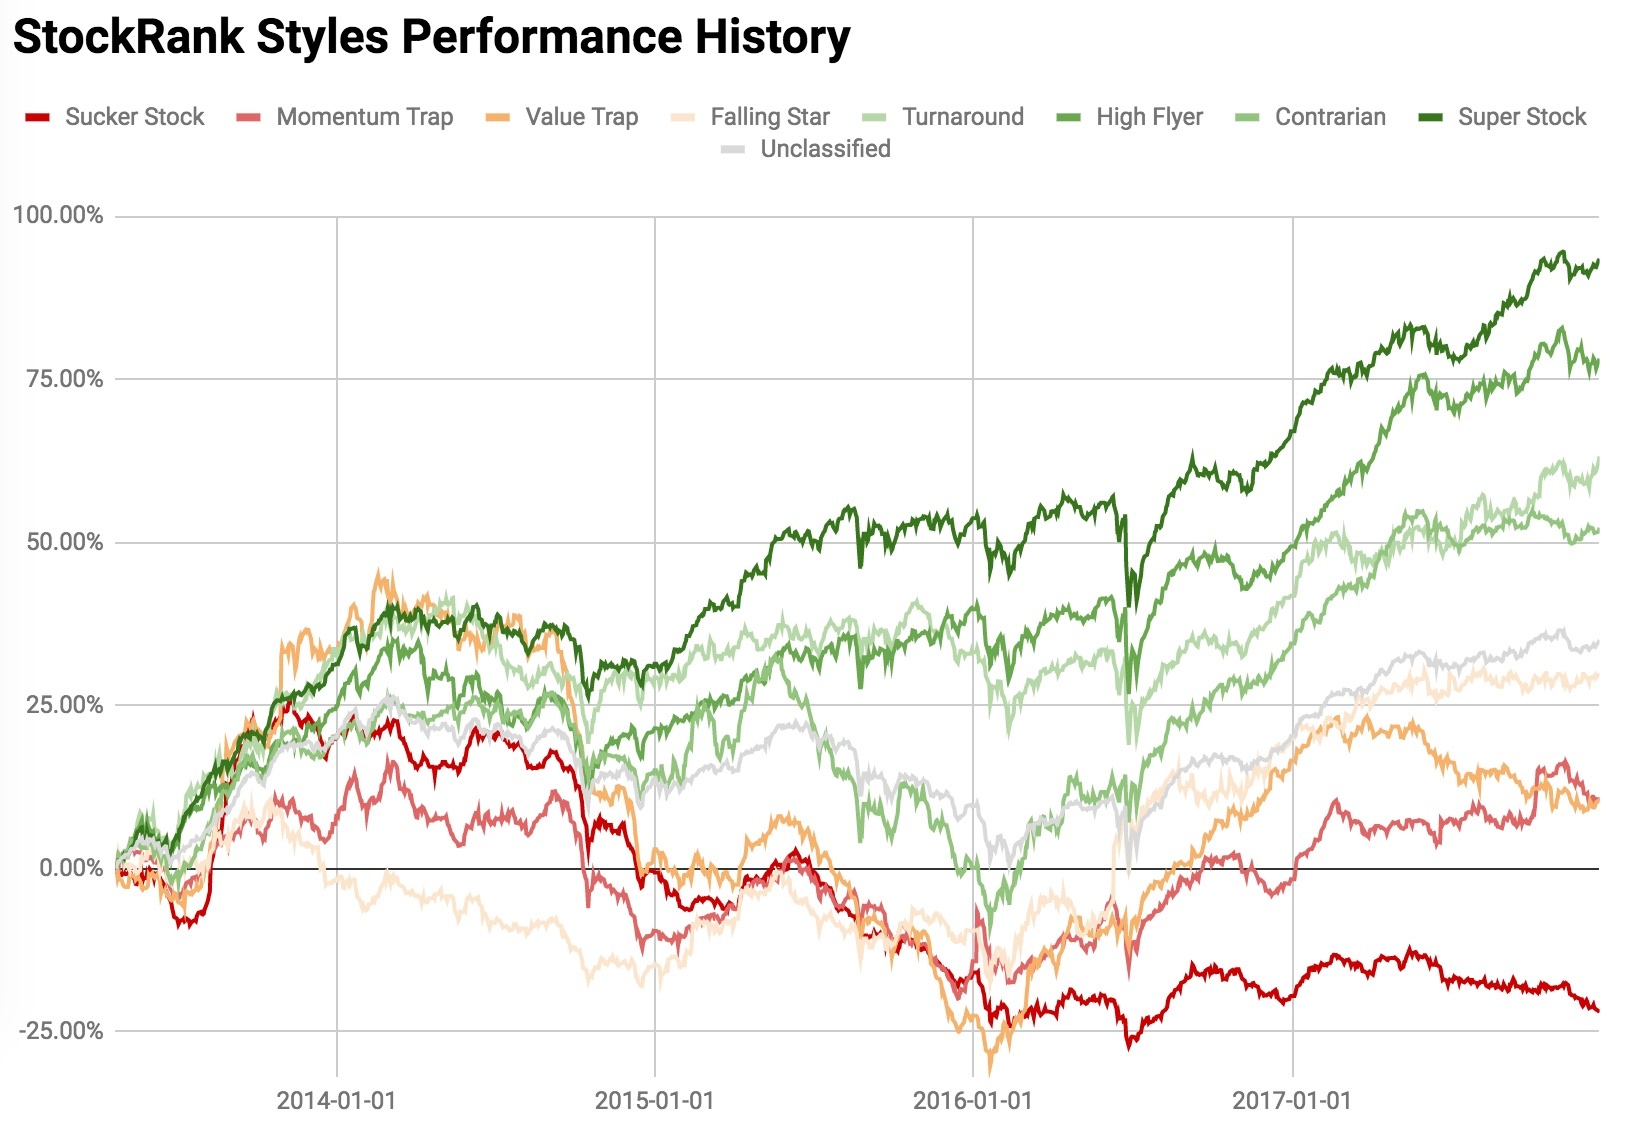
* 2013 data begins on 20 April 2013 (the StockRanks inception date)
Over that period, it’s clear how well the winning profiles have performed, with Super Stocks, High Flyers, Turnarounds and Contrarians, all trouncing the losing styles.
The chart for 2017, however, shows that the winning style this year has been High Flyers. High Quality, high Momentum (but potentially expensive) stocks have been the big winners, with a 19.2 percent return. At the other end of the spectrum, Value Traps (cheap but low Quality and low Momentum) have seen a minus 5.2 percent return overall.
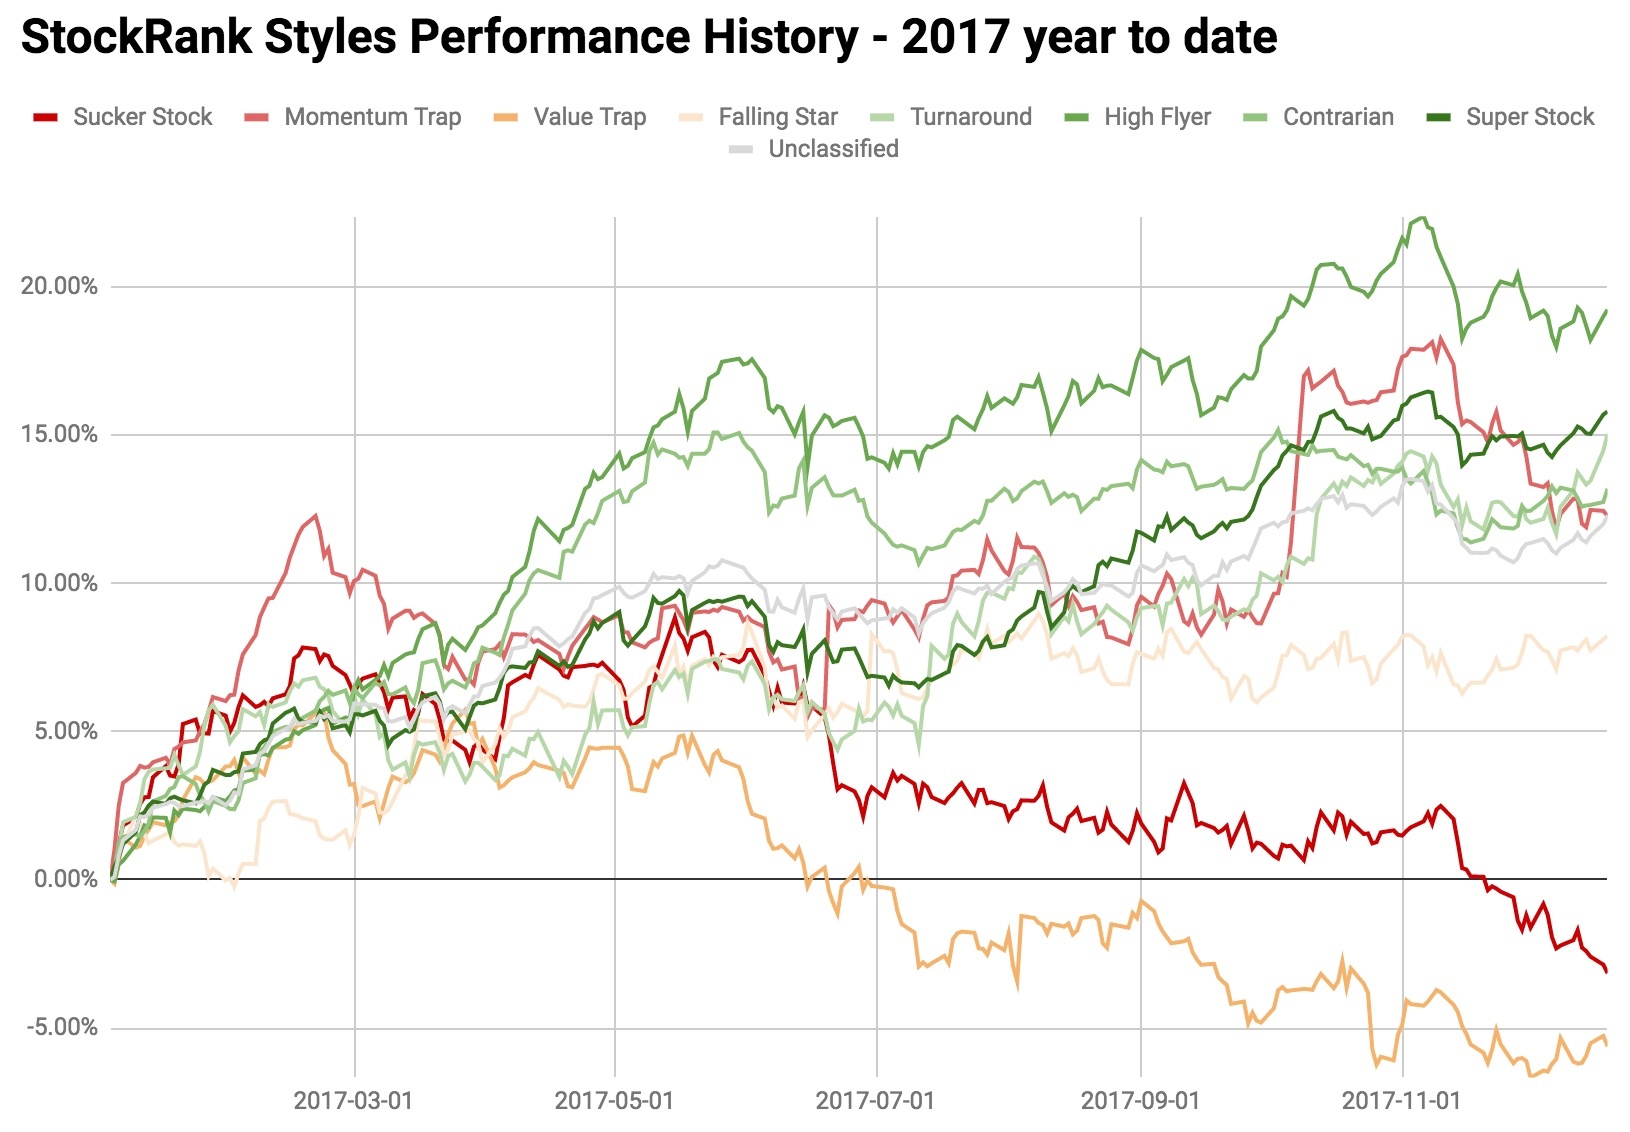
These findings tally very much with observations that value investing has been on its knees in 2017. Meanwhile, high quality, high momentum stocks have been very much sought after, at almost any price.
Which companies have been High Flying?
A lot of the big gains seen by High Flyers occurred in the first half of the year. Back then, it was stocks ranging from small-caps like dotDigital and Gear4Music to larger companies like Boohoo.Com, ASOS and Fever Tree Drinks that were leading the High Flyer list. You can find current HighFlyers using the menu in the StockRanks portal.
One important point to note - and this is a feature of High Flyers - is that they can fall sharply when either their quality or momentum weakens. This is exactly what we’ve seen in shares like Gear4Music and Boohoo.Com this year. They have switched styles to become Momentum Traps. Meanwhile, the others continue to be rated as High Flyers.
RiskRatings - did high risk investing win in 2017?
In tandem with the new StockRank Styles, we introduced RiskRatings earlier this year. These are our classification of the historic volatility of every company’s share price. The calculation itself focuses on the standard deviation of daily price returns over the last three years (you can read more about it here). What it tells you what the likely future volatility of a share will be as (in general) historic volatility is a good predictor of future volatility.
The classification (from least to most volatile) ranges from Conservative, Balanced, Adventurous, Speculative and Highly Speculative.
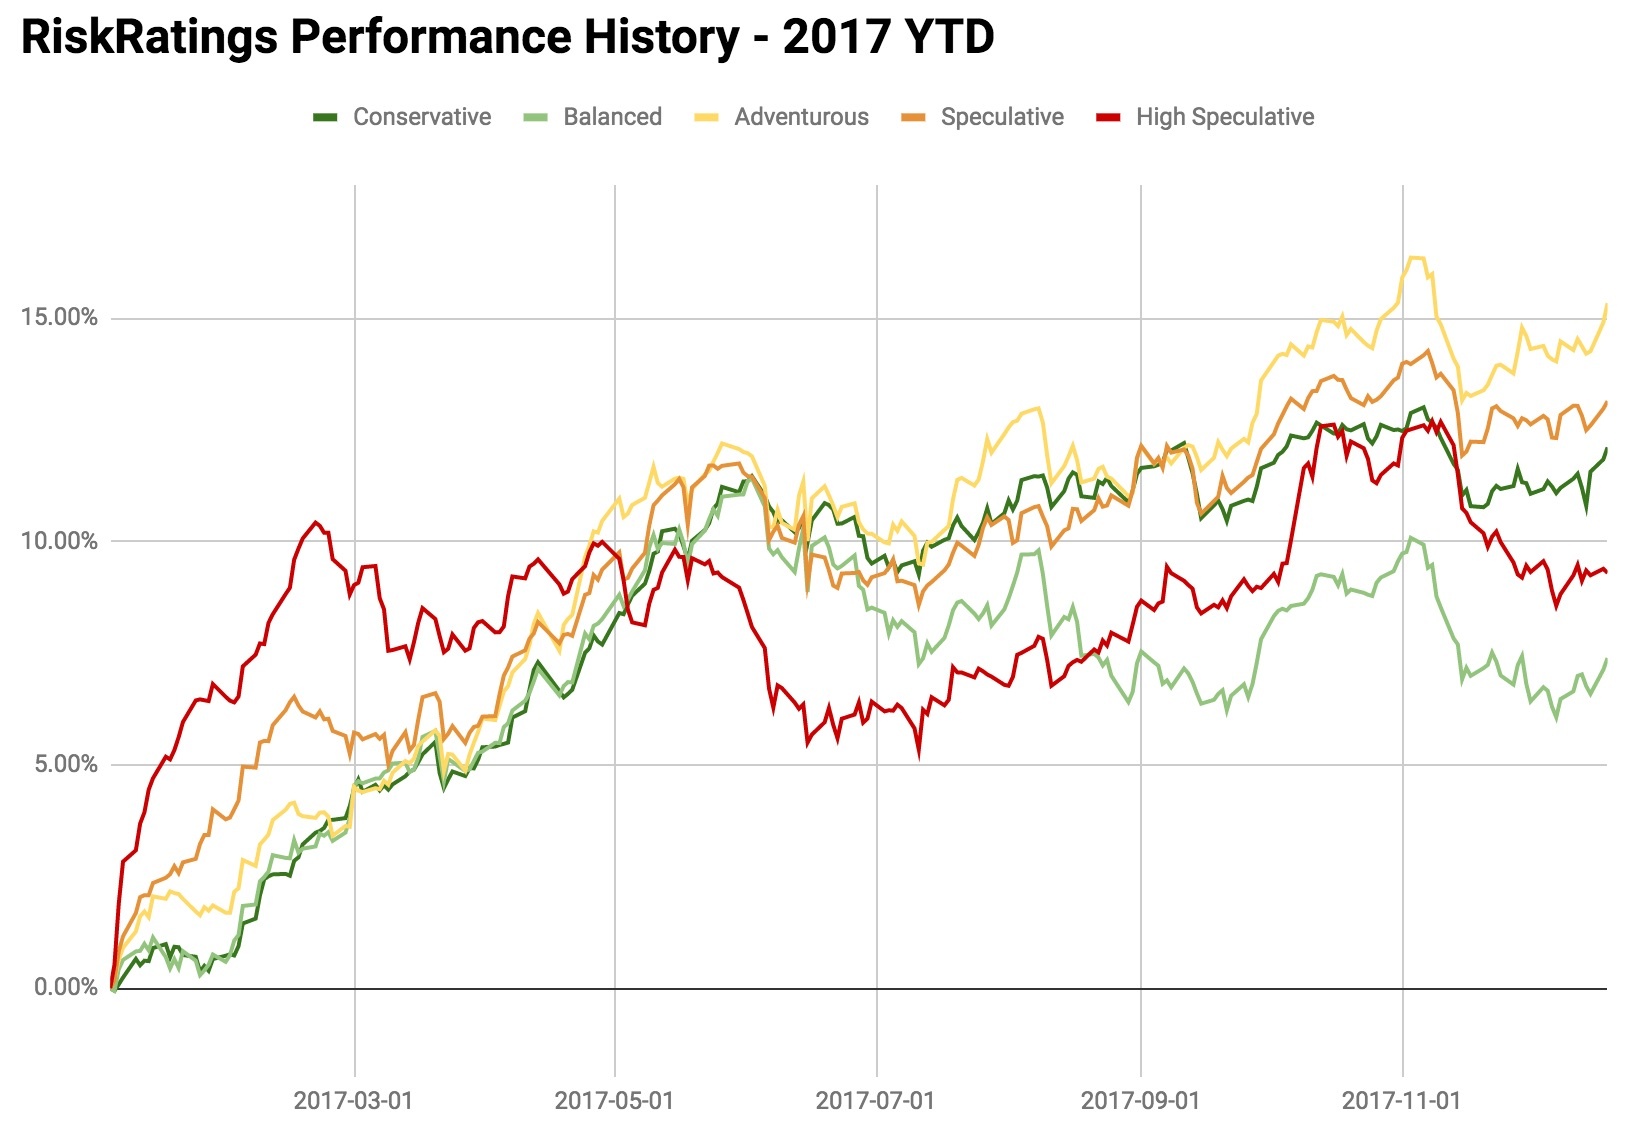
Over the period from April 2013, what we see is consistently strong performance by the Balanced and Conservative brackets, with Adventurous portfolios running very close. Perhaps more telling is that shares in the Specialtive and Highly Speculative brackets have done far less well. It shows that accepting high levels of volatility just hasn’t paid off and that low-vol stocks have outperformed.
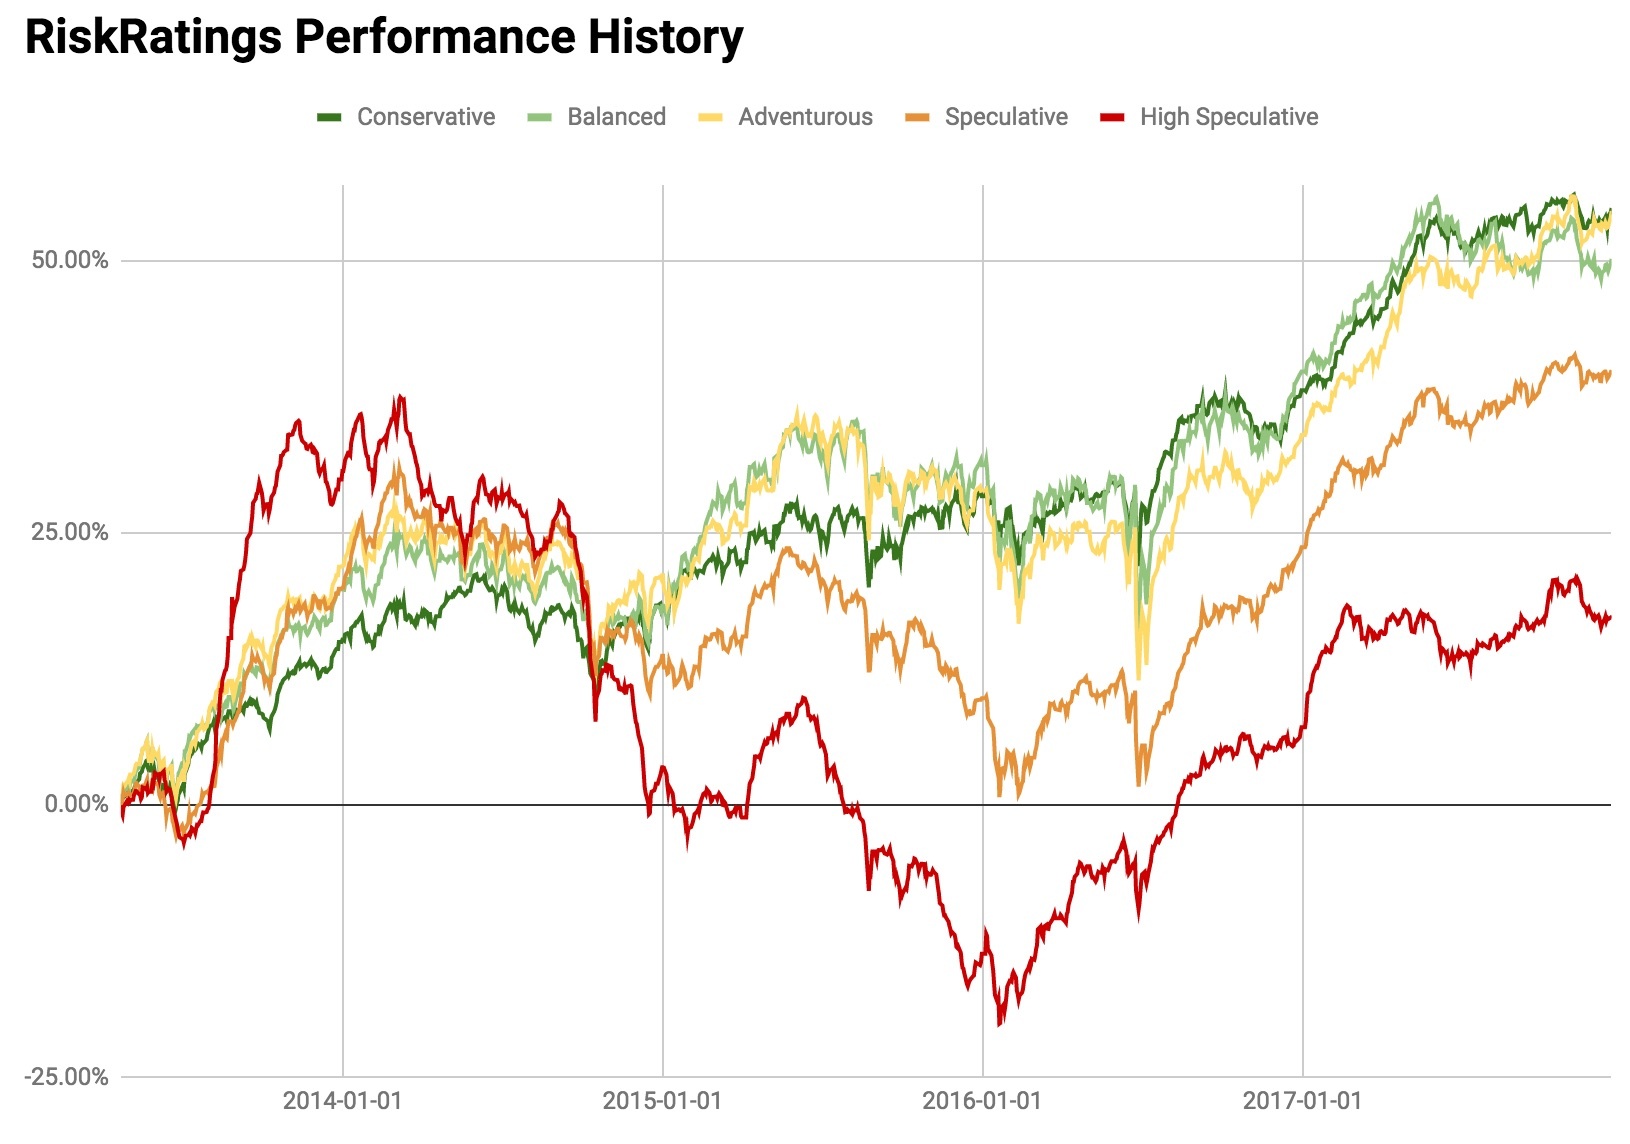
But in 2017 we see some differences from the medium-term trends. Once again, stocks in the mid-range Adventurous bracket have outperformed, with a 15 percent gain. Yet Speculative stocks have also done well, and that’s probably a nod to the fact that smaller, more volatile, shares have been increasingly popular on average in 2017. They are followed by Conservative and then Highly Speculative and Balanced categories.
These results match a lot of the research into volatility and how categories from Adventurous to Highly Speculative can outperform during ‘risk on’ market phases. The warning though, is that these categories can fall hard when the market turns. So if the market was to go ‘risk off’ in 2018 there could be a lot of money at risk.
Looking ahead to 2018
Analysis of the StockRank Styles and RiskRatings in 2017 shows that high quality, high momentum High Flyers were the big winners, and that stocks with mid-range Adventurous volatility have edged the best returns.
By contrast, Value Traps performed the worst, which confirmed the view that value investing isn’t working well in the current market. Over the longer-term, Super Stock portfolios continue to lead the performance chart, with all of the two-factor styles also performing well ahead of the market.
There was a mixed picture on which levels of volatility were optimum in 2017. But the longer term trends shows that the Adventurous, Conservative and Balanced volatility categories have seen the strongest returns.
Overall, these findings confirm that the market is very much risk-on and that funds are flowing into more speculative areas. The research around High Flyers shows that ignoring value can work well if a stock has good quality and strong momentum features. But without these characteristics there may be nothing to hold the price up except sentiment. So going into the new year, it’s more important than ever to double-check that stocks with rising prices genuinely deserve them.
You can download the RiskRatings book here
Happy Christmas and safe investing in the new year!
Disclaimer
This is not financial advice. Our content is intended to be used and must be used for information and education purposes only. Please read our disclaimer and terms and conditions to understand our obligations.
24 comments
I agree with Finance Director (post 17) and Cadmunkey (23) that it is difficult to decipher the colours on a ten colour chart and agree with Finance Director's suggested solution (post 17).
Great article, just a shame on my monitor I cant tell the difference between the shades of green so not sure which was best on each graph :(
Regarding the poor performance of the Stockranks versus the S&P500, could part of the reason be that the S&P500 has more megacap tech stocks that trade on high P/E and are likely to be low Value rank stocks as a result.
I don’t pay for access to the USA data but perhaps someone who does can lookup the Stockranks data for Amazon to see if V is low. Also how does the QM ranking do versus the S&P500?
£AMZN: QVM 70, 9, 97 (overall 65)
The article mentions market "risk on" and "risk off". How can one find out in which of these phases the market is in at any particular time?
Hi Ben,
Many thanks for the analysis, I've set up 3 screens essentially looking for super stocks in the balanced, adventurous and conservative risk rating. I've also further filtered for stock ranks greater then 90 as these factors seem to filter in mostly good stocks. I'm hoping this approach may prove to be resilient in wobbly times too.
On the topic of volatility, your analysis seems to back up Van Vliets findings that risk actually hampers reward however one big caveat to that!
All my big winners ( and fast winners) this year have been momentum traps. There seems to be a catergory of stock out there that seems to explode up without much warning and put on 100% or more in weeks or even days and they all seems to be the momentum traps to start with. Other MT's go on to fall or languish so it would be interesting and possibly profitable were you able to identify the big risers among the MT's before the event so to speak!
Im my case i bought Zoo Digital (LON:ZOO) back in Sept which has put on a good performance from the MT stable.
Being able to screen for these stocks would be nice!
@ddinksdadd - you can screen for them in 2 ways: usingthe sidebar "Style" filter in the StockRank Portal, or using a "Style" screening rule in the Screener. Click the links for the help pages on both features.
Very interesting; having been investing since the 1950s I shall be even more interested if these styles can be back tested for several decades as I suspect there may well be significant fluctuations in the performance of the styles over the years.
Gear4music has only fallen back 11% from it's peak. Also Burford Capital (LON:BUR) which was a Momentum Trap has gone sideways in the last 5 months since it became a High Flyer. MT did pretty well this year until the last 6 weeks when they have fallen back. I think people have taken some profits and moved more into cash or value stocks.
I see that in the final 1-2 months of the year the high flyer stocks seem to have gone down on the chart, with turnarounds and superstocks doing a bit better. This seems to reflect the knock various high momentum shares had towards the end of the year. Perhaps too early to tell if this indicates a slight shift towards value approaches?
p.s. this analysis is very helpful for reflecting on what to do for 2018!
I'm a little confused by these graphs.
According to this page: https://www.stockopedia.com/stockranks/performance/?exchanges=NYQ%2CASQ%2CPCQ%2CNAQ%2CNMQ%2CNSQ&field=_QVMScore_lo∩=10&period=1&buckets=deciles
We see that basically every strategy fails vs. the S&P index. So what's the takeaway? QVM doesn't beat the S&P 500?
One could argue that SP500 *is* QVM. In the past few years it's been hard to beat because the factor biases match those that have done well: the bulk are mature large caps doing okay and rarely outrageously priced (QV) and it's also got exposure to the right kind of momentum through large cap tech (Tesla, Netflix, Nvidia and the like). It's likely to become easier to beat in the future (for example if there's a proper equity bubble some time, you'll get the lunatic stuff turning up at some point).
I guess my point is this article has some weird graphs that don't seem to add up to me.
In the UK the QVM metric 90-100 decile claims to have returned 22% YTD. Whereas the US version returned a "terrible" 10%, made worse by the fact that the WORST decile (0-10) is outperforming the S&P at 23%.
My point is there are three possible scenarios:
1) The graphs in this article are lying.
2) A year isn't enough time to really know anything, so the graphs are meaningless.
3) The graphs are real but the system doesn't work on the US market.
I really want the QVM index to provide meaningful returns, but the simple fact that the QVM is a 'new' metric and seems to pan out so evenly in the EU and UK (but not in the US) graphs tells me it may reek of hindsight bias, meaning the new QVM metric was created specifically to spit out a beautiful graph that has no real forward looking power. This is what I mean on #1, the graph is a lie.
I'd obviously prefer #3 and happily go invest in the UK for 25% gains per year.
I don't want to speak for Ed or the Stocko team but my understanding is that it is indeed scenario 3.
For better or (probably for the) worse, articles written by the Stocko tend to be UK focused so unless explicitly stated I assume the article is purely focused on UK performance.
Ed has never said that the Stockranks strategy is bound to work rather they have been gathering evidence to support the research. It could be that the strategy becomes more/less efficient in differing markets and/or market conditions. That doesn't mean that when market conditions change that the strategy will continue to work or will fail.
Currently the UK & the EU versions are crushing the relevant index (and been since 2013) and the US isn't performing relative the S&P 500. I don't know why that is the case. Maybe it is best to buy an S&P 500 tracker for US exposure?
It'll be interesting to see what happens in all markets when the markets eventually turn bearish.
What I can tell you is that in my experience (close to 5 years now) that this approach has made very meaningful returns.
For me, this strategy has enabled me to make significant returns in multiple markets for close to 5 years and if that means I avoid certain markets then so be it. For example, despite being in the UK, I was out of the UK market for quite an extended period.
Best of luck
Phil
This is what Ed said about it in 2015: https://www.stockopedia.com/content/why-does-the-us-underperform-105552/?comment=2#2
That's an interesting link, thanks. I didn't mean this as an attack on Stockopedia, but as someone with no history in their methods the graphs looked a little TOO perfect 2/3 of them, so I am hesitant to accept it at face value.
It does mean a lot that in 2015 they acknowledged it wasn't working in the US (and continues to not work).
The question is, of course, as a US investor what can I do? Invest in ADRs?
The Stockranks are the output of factor analysis, which is itself the result of extensive academic research into market inefficiencies. In essence, there are certain features of markets which tend to recur and these lead to exploitable opportunities. Probably the most well known of these are the small cap and value biases, which indicate that you get a small excess return over long periods of time if you invest in small cap stocks or those with value characteristics. There are similar inefficiencies at work around momentum and quality stocks, the Stockranks seek to combine these using backtested data, although the precise way that this is done is the secret sauce.
The most likely reason that Stockranks are less effective in the US is that it's a much more efficient market - the underlying factors are better known and are being exploited more effectively by market participants. In the US it's extremely common for hedge funds to recruit academics who have done interesting research in these areas in order to facilitate that process.
It's incorrect to say factor analysis doesn't work in the US - it most definitely does, there's a vast literature that shows this - but the private investor has a lot less opportunity to exploit the factors because they're being arbitraged away by institutions. So probably your best bet is to invest outside the US or wait until there's some massive market disruption which means that market participants become forced sellers, as occurred in 2008.
timarr
Hi Ben.
Thanks for this. Interesting article and adds to the knowledge base in understanding how best to use the various ranking parameters.
One question on interpretation if I may. When measuring the performance of a particular Style or Risk Rating, when and how is the Stock ranked? For example, do you look at the Style of each stock at the start of the period and then follow the aggregate performance of that cohort to the present day; do you assess each stock everyday of the period being assessed and then aggregate the daily gains and losses for that particular Style; or, do you look at the Style on the final comparison date and measure the performance by looking backwards to the start of the period - or something else for that matter?
For the typical buy and hold investor, the most useful comparator would probably be the first measure (how does a given portfolio of a particular Style stocks purchased on a given date perform over time, irrespective of whether the Style changes in the meantime) but I’m not sure this is what the charts are showing.
Thanks,
Gus.
@gus1065 - yes the performance studies were done by holding the set of stocks from the start of each period and tracking an equal-weighted portfolio forwards, then rebalancing. The above studies are all 1-year performance studies with every year starting from a December 31st rebalance (except 2013 which starts on the 20th April).
Thanks Ed.
Gus
So do I understand correctly that if a share changes from say Momentum Trap to Super Stock and then High Flyer, it will remain a Momentum Trap for the whole period?
Great article!.... Would like to know more about 90+ ranked superstocks that are nonetheless speculative - since 2013. How have they performed? Versus 90+ ranked conservative stocks since 2013? Etc the above graph in this article may be too harsh on speculative stocks, when readers will in reality not be investing in the low rank stocks... I also think one year data is of more limited value.
@London2000 - we haven't updated the return studies of the Style/Risk combinations since I did the launch webinar back in April/May. But you can learn a lot from watching towards the end of this video. In summary, speculative high flyers were the top outright performers, but conservative super-stocks were the best risk adjusted performers.
Hi Ed,
Love everything about Stockopedia, but please spare a moment for those of us who are colourblind (there are more of us than you think!).
When offering graphs such as in this article the colours can be difficult to distinguish, so a supplementary bar chart showing the eventual outcome of each style would show the 'end position' that we can then use to calibrate the graphs. If you can ask your team to take account of the 'colourblind' issue with graphs and illustrations at the design stage it would be another 'plus' for your software versus the competition.
Thanks and have a great 2018
Mike