Here is a chart of the deciles of performance across all shares with a market cap greater than about £80M Year-to-Date:
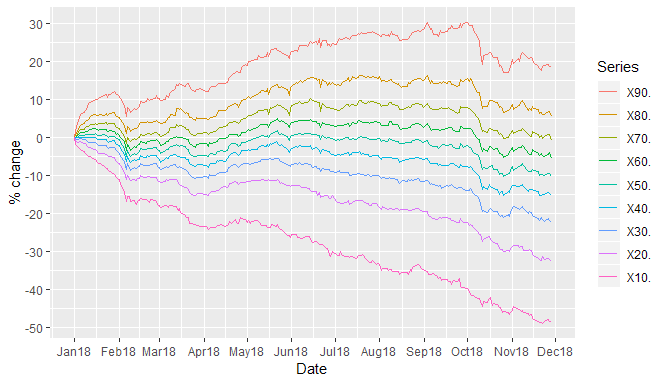
The big drop in sentiment occurred in October but we can see that upward progress had begun to stall from June onwards.
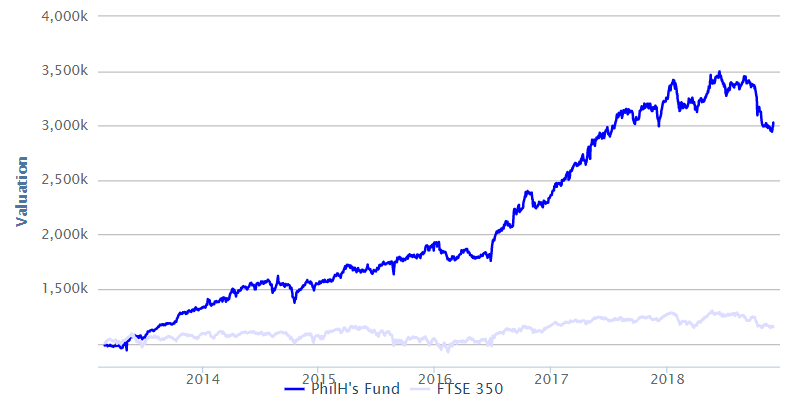
Now what is interesting is to compare your own portfolio against these deciles and characterise its performance in terms of the percentage of the market that it beats.
If we do this for Stocko's NAPS (which is a useful benchmark for this kind of thing) we get this:
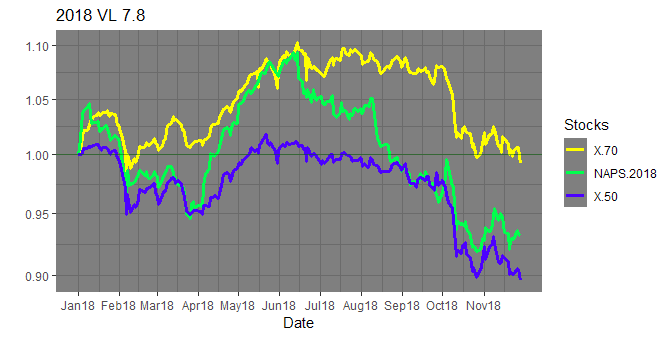
The NAPS portfolio has moved between the 50% and 70% deciles during the year. Last year it was able to continue to power up through the 70% decile, but this year after June it lost steam and it is now brushing the 50% percentile.
I track several differently constructed portfolios against the market and I've seen something very similar for all of them. Some of them held on for longer than NAPS before the drop and then fell more steeply. But most of them are now brushing the 50% percentile.
What seems to have happened is that many methods of "discrimination" (such as factors) have simply stopped working for now, so that the portfolio performs the same as if the stocks were chosen at random (and hence performs close to the market median i.e. 50% decile.)
However, whereas a tracker might have simply taken a gentle 10% fall since the start of the year, many portfolios were up 10% or even 20% on the year until September, and so the reversion back to the median has been more painful than if they had never risen at all. Mentally, we had "banked" the gains and now we find that they were never really there.
(There is a little bit more to it than that, because where we choose to put the base level to compare progress against (in this case 1-Jan-2018) will change the interpretation. But correcting for this makes the graphs harder to understand, so I'll leave it for now.)
You can see a similar thing if you look at the YTD plots for the various Stock Rank types. If you view the annually rebalanced versions they struggle to escape the FTSE All Share index this year. For mark caps >£100M…