Last week, I wrote an article looking at some ways investors could take a more objective approach to assessing one of the more popular chart patterns: bowls. This was in response to a challenging article that Ed wrote, asking whether such patterns were actually more logical than the sceptics, such as myself, might believe. The reason is that they may represent different time periods of Momentum that academics agree impact stock prices. This generated some fascinating debate in the community, so I thought it would be a topic worth expanding on in a subsequent article. But first up, an apology.
Erratum
I appear to have made a mistake in one of the calculations in my original article. When calculating the possible returns to investors, if the share price follows a parabolic (bowl-shaped) path, I used trading days to calculate the CAGR. Since the graphs actually use all days, I understated the possible annualised returns. The actual figures (from 27th October close prices) would be more like this:
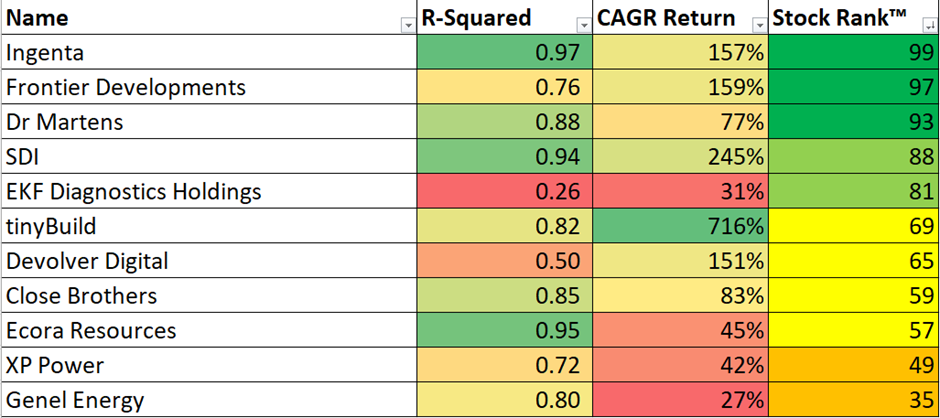
Of course, these are highly theoretical and depend on the share price following a specific recovery path. Although the difference between my original 134% calculation for SDI (LON:SDI) and the new 245% is unlikely to disappoint anyone who invests based on the chart shape, I apologise for getting this wrong in my first article.
Some more ideas
The mistake above made me think I could have been more relaxed about how far a stock had fallen in this screen. After all, a relatively rapid 50% recovery in a stock that has already shown signs of a turnaround will still give an incredible annualised return. Investors are often reminded of the maths of compound returns; that if a stock has fallen 30% it takes a 43% gain to get even. This is usually quoted as a warning for investors to minimise losses. However, this calculation works both ways, and I may be able to relax the 3-year relative strength criteria and still find good recovery stocks:
![]()
One enhancement that subscriber Jon F suggested was to ensure that the 3-month and 1-month relative strengths were positive, indicating that a recovery is underway. I think an argument can be made that adding 3-month positive relative strength makes sense. However, I would specifically…