THE IDEA
Suppose we want to build a screener using a set of rules to create a portfolio which meets some criteria. (For example: good performance over the next year.)
These rules look like:
metric > value
or
metric < value.
So they divide the stocks into two sets: the stocks we keep and the stocks we reject - hopefully in a way which meets our defined goals.
In statistics this is called a classification problem and the value is called the 'cutoff'. Are there any guiding principles we can use to choose these cutoff values?
A portfolio usually turns out to contain about 10% super performers, 10% disasters and 80% not doing very much in the middle. So if you can change the ratio of super:disaster, and in particular avoid disasters, you can tip the portfolio into better performance. The mush of middling performance in the middle will have quite a low effect on the overall portfolio performance so we don't worry too much which of these stocks get included or rejected by the rules.
It turns out that this mush in the middle is quite handy. If we try to maximise the ratio super:disaster for each rule individually we introduce a lot of data mining errors, because the best ratio is likely to result when 'super' and 'disaster' are both quite small numbers - which encourages very high cutoffs. And the exact value of the cutoff is very sensitive to exactly what happened in the period we are using to test out theory. This is a classic example of over-fitting to historical data, and will almost always give poor results.
So instead of doing that, let's try to maximise the value (super - disaster) for each metric instead. This way we pass as many stocks through each rule as possible, subject to trying to keep a big excess of super stocks versus disaster stocks.
As a consequence, we will need more rules to reduce down the number of stocks that pass to a sensible portfolio size, because each rule prunes away relatively fewer extra stocks.
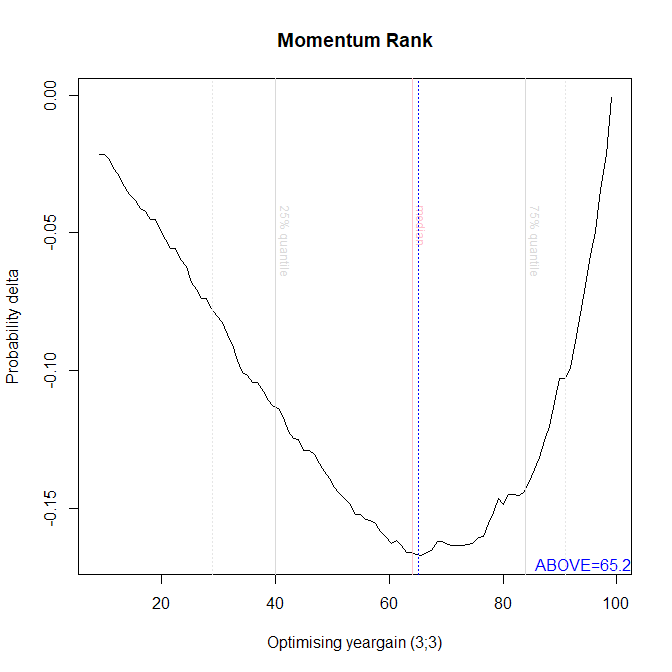
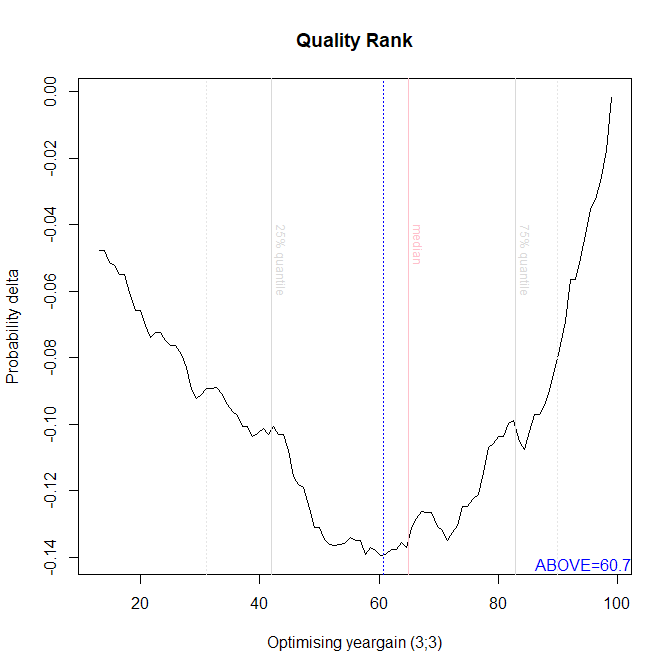
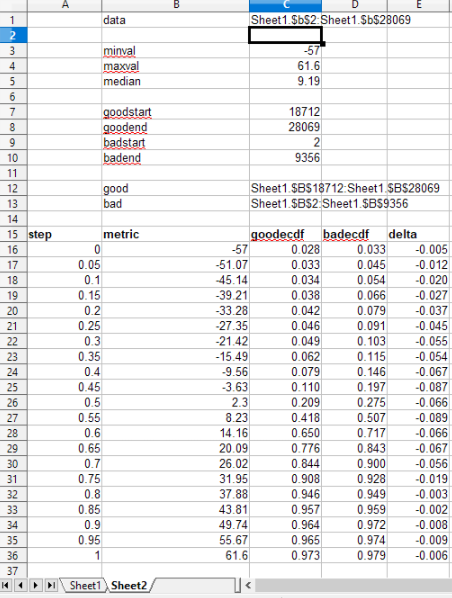
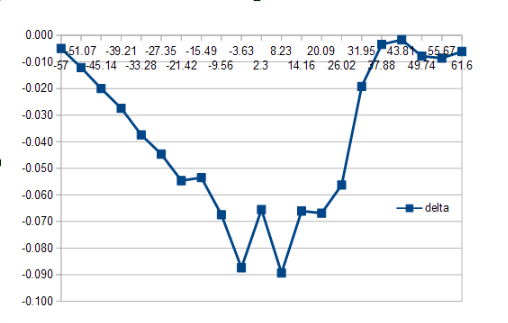
Originally I calculated cutoffs for the metrics that I've kept data for. For example, here is a plot of an analysis for the "ROE %" metric.
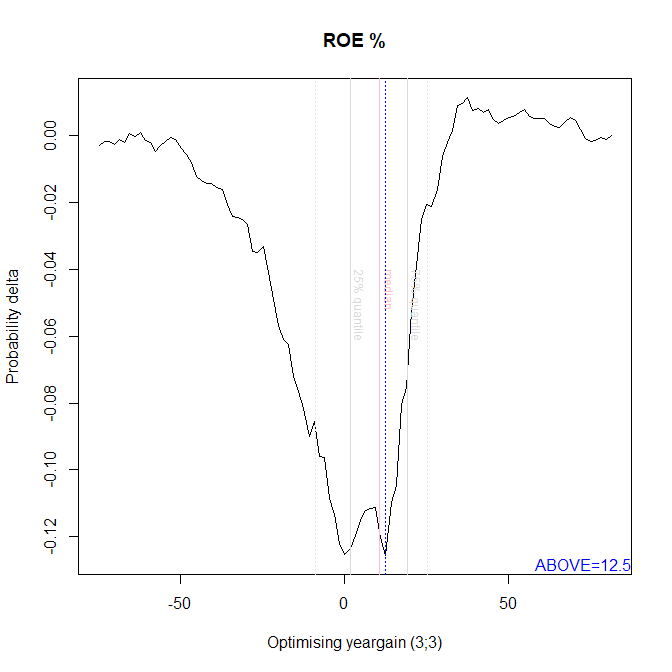
The minimum of the function (shown by the dotted blue line) locates the…