Can you use the liquidity anomaly to increase your returns?

Market anomalies keep appearing on the horizon like bandits threatening to shoot down the ‘efficient markets theory’ forever. Stockopedia subscribers will of course be familiar with the quality, value and momentum anomalies, but this is the tip of the iceberg - there are many more out there.
Take liquidity for example. The common assumption that it is safer to trade liquid stocks. If a share price falls, it is easier to sell. Everyone knows this, but to make money in the stock market, it is often important to do what everyone else is not doing.
That is the essence of contrarian investing, so this week we explore the contrarian and indeed counterintuitive hypothesis that illiquid stocks do beat the market. Indeed, we explore whether it pays to be a dry investor, in illiquid stocks.
How do we measure liquidity?
Before we go any further, we need to clearly define what we mean by liquidity and outline how to measure it. Liquidity is essentially the extent to which a share can be bought or sold without affecting the share price. If a stock can be traded easily, it is more liquid. There are several ways to measure this, but for now, lets stick with:
- Share-turnover: This is calculated by dividing the total number of shares traded over a period by the average number of shares outstanding. The higher the share turnover, the more liquid the share of the company.
- Bid-Ask Spread: The Bid-Offer Spread, also known as the Bid-Ask Spread, relates to the quote of the price at which participants in a market are willing to buy or sell a stock or security. The bid price is the price at which a party is willing to purchase, while the ask (or offer) price is the price at which someone is willing to sell. The wider the spread, the more illiquid the stock.
- Trading Volume Trend: This does what it says on the tin. If a share if becoming less liquid, it has a negative Trading Volume Trend.
Emotional biases against illiquid companies
It is easy to understand why an investor might choose to ignore a stock with good quality, value and momentum credentials simply because it is an illiquid stock. In a recent paper, Ibbotson, Chen, Kim and Hu explained that ‘liquidity has a cost—namely, that stocks may take longer to trade and/or have higher transaction costs. In other words, all else being equal, investors will pay more for more liquid stocks and less for less liquid stocks.’
Robert Haugen - author of the Inefficient Stock Market - highlighted further barriers to investing in illiquid companies. He pointed out that investors would need to trade less liquid stocks ‘slowly and patiently to avoid having their trades affect the prices of the stocks’. Haugen added that ‘although many investors are willing to trade patiently, even more are not.’
Is it safer to swim in shallow waters?
An investment style tends to deliver good payoffs if it adopts a contrarian characteristic - one which the market deems to be undesirable. For example, investors may dislike value stocks because they believe companies are cheap for a reason. They might also dislike momentum stocks because they are afraid to buy stocks at price highs.
It follows that further buying opportunities may be created by the barriers which prevent investors from selecting illiquid stocks. Indeed, when Amihud and Mendelson used bid–ask spreads to explain stock returns, they found that between 1961 and 1980 higher-spread equities yielded higher returns than lower-spread stocks. Ten years later, Haugen and Baker (1996) and Datar, Naik, and Radcliffe (1998) demonstrated that low-turnover stocks, on average, earn higher future returns than do high-turnover stocks.
These findings were more recently corroborated by Idzorek, Xiong and Ibbotson (2011). They found that ‘composites of mutual funds that hold relatively less liquid stocks dramatically outperformed composites of funds that hold more liquid stocks’. Indeed, Table 3 - sourced from Combining Liquidity and Momentum to Pick Top-Performing Funds - shows that low liquidity composites outperformed high liquidity composites by 0.45% a month.
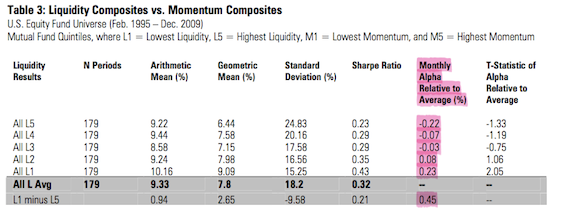
(Source: Idzorek, Xiong and Ibbotson, 2011)
It is also important to point out that illiquid stocks appear to be less volatile, partly because liquid stocks are of course easier to trade. Table 3 shows that the standard deviation (volatility) for illiquid stocks is 9.6% lower than liquid stocks.
A new approach to investing?
Should liquidity be treated as an investment strategy? In 2013, Ibbotson, Chen, Kim and Hu argued that ‘liquidity should be given equal standing with size, value/growth, and momentum as an investment style.’ They added that ‘the returns of liquidity are sufficiently different from those of the other styles that it is not merely a substitute.’
To corroborate their case, Ibbotson et al showed that relatively illiquid stocks consistently outperformed more liquid stocks, regardless of the respective companies’ market cap, value or price momentum. Ibbotson et al found that:
- Within a microcap basket of stock, the low-liquidity portfolio earned an annual return of 15%, in contrast to the high-liquidity portfolio return of 1.3%.
- Across a large-cap portfolio, the low- and high-liquidity portfolios returned 12% and 8%, respectively.
- Amongst low value stocks, the low-liquidity stock portfolio had an annualized return of 10% whereas the high-liquidity stock portfolio had a return of 2.2%.”
- Amongst high-value stocks, low-liquidity stocks had an 18% return whereas high liquidity stocks had a return of 10%.
- Amongst high momentum companies, low-liquidity stocks returned 16%; high-liquidity companies returned 8%.
- Within a basket of low momentum companies, low-liquidity stocks returned 10%, whereas high-liquidity returned 3%.
Here are the data tables from Ibbotson et al’s paper - Liquidity as an Investment Style, which was published in the Financial Analysts Journal in 2013. You will again notice that illiquid stocks are less volatile than liquid stocks (in terms of standard deviation).


(Source: Ibbotson, Chen, Kim and Hu, 2013)
Blending ‘dry’ investing with QVM
Multifactor investing tends to beat single factor investing. In other words, a value approach will usually be outperformed by a strategy that blended value with momentum. The investment literature also suggests that ‘dry’ investing would blend well with quality, value, momentum or growth approaches.
William O’Neil - author of How to Make Money in Stocks - outlines that an ideal environment for share price appreciation is created when demand for a stock is high but the supply is low. However, O’Neil likes to blend illiquidity with growth and momentum. Indeed, he believes that demand for companies’ stock should be stimulated by the introduction of a new product which drives company earnings upwards.
Ibbotson et al also believe that ‘dry’ investing would blend well with value and momentum approaches. Their 2013 paper - Liquidity as an Investment Style, shows that:
- High value, low liquidity stocks outperform high value and low value stocks (Fig. B).
- High momentum, low liquidity stocks outperform high and low momentum stocks (Fig. C).


(Source: Ibbotson, Chen, Kim and Hu, 2013)
Conclusions
There is strong evidence that liquidity could be used alongside quality, value, momentum and other market anomalies to generate positive stock market returns. This is partly because investing in illiquid stocks in indeed counterintuitive. We assume that illiquid stocks are risky, but that is precisely why dry investing could work. A company may have enormous profit margins, a bulletproof balance sheet and still be cheap, but emotional biases take over and we miss out on the party simply because the stock is illiquid with a wide spread.
Whoever said we were rational investors? Whoever said the market was perfect?!!!
In light of this research, Stockopedia is looking to provide liquidity ratios and rankings on our website. We will keep you posted.
Disclaimer
This is not financial advice. Our content is intended to be used and must be used for information and education purposes only. Please read our disclaimer and terms and conditions to understand our obligations.
7 comments
Hi Cig,
Thanks for these insights.
I agree with you when you say that "you need to be ready to keep to your guns, for years in practice". Ibbotson et al note that "trading costs can be mitigated by those investors who have longer horizons and do less trading".
Re Figs B and C: To the naked eye, the respective high value + high value/low liquidity portfolios seem to move in parallel over every short-term period, though there is a clear outperformance over the long-run. This is of course why a long holding period may be needed.
It seems that the portfolios which combine low-liquidity with high value and momentum outperform because they don't suffer as badly during a bear market. So I'm included to disagree with your point about "higher drawdowns during crashes". Look at the early 1970s for example; high-momentum** dips lower than high-momentum/low-liquidity. Same in the late 1970s (1979 oil shock?). Same around 1982. Same in the early 2000s.
The fact that illiquid stocks are harder to trade no doubt plays a part here. Again, this is consistent with Ibbotson et al. They "believe that less liquid portfolios have higher returns in equilibrium—not because they are more risky but, rather, because they have higher transaction costs." Until around 2003, this would seem to explain the outperformance of high momentum + low liquidity vs. high momentum. Illiquid stocks had a softer landing. Then, in the run up to 2007, they had a faster take-off. This may be because illiquid stocks are of course off bounds to the 'smart' money in hedge funds and other large investors. There is a good chapter on this in Jackass Investing by Michael Dever: http://amzn.to/1smXX7L
Best,
Alex
"The chart vertical scales are logarithmic - if you convert them back to normal linear scales then you'll find that the lines are not parallel."
Yes I noticed and wondered about that, and concluded that a constant diff would be preserved, unfortunately without proving it analytically as my maths are too rusty.
(edit: playing with a spreadsheet I made the same error as you it seems, and thought I was wrong too! ;-))
Hi Cig - With respect to your comments on Charts B+C looking parallel beyond 1997 & 2007 respectively:
The chart vertical scales are logarithmic - if you convert them back to normal linear scales then you'll find that the lines are not parallel.
If you start with 2 parallel lines on a linear vertical scale and convert to a log vertical scale then the lines will converge.
Charts B+C don't converge on the log scale - therefore it appears that the effect still stands and continues to grow with time.
Thanks for highlighting this - at face value your comments seem perfectly sensible. However, 5 minutes setting up parallel lines in a spreadsheet graph and switching to a log scale has enlightened me.
Edit:
Ooops ! - after a re-visit and another 5 minutes with the spreadsheet . . . . . parallel lines on a log scale equate to a constant growth rate. Therefore, you appear to be correct - the outperformance does disappear. Apologies, Cig - consider me further enlightened!
Another thing: I'd expect the low volatility to only work on short horizon, as crisis tend to include a flight to safety, which means that illiquid stocks will tend to be low volatile on time frames you don't care about, and highly volatile when you do (e.g. higher drawdowns during crashes). Another pain factor to compensate the patient investor for.
I don't think an illiquidity premium is particularly counter-intuive, I call it the price of patience. Getting paid to take pain is what should happen in a working market.
Trading illiquid stock will obviously be lossmaking if you churn faster than the liquidity premium allows, so you need to be ready to keep to your guns, for years in practice. Estimating churn costs is tricky and often academic studies skip it and show the gross effect, or something underestimating friction, which can be much larger than the achievable real world effect. Sometime there is just no net effect left, and you're back to efficient markets. For liquidity I would guess there is some effect left, but that exploiting it is not trivial.
Besides look at the chart (B) above: basically the high value and high value + liquidity lines are parallel since about 1997, which suggest there's been no liquidity premium since then (15+ years!) and all the alpha comes from the early period. It almost invalidates the paper! I find it striking that they included that chart as supporting their thesis, or that commentators don't notice the flaw. The momentum one (chart C) has "only" failed since 2007, still a long time to stomach bad perf.
In a more general way, that's an issue with many strategies that look good on long term back tests (including those that look better than the one shown in that chart): they can include very long periods of non-descript or under-performance. It's very easy to like a strategy that looks good on decades, but pretty hard to keep to it in practice when you face it doing nothing or worse year after year, and all you have is the hope that over the very long term (maybe more than your own expected lifetime...) you may win back... that probably goes a long way to explain the "abnormal" returns: people take pain and are (sometimes) paid for it.
Thanks Alex, top article!
Good article and great news that you are looking to add liquidity ratios and rankings on your website. Thanks keep up the good work.