Dear all,
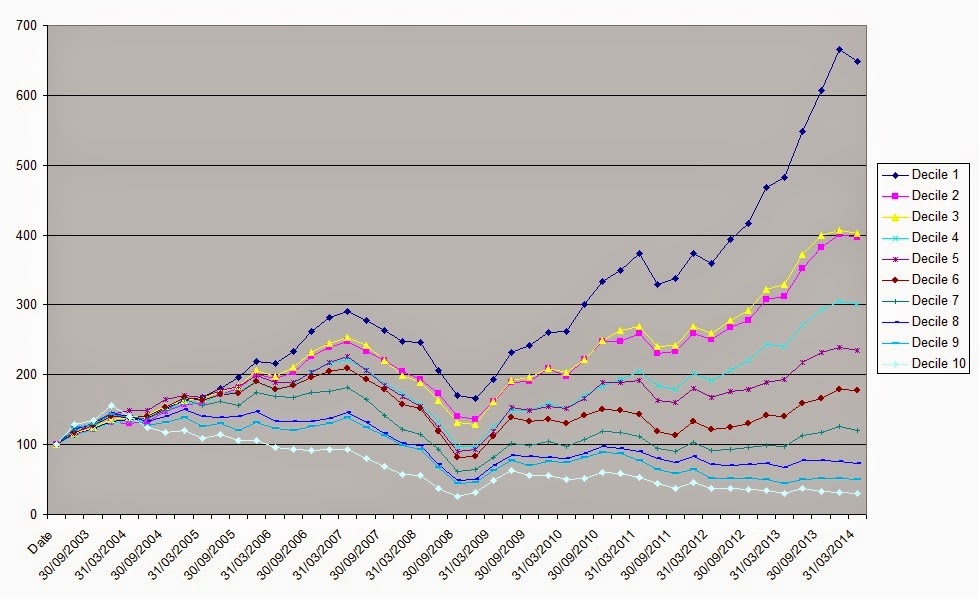
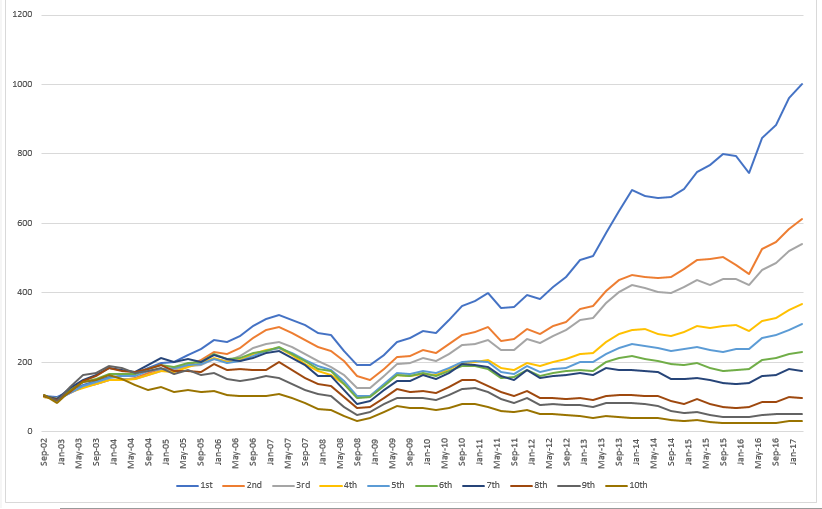
I am sure that I saw a chart at some point, that showed how shares performed, grouped by stockranks (SR 0-10, 11-20, 21-30, etc). However, I do not think this went across downturns and I do not recall where to find it.
Is such statistics available?


It is under Ranks -> Performance from the menu at the top, or follow this link:
http://www.stockopedia.com/stockranks/performance/
They only go back to 2013 when the Stockrank system started though.