Stockopedia provides a comprehensive screening capability with hundreds of different ratios that can be combined to select a set of stocks based on set of criteria.
But which ratios to use and how do they all interact?
When you create a custom screen on Stockopedia you have about 100 different ratios to choose from. But unless you are careful you can fill your screen up with conflicting patterns or get overwhelmed by the difference between similar ratios like ROE versus ROCE or FCF versus OCF.
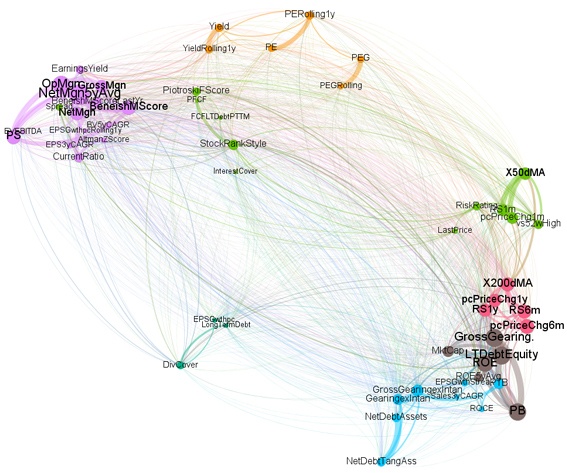
I used a technique called Principal Component Analysis (PCA) to try to understand better how all the ratios interact. The idea with PCA is to look for some underlying set of factors which are independent of each other, and then express the observed variables as combinations of those underlying factors. The resulting PCA elements are said to form an orthogonal basis.
This analysis does not tell us which ratios are the most important for making money over any given time period. It merely attempts to tell us which ratios are similar to others and which are orthogonal to others and so give us a different perspective. How we interpret what each ratio tells us depends on the investing style we are pursuing - but ratios which are all measuring the same thing will only tell us that one thing.
I won't go into the details here, but the output consists of a matrix which shows how each of the original ratios can be decomposed into the five basis axes. For example, a biplot of the Momentum-Value pair looks like this:
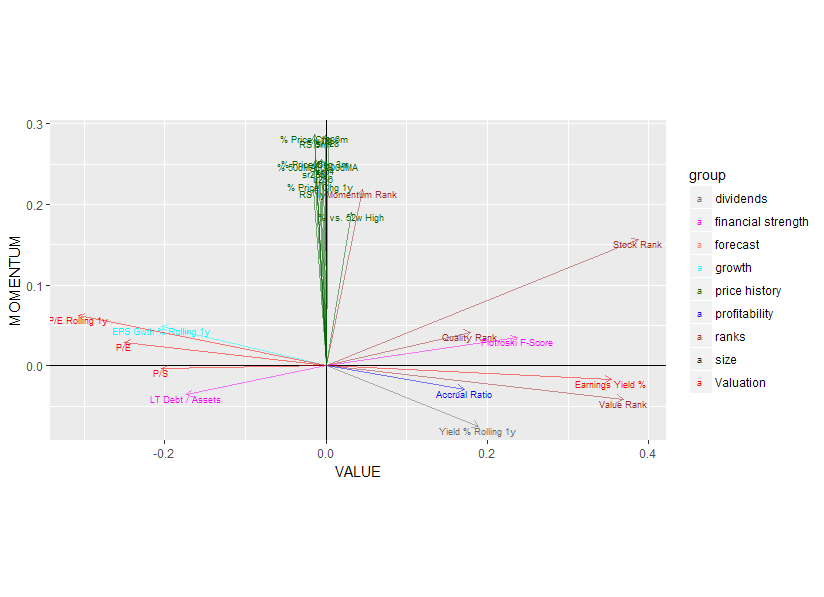
The five axes which emerge from this analysis broadly correspond with the Stockopedia groupings of Momentum, Value, Profitability, Volatility and Financial Strength — but with a few wrinkles worth noting.
It is interesting to note that almost all investing books which set out general principles tend to boil down to the same basic formula: "buy good quality stocks at reasonable prices." After that, defining what constitutes "good quality" and "reasonable" becomes the main focus for discussion. What emerges from the PCA analysis confirms this basic thesis.
Momentum
The ratios which most closely align with the Momentum axis include "% Price …