A recent question in another thread about how Q V M evolve over time prompted me to have another look. I have in the past played with 3D representations but it is probably easier to see using good old-fashioned plots.
So purely for interest here are the time evolutions of four stocks I have data for, each of which has a different experience over the last two and a half years.
In each plot, QVM are drawn in red/green/blue with the Stock Rank as a dotted magenta line. It is fairly clear that Momentum simply indicates how well the stock price has performed over the last six months. Its predictive value is limited.
OCN
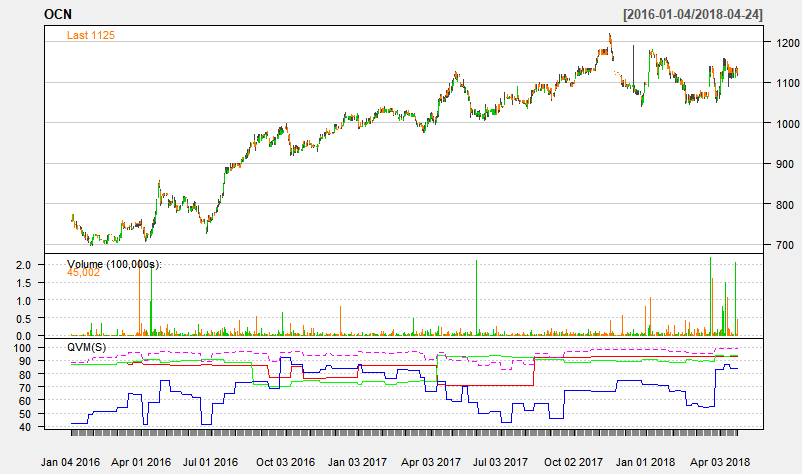
Ocean Wilsons Holdings (LON:OCN) is a perennially cheap, high quality stock with modest but consistent price growth over the period. it is currently a "super stock" but it looks like it drifts into "contrarian" (high QV low M).
Is OCN really cheap, or is it just an artefact of the way it accounts or the type of business it is in? I ask this because all "Super" stocks are really contradictions. Why would a high Quality high Momentum stock also be cheap? There is usually a reason which amounts to "it isn't cheap in the sense of a 'bargain'."
BOO
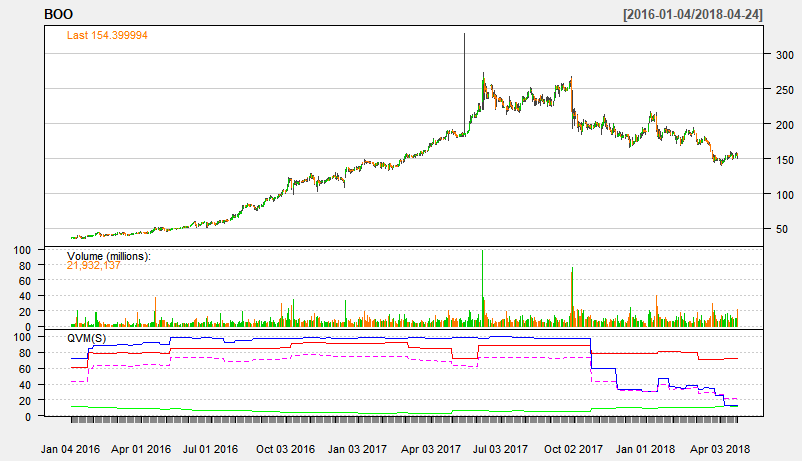
Boohoo.Com (LON:BOO) had a meteoric rise in 2016-2017. It has been consistently high Quality but expensive. As a result, when a set-back occurred in October 2017 the Momentum fell dramatically converting it from a High Flyer into a Falling Star. Even so the return in two and a bit years is still 3x.
G4M
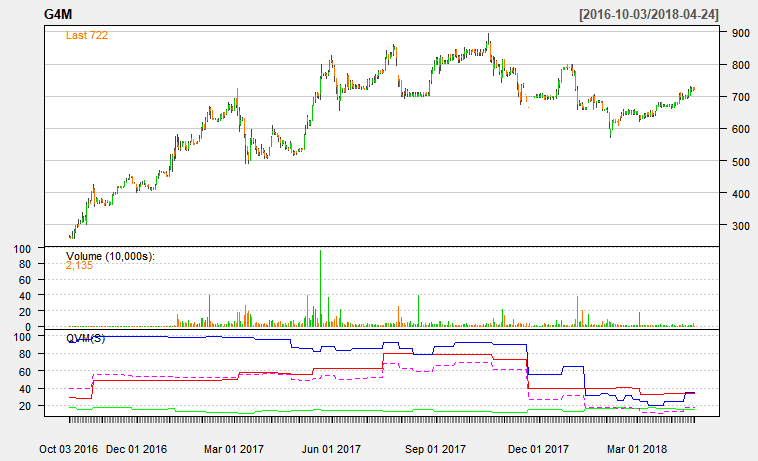
G4M has always been expensive with a lower Quality Rank than BOO although there is a rising Q during 2017. Stockopedia currently rates G4M as a Sucker Stock. But it is clear to see that its fortunes changed in about December 2017 and the price has held up reasonably well. Unlike most Sucker Stocks G4M has positive earnings so the label is perhaps a bit harsh.
TRI
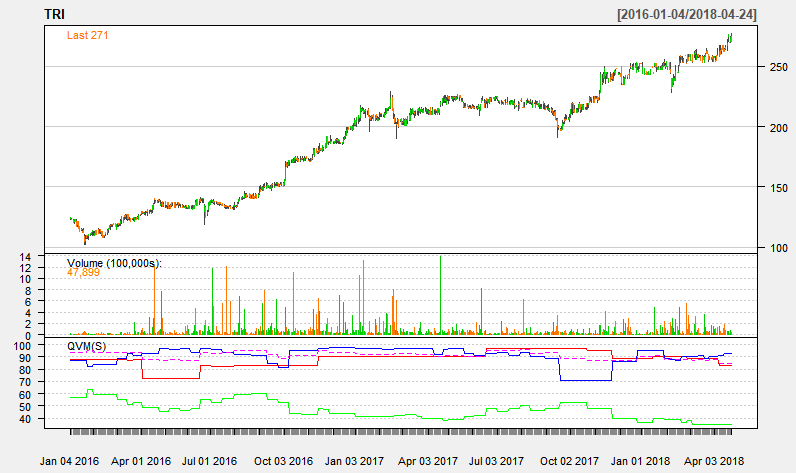
Trifast (LON:TRI) is rated a High Flyer and its Q V M evolution has been remarkably consistent over the last two and half years. The Value Rank has…