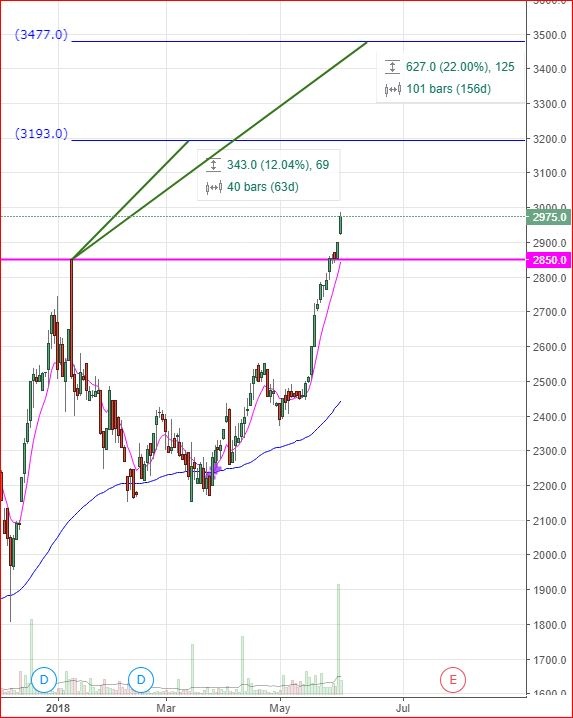
Price targets @3193 and 3477 with a close above 3193
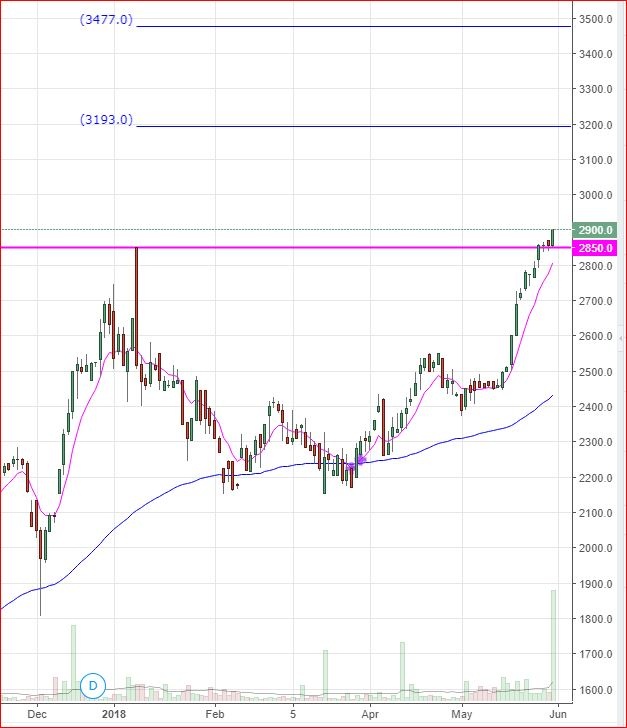
Price targets @3193 and 3477 with a close above 3193


Hi Taff6.
Yes I agree that it's looking good. Please can you explain how the two high horizontal lines are calculated & what they mean?
Hi Warranstar
Basically the two overhead horizontal lines are price targets and calculated as follows
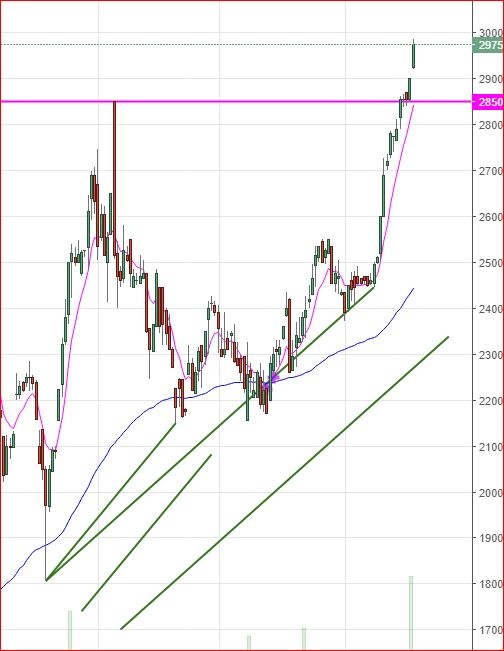
Draw a trend line connecting two lows either side of the last high point. These lines are then cloned and projected onto the high point, effectively forming a price channel or channels in this case.
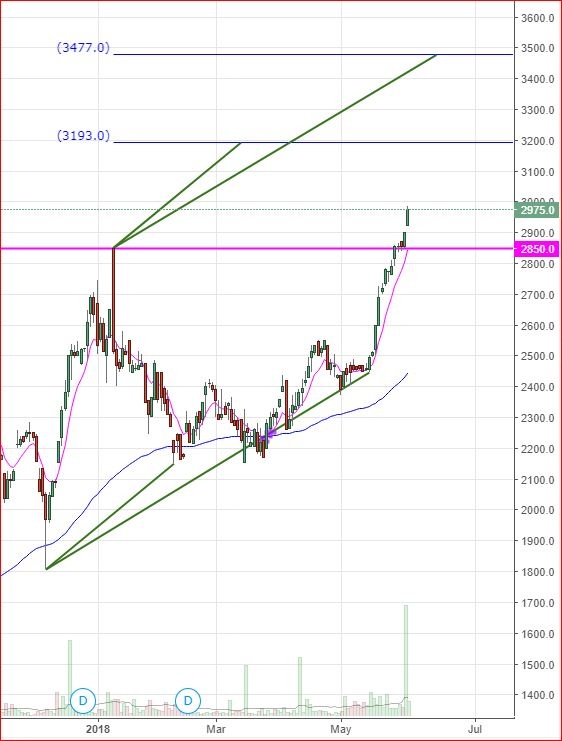
In each case, the upper channel terminates at a projected price target which can then be annotated onto the charts with horizontal lines as in the post. As the lines are initially connecting two lows in an uptrend the expectation is for price to arrive at the upper channel before the cloned line/s terminate, effectively giving us a time and momentum perspective. In the case of Games Workshop (LON:GAW) we can see that this has not been the case for the first price channel and the second is also struggling, signifying that momentum is slowing. I’ve added momentum indicator to the chart to illustrate my point for the purpose of this post.
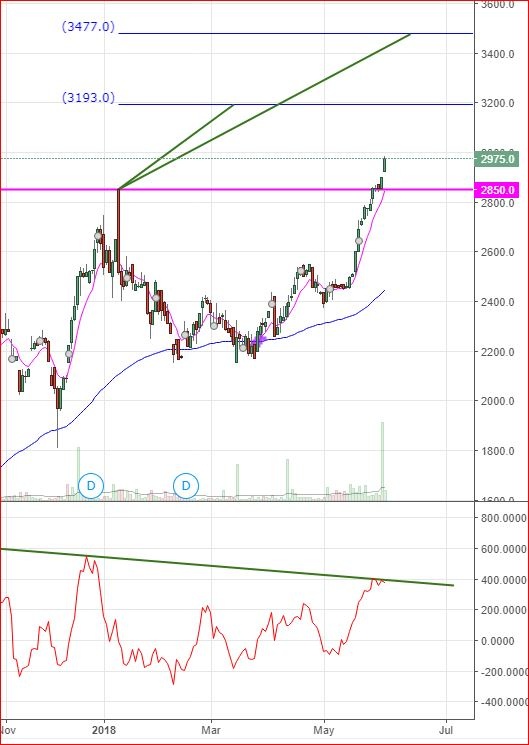
For this trend to continue look for developments to overcome the momentum divergence and send the momentum indicator to new highs. Examples would be improving fundamentals, positive news flow or in this case the new high on accelerating volume, however one must still be weary of the momentum divergence. Now that we have two overhead price targets in place we can use the projected levels to determine if a viable trade is offered, determined on a risk reward and position size basis.
We can see that the projections offer profit targets of 12 and 22% from the old high respectively.

I see Alliance News has stated that GAW is reducing its annual dividend from 74p to 30p, as per
http://www.lse.co.uk/AllNews.asp?code=7u60zhbd&headline=Games_Workshop_Expects_Revenue_And_Profit_Up_But_Cuts_Annual_Dividend
This is also quoted in a link on ADVFN.
Extremely ignorant as this year, 4 dividends are being paid totalling £1.30, as per
- 35p, announced 05-Sep-17
- 30p, announced 13-Dec-17
- 35p, announced 05-Feb-18
- 30p, announced today

Yes they should get their facts right, is this why the shares have gone down nearly 5% today? The trading statement looks good to me.
FYI, I e-mailed Evelina Grecenko at Alliance News who apologised for her mistake and Alliance News have very quickly issued a correction.

Unless I'm missing something I thought it looked like a slowdown in business:
Revenue Trend:
H1 2017: £71m
H2 2017: £87m
H1 2018: £109m
H2 2018: £110m
PBT:
H1 2017: £14m
H2 2017: £25m
H1 2018: £39m
H2 2018: £35m
Given the H2 weighting (to include xmas), it looks like H1 was quite exceptional.
Still a fantastically cash generative business and who's to say that revenue won't pick up again next year, but if growth doesn't continue the £1bn valuation is looking quite toppy for a mature company making £75m per year
It may be that H2 captures the staff bonus of £5m (plus National Insurance) and H1 doesn't - so the profit drop off in H2 is explained by that.
Yes you could be right but these are only estimates at the moment they could exceed those figures. I was looking more at the forecasts which these figures appear to beat. Yes H1 does look exceptional.
Good point about the bonus by shipoffools.
One would hope that they would be accruing for the bonus during the year.
Another thing I just realised is that this is also 53 vs 52 weeks.
I see the price slowly creeping up now...
Abtan - looking at the H1 accounts - it looks like they don't accrue the bonuses in the first half (this year and last year).
This would make sense if the bonuses are tied to annual profits.
I haven't looked at the H1 accounts in such detail, but back in the day when I was the guy doing the management accounts we accrued (conservatively) for bonuses throughout the year.
I would expect Games Workshop (LON:GAW) to be doing the same so it's a worry that they don't.
Last year - it was described as a "discretionary payment to employees", so looks like it's a decision made in H2 - so I don't think it's something to worry about.
I thought it was interesting that the bonus was applied equally to all staff, most companies the BoDs take the lion's share.
I thought it was interesting that the bonus was applied equally to all staff, most companies the BoDs take the lion's share.
I thought that was a smart move in a company moving to shops with one worker - they can really influence performance and the payment recognises the significance and hopefully aligns them with company. £5 million pool will hopefully be a profitable investment
OMG, arrived home from work and Games Workshop (LON:GAW) looks like a grenades gone off in the kitchen sink.
Great work by all you forensic Scientists (FA) and news hunters out there today, thanks.
I hadn’t planned to do another update on Games Workshop (LON:GAW), however since people are posting on the thread here goes for anyone interested.
I’m going to look back at Games Workshop (LON:GAW) chart and in particular volatility and volume to see if they offer any clues as to the future direction of price, so here goes
Firstly I’ve added the Average True Range Indicator set to a period of one to identify days of high volatility where price spiked by more than 250(P) as it did today. As it happens what we identify is swing highs and lows. The swing highs are annotated with red down arrows and the swing lows are annotated with Blue upward arrows, so three swing highs and two swing lows. Thereafter I identify high volume days of which there are 3 annotated with green down arrows.
Each time a high volume day is identified price rises for a number of days until a high volatility day is recorded (red down arrow). On the first occasion the high volume and high volatility day occur simultaneously, nevertheless price drifts slightly higher for a number of days. On each occasion price then goes through a corrective phase and a clear AB=CD pattern can be observed!
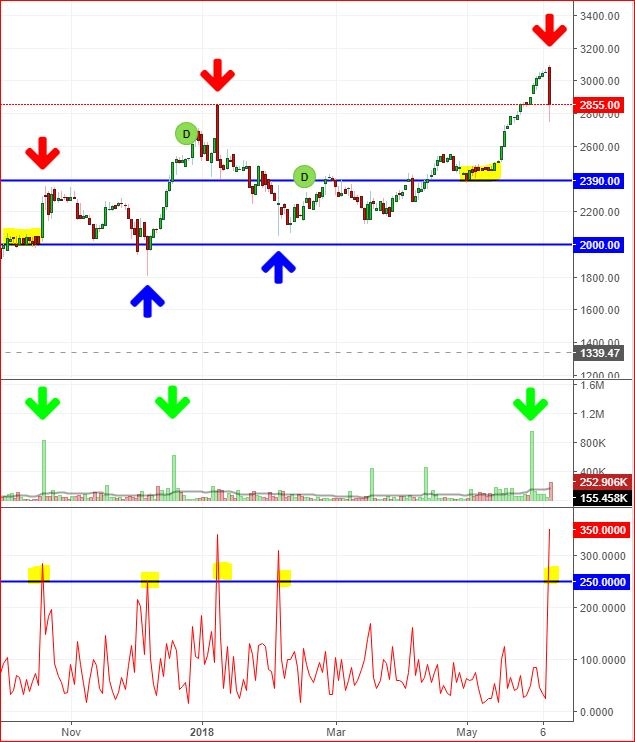
Looking at the weekly chart the corrective periods have previously lasted 7 & 4 weeks with price falling 23.3 & 28.07% respectively.
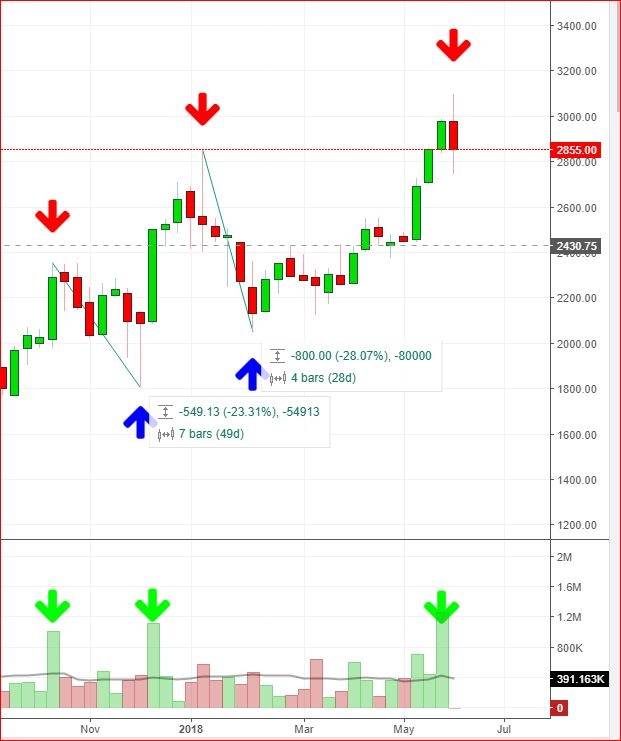
What about this time. First of all, if another correction is to materialise, price will need to close below this week’s low (2745) on a daily basis. From there we can look for a corrective AB=CD pattern to materialise. A daily close above 2950 also negates this analysis. Currently it is too early to draw any firm conclusion, if history repeats itself this may yet prove to be a good buying opportunity, however...

Or:
| 1 year drift | μ = 94% | ||||||
| 1 year volatility | σ = 37% | ||||||
| Sharpe Ratio (target return 25% pa) | (μ-r)/σ = 1.8 |
With a yearly volatility of 37% you would expect a daily price movement of 5% or more about once every 20 working days (or roughly once a month). This seems to be confirmed by Taff6's graph.
By the way this is a very high Sharpe Ratio for a stock of this size and quality. (The closest stocks of similar quality, market cap and Sharpe Ratio that I can find are Macfarlane (LON:MACF) and LoopUp (LON:LOOP) )


