I once observed two people facing the wrong way in one of those wave pools - it didn’t end well for them.
What looked like a pleasant chat was interrupted by an artificial tsunami. They resurfaced after a second or two, coughing and spluttering, alive but very wet.
Looking at the year-to-date performance of Stockopedia’s 60 or so Guru Screens, I’m beginning to see how they must have felt - because the screens look as if they have just been dunked as well. Don’t read that wrong, there have been some big winners - but there have been some losers, too, and it is the sheer range of performance that hints at the volatility in the markets over the past year.
To recap briefly on our Guru Screens: we have been running these strategies (inspired by some of the world’s most highly regarded investors) since late 2011. We rebalance the screens quarterly to prevent these portfolios drifting from their stated strategies and we do not include transaction costs or dividend payments. It is important to bear the former in mind when looking at the performance of screens that tend to focus on small and/or micro-cap stocks, where spreads become more of a factor.
The second half of 2018 acted as a sort of equaliser. It interrupted trends and disrupted conversations. It was a bit of a reset.
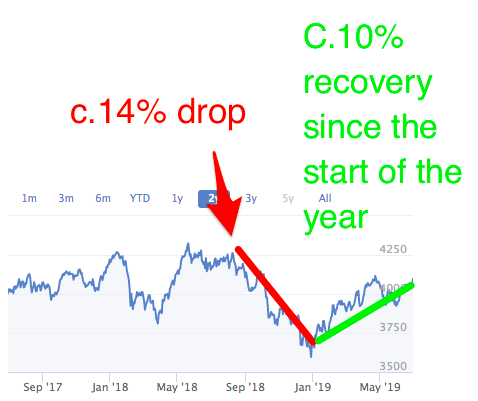
Most of us have long since dried ourselves off and forgotten about the stock market slide with a sort of defensive amnesia, as is our wont. But halfway through 2019, the influence of H2 2018 can still be felt. The stock market narrative continues to be one of recovery.
A quick look at the FTSE All-Share chart confirms that, yes, we did get drenched a couple of months ago:
How the guru strategies performed
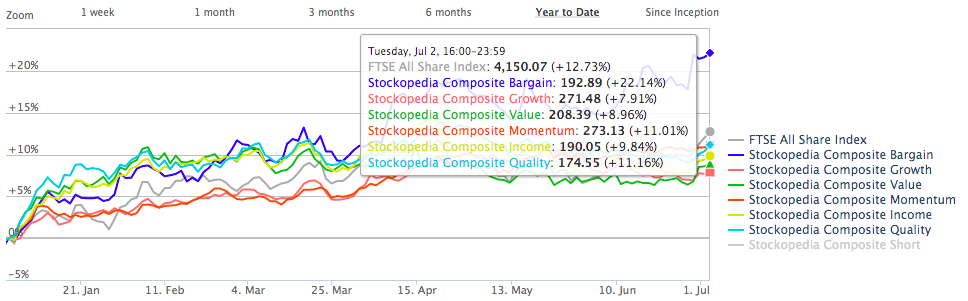
The rate of recovery has varied across our Guru Screens. Here is how they have performed so far this year.
Index / Strategy Composite | Performance H1 2019 |
FTSE 100 | +13.16% |
FTSE 250 | +12.69% |
AIM 100 | +8.21% |
FTSE All Share | +12.73% |
Bargain Composite | +22.14% |
Guru Strategy Composite | +11.84% |
Quality Composite | +11.16% |
Momentum Composite | +11.01% |
Income Composite | +9.84% |
Value Composite | +8.96% |
Growth Composite | +7.91% |
Key observations
The Bargain Composite is a clear outlier in the table above. When we dig into this category of Guru Screens, we can see quite a broad spread across strategies. All of these bargain strategies have generated positive returns so…

.jpg)