High Returns from Low Risk - Van Vliet - a book review and recommendation

One of Europe’s most influential fund managers has just written a fabulous little book titled “High Returns from Low Risk - a remarkable stock market paradox”. I don’t recommend many books, but I think there are a lot of investors that could learn from this. It’s barely 140 pages long, and in spite of a dose of marketing towards the end, it’s a great addition to any stock market investor’s library.
The book is written by academic turned fund manager Pim Van Vliet and his colleague Jan de Koning. Both work at the Dutch fund management group Robeco, which has become well known for its factor investing funds. While Van Vliet will take the plaudits for the book, it’s clear that De Koning has had a huge hand in making his ideas accessible and should take a lot of credit. It’s no mean feat to make tricky financial concepts easily understandable, and I think they’ve nailed it.

I’ve been reading Van Vliet’s academic research on Low Risk investing for years. In fact, his work was one of the biggest influences on our design of the RiskRatings recently launched on the Stockopedia website for more than 40,000 stocks worldwide. For those that know nothing about Low Risk investing and want a quick primer do read my previous blog on the topic.
The Tortoise & The Hare
In a nutshell, most investors believe that to achieve higher returns you need to take on higher risk. In fact, this is now so taken for granted that you’ll find risk vs return ‘sliders’ on practically all robo-advisory websites. Here’s what you’ll find on Nutmeg:
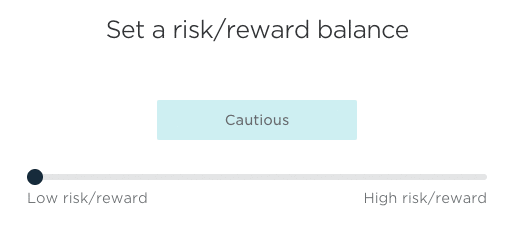
The message from the industry is… no risk / no return !
Van Vliet illustrates clearly with more than 86 year’s of stock market data that this is nonsense. Within the stock market universe, low risk stocks outperform high risk stocks dramatically over the long term.
They don’t do it every year. In fact high risk shares do outperform in bull markets. But low risk shares outperform to such an extent in bear markets and sideways markets that their overall ‘full cycle’ performance smashes that of high risk shares.
Van Vliet shows that from a universe of the 1000 largest US stocks, buying the 100 lowest volatility (lowest risk) stocks and rebalancing the portfolio quarterly returned 10.2% annually versus 6.4% for the highest volatility stocks. This becomes quite a difference in portfolio size over the decades.
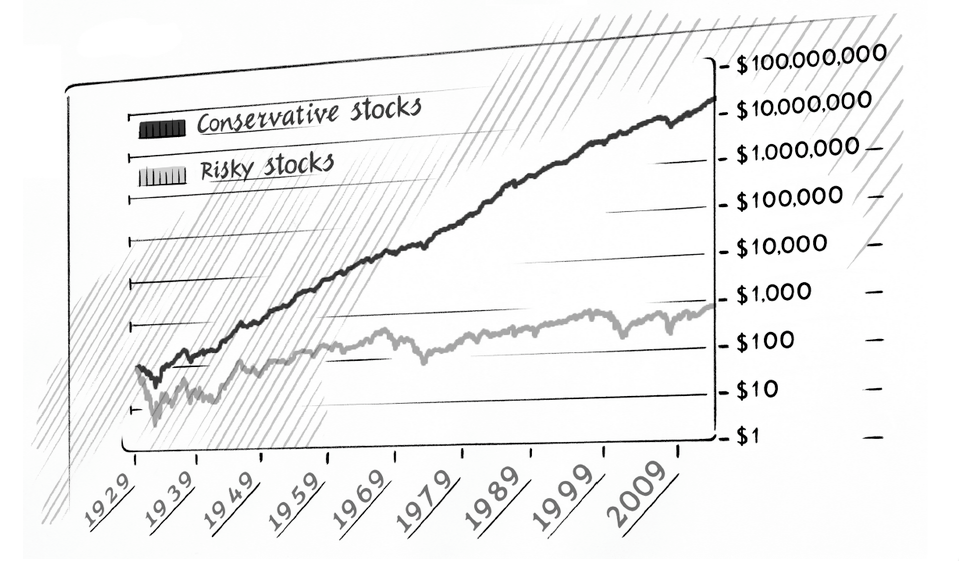
Van Vliet illustrates with the analogy of the Tortoise and the Hare. The high risk Hare keeps taking a nap while the Tortoise takes the line honours.
This message is particularly worth stressing right now as we’re entering a very speculative phase for the stock market. High risk shares have been going gangbusters but the party won’t last forever. Holding conservative shares at the core of a portfolio makes a lot of sense - it might help minimise any downside.
Our own RiskRating performance history (while not spanning 86 years) adds further third party evidence to Van Vliet’s low risk thesis.

Amping up Low Risk Returns with Income & Momentum
Of course, like all good quants, Van Vliet isn’t satisfied with 10.2% per year. He wants more. And this is where it gets more interesting, and where Van Vliet mirrors some more of the work we do at Stockopedia. He goes multi-factor.
- First up, he takes the 1000 largest US stocks and ranks them by volatility. He then discards the 50% highest risk (highest volatility) from the set.
- He then ranks the remaining stocks simultaneously for the size of their Dividend Yield (income), and the performance of their 1 year share prices (momentum).
- He buys the top ranked 100.
With this more advanced strategy he amps up the returns to 15% annualised over 86 years. And during these 86 years there isn’t a single decade that sees losses. Quite impressive. The key message is that using Momentum, as well as Low Risk, in portfolio construction ensures that there is enough participation in bull markets, as well as downside protection in bear markets.
Portfolios for Private Investors
Van Vliet is a fund manager, but he makes it clear that private investors are often best placed to profit from the low risk anomaly directly. I quote:
When I started developing this strategy, I actually thought it would be of most interest to clients managing their own portfolios. People like my father, who have never looked at benchmarks, but who care about increasing and protecting their capital.
He then dedicates an entire chapter to illustrating how private investors can find low risk stocks using a stock screener. Stockopedia is one of the sites recommended by Van Vliet on the website that accompanies the book so I thought I’d illustrate how you can implement his strategy using the screener here.
Van Vliet prefers to use Total Volatility than Beta for finding low risk shares. We’ve our own “% 1y Volatility” measure in the screener which is an annualised measure of the last three years of price history for every stock in our coverage.
But we’ve also turned this measure into the RiskRatings - an even easier filter. By filtering for “Conservative” and “Balanced” shares you can keep the 75% riskiest shares in the market out of your results.
In this screen - High Returns from Low Risk - Van Vliet - I’ve added filters as recommended for higher yield shares (yield > 3%) and higher momentum shares by their 1 year price strength as well as keeping the PE below 30 and removing collective investments. I’ve lowered his market cap cutoff to £500m to ensure more results.
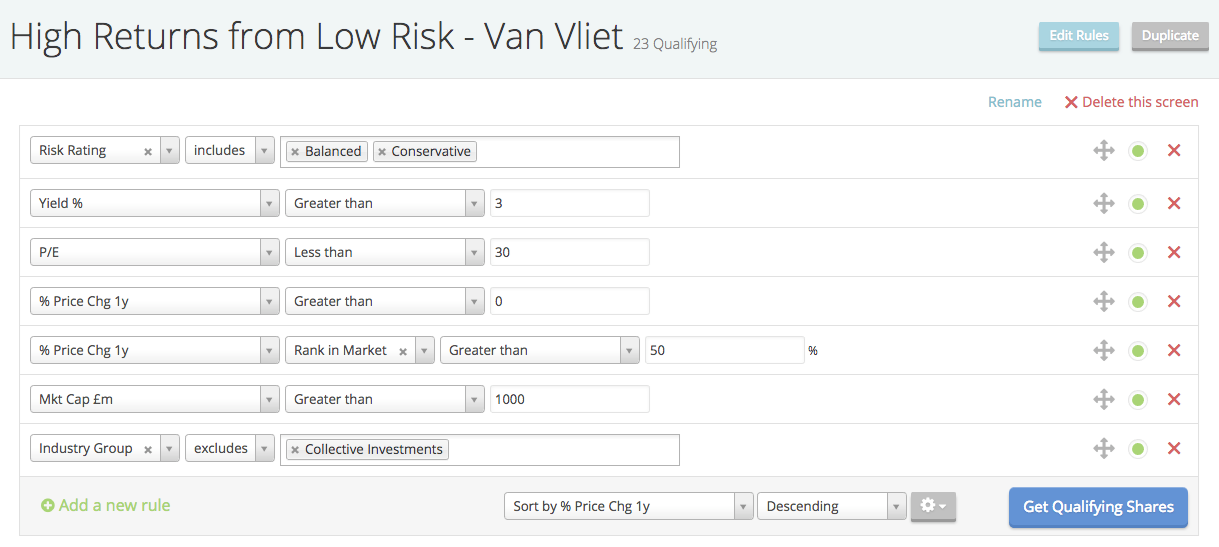
For these rules there are 31 stocks that qualify in the UK, 78 in the US, 61 in Australia, 131 in Asia and 137 across Europe. The UK results do seem to be quite skewed towards financials, and I find much better average StockRanks for the shares listed in other markets. For Low Risk Investing taking a global approach can really help and ensuring sector diversification is key.
You can duplicate the screen and create your own by clicking this link.
To Conclude
There is much to like in Van Vliets book - his message is clear. Win by not losing. It’s a patient approach that most investors would be wise to put in practice, but which I’m sure most will ignore. The reality is that investors just can’t help themselves and end up losing money in the risky end of the market !
Hardcore data-driven investors may be disappointed that there are no appendices providing more detail into the parameters that created his results, but to give the authors credit they have created a website that offers a big Excel table for download here.
There are very few stock market investment books written in plain English for the layman. And of those that are, there are only a few worth reading. Wiley seems to have a knack for publishing these easy, informative reads. It’s a worthy addition to any stock picker’s library and one of few good reads on the Low Risk Anomaly. You can find it on Amazon here.
Disclaimer
This is not financial advice. Our content is intended to be used and must be used for information and education purposes only. Please read our disclaimer and terms and conditions to understand our obligations.

32 comments
I have been listening to this as an audio book again recently. It really is excellent - I was wondering if there is a low volatility, high income and improving momentum ETF that mimics Van Vliet's approach? The problem with not doing this via a fund - is that Van Vliet recommends a basket of ideally 100-150 shares - this gets very expensive unless you have a massive portfolio. Which I don't.
Is it possible to screen the ETFs on Stockopaedia? I have been unable to work out how if so.
Thanks again Ed for the reminder about this book - one of the great, largely ignored paradoxes.
Ed , more recomendations on books please.Cant get enough of them
I have worked my through 8 of the guru screeen books and just ordered the Van Vliet book. (+ another screen , william o neil book from the states coming) Amazing , by reading I am definately improving at investing. Wonderful. My Favourite so far is the contrarian David Dreman book... I will need to build a library soon
brilliant book its a must read.
Now that I have read the book I wasn't so impressed. It seems to me he is advocating a QMV approach where volatility is used as the only real quality filter.
I get the attraction of low volatility and I much prefer a nice steady line upwards on the price chart to one that jerks around but it's not sufficient for me. I think there is much more rich and useful data embedded in the Stockopedia rankings system.
Thanks for a good review of an excellent book. One observation I would like to make is that the book did not place quite enough focus on the fact that the screening process is a multi stage one and can't really be done by simply entering all the criteria into a screener and pressing go.
Van Vliet advises to rank the stocks then buy the first 100. Please correct me if I am wrong, but isn't he saying to rank them on the sum of their scores in the income and momentum fields after first discarding those with the highest volatility?
To do this we first need to identify our low volatility universe then rank all candidates on each of the two criteria then add the two rankings together to give another score. Once we have this combined score we can sort the stocks from best to worst using Excel or something and then buy the top 100 to top 20 or whatever.
If there is a way to have Stockopedia or Google do this for me, to avoid a tiresome export to a spreadsheet, then I would appreciate some instruction on how to make it happen.
PGW
It is a lot like favourite-longshot bias. In theory if horses were priced accurately it would not matter whether you bet on favourites or longshots. They would all approximately return your stake back minus the bookies profit over the long term.
But in practice, favourites win slightly more often than they should given their price and longshots win slightly less often than they should. So not only are the favourites a lower volatility bet, but they have a better return as well.
Humans seem to prefer taking a higher risk of a bigger return and will pay for the privilege of the excitement that it gives them.
I think it is similar with stocks. In theory the return/volatility ratio should stay the same and you can use leverage to decide where you want to be on the line. But in practice higher volatility stocks do not return as much as they should according to theory. Those who seek the excitement of volatility are apparently prepared to pay for it (not necessarily intentionally!)
Ed and all, There really is no paradox that low risk outperforms. It is only due to our psychological biases we think there is a paradox. For stocks to grow value over the long-term it is a necessary condition that they can retain value over the long-term. Low risk stocks are not exposed to risk factors that can stop them from retaining value. They are therefore able to compound value whereas stocks exposed to meaningful risk factors are not.
We have a psychological belief that high risk stocks should outperform to compensate for the risk. But if you think it through this makes no sense. We also see some high risk stocks perform fantastically well. This generates a survivorship bias in terms of how we think of high risk stocks i.e. we tend to ignore or forget the myriad of high risk stocks that have failed. When we observe the fantastic returns from a high risk stock that has succeeded we assume that to get fantastic returns we need to look towards high risk stocks.
Thanks for the book recommendation I'll have a look. Not sure it says anything new but it could be good. It certainly looks like it is written in plain English which is unusual.
I assume the book uses volatility as a risk proxy which can work to some extent. However, the real drivers of risk are fundamental risk factors which change over time and need to be assessed. The banking sector, for example, may not have been volatile leading up to 2007.
A final point is that almost everyone is into factor investing these days. The reality is that it is generally not a good way to invest. What determines a company's worth in the long-term is the fundamental compounding power of the business. Whether it is small cap, low volatility and other factors only offer statistical insights.
As an aside once I saw John Ruffer present once and he dismissed the idea that fund managers should avoid risk. He stated that he was risk seeking and would try to find offsetting risk. I.e. a Japanese stock and a UK stock with different risk profiles. I think he got this wrong as fund managers should avoid risk given that it will hurt long-term returns and the compounding ability of individual holdings.
Ed thanks for this fascinating article.
Reading your review has left me thinking about
1. The short to medium term application of different investment approaches
2. Whether there will come a time when the development of such rules (based on the best ideas of investors and academics) will be replaced by machine learning
1. Timing the use of different investment approaches
When I started investing I tried to follow a Buffett "buy good shares and hold for life" approach. However the current bull run in growth stocks has seduced me into changing my approach. BOO, ACSO, BVXP, BUR, FEVR, PURP et al. have all been doing so well over the last few months that I am up 19% year to date. But the problem with following the current fad is the need to switch out of it when the mood changes. I have been top slicing to minimise the risks of a sharp correction and coping with my disappointment at all the missed profits as the top sliced shares keep powering on up. But at some point this bull market will stall or crash. And when that happens the Van Vleet approach sounds like an ideal approach into which to switch.
Will you be adding Pim van Vleet to your list of gurus, so that it is easy to find this screen?
2. Guru based investement approaches vs. machine learning
A much more long term concern of mine is the increasing prevalence of machine learning systems. A good introduction to this is the FT interview with Demis Hassabis (21 April 2017). The key difference between traditional AI and machine learning systems is that:
* AI systems apply rules based on the best human understanding of what works - e.g. the Stockopedia screens and ranks
* machine learning feels all the data and all the results into the computer and let's the computed identify patterns and rules and then keep improving on those rules as more data are collected
If machine learning can create a computer that can beat the best Go Player in the world (where traditional AI had failed), how long will it be before it will also start to produce systems that can read the stock market, pick stocks and maybe even time the market better than any of the gurus and therefore any of our guru derived systems. The risk of course is that these systems (requiring high levels of computing power and large quantities of data) will be available only to the rich. The hedge funds and high worth individuals who can afford access to these systems will again have an advantage. And that would be a real shame given how well Stockopedia has democratised investing, making it possible for the ordinary private investor to compete on equal terms with the well funded hedge funds.
Have you thought about incorporating a machine learning approach to investing in a future upgrade to Stockopedia?
With lots of appreciation for all the great things Stockopedia has done
Ed, you wrote:
"True, but I'm also mindful that he restricted his universe to the biggest 1000 stocks in the USA. I don't have the exact cutoff, but I reckon his universe of stocks includes half our 'mid caps'. Balanced + Conservative (from the chart below) aren't too far off 50% of this universe."
OK, that makes sense to me.
Hi Ed, Thanks for your interesting and useful article. I've already read the book, following a recommendation on Stockopedia. I think your article is an excellent summary of the book's conclusions.
Another approach one could use to construct portfolios is to select high StockRank shares or follow Ed's 'Nap' rules, but exclude any shares that do not have Risk Ratings of Conservative or Balanced. This would lead to a lowering of the average StockRank of the portfolios (unless one accepted having fewer stocks in the portfolios, which would of course increase the stock-specific risks of the portfolios), but it might lead to better performance over the long-term than the corresponding portfolios that include stocks with any Risk Rating.
Pka - personally I think just focusing on Conservative / Balanced may leave some return on the table.
There's evidence that it's ok to reach for a bit more risk in higher ranking shares. Conservative + Balanced is only 25% of the market after all. Van Vliet actually reduced his large cap universe to the least risky 50% before adding momentum + income filters.
If you review the recent webinar I did, the best performing Risk+Style segment to date has been Speculative High Flyers. It's been mostly an upwards trending market since 2013, so this may not persist through a downturn, but it will certainly be interesting to watch.
Ed, you wrote:
"Pka - personally I think just focusing on Conservative / Balanced may leave some return on the table.
There's evidence that it's ok to reach for a bit more risk in higher ranking shares. Conservative + Balanced is only 25% of the market after all. Van Vliet actually reduced his large cap universe to the least risky 50% before adding momentum + income filters."
If Conservative + Balanced are only 25% of the market, perhaps you should add 'Adventurous' stocks to your Van Vliet screen, otherwise you are not reproducing his original criteria closely enough.
True, but I'm also mindful that he restricted his universe to the biggest 1000 stocks in the USA. I don't have the exact cutoff, but I reckon his universe of stocks includes half our 'mid caps'. Balanced + Conservative (from the chart below) aren't too far off 50% of this universe.
Hi Ed.
Hopefully by the time you read this you're safe and sound and reasonably well recovered from your journey down to Paris. Thanks for the article and introduction to Van Vliet's book that was succinct and well written to the extent I sat and read it in one two hour sitting. Ironic that it takes two Dutchmen writing in a foreign language to communicate potentially complex ideas in such a clear manner. A few thoughts and comments on the book and your own clear follow up.
From your article, I got the sense that the VV's thesis is that there is a paradox in investing that there is a higher return to be made from a given portfolio of lower risk/volatility shares. I'd interpreted this as suggesting a "top left to bottom right" linear relationship (with return on the y axis and risk on the x axis) whereby lowest risk gives highest returns. However, if you look at the key empirical chart of the relationship on page 32, this shows it to be more of an "n" shape with best returns coming from the second lower quartile of risk at about the 20-22% volatility range before a sharp drop off when you get to the 9th and particularly 10th decile. Further it also suggests (to the naked eye) that there is not a huge difference between say the 20-80% range in the sample. I don't think this undermines his hypothesis but maybe suggests avoiding the volatility extremes (most Conservative and Highly Speculative) is the way to go.
The approach is to screen the whole stock universe for a less risky subset and then apply a second filter that combines V and M rankings to get a second filter to identify the best of the less risky safe stock subset. It may be that I missed him addressing the point on the first read through, but I wondered if there might be a different (better result) from picking the best V and M universe of stocks and then applying the risk/volatility filter to that, i.e. pick the most fertile looking stocks and then weed out those which don't clear the low volatility hurdle.
Although there is some discussion in the later chapters about the risk:reward paradox in other asset classes (e.g. fixed income, commodities etc.) and his view that the paradox of risk:return does seem to apply elsewhere, so far as I can tell the analysis is always done intra rather than inter asset class. He doesn't seem to address here whether, for example, the "best" low risk fixed income portfolios have historically out performed the best low risk equity portfolios. Possibly too broad a scope for someone only interested in shares but it would be of interest to someone looking at a wealth portfolio as a whole trying to determine if there is a sweet spot for asset allocation between different asset classes.
I note and agree with some of the comments made earlier in the thread about the use of "income" i.e. dividend per share as a measure of value. I think current dividend is perhaps not the best measure of current and future earnings potential and that some measure based on income/free cash flow per share or maybe PEG etc., might be a better filter to apply. Likewise, some element of Q screening such as adding an Altman Z2 or Beneish score might improve the gene pool too. Tying this back in to my second point above, I will probably try and apply VV's principles by optimising my target pool using my existing various QV and M based filters and then looking to pick out as a second order filter those in the two or three least risky categories.
Thanks again. All in all an excellent read and a useful addition to any investor's library.
Gus.
Gus - there are a variety of studies and a variety of results. Most find a fairly flat (or humped) relationship between risk and return, but with a severe drop off in the highest risk segment of the market.
What is almost universal across low volatility studies, is a sharp (and almost linear) decrease in risk-adjusted return from the lowest risk to the highest risk deciles. That's the key takeaway from the low volatility anomaly. A rational investor, rather than buying the higher risk decile, would borrow money to invest in the low risk decile and keep borrowing until the volatility of the holdings was the same as the higher risk/higher return decile. At the identical level of volatility, the low risk portfolio would significantly outperform.
Of course most investors are leverage-averse or have constraints, so they don't do this... but it is the rational thing to do if you are chasing return.
Ed - Interesting point regarding price volatility vs risk-adjusted return and leveraging a low price-volatility portfolio for best return. However, this doesn't consider the effect of leverage on tolerance of price volatility, due either to psychology or pragmatic considerations (e.g. margin calls, or the threat of them). That my portfolio is unleveraged, and I take a long-term view, is key to my tolerance to higher price volatility, especially for high-quality stocks. Under such circumstances, Buffett doesn't accept price volatility as a valid measure of risk.
Thanks for another useful and interesting article.
Regards,
Ed Miller
Of course the great irony about Warren Buffett is that he runs a highly leveraged low-beta (low vol) strategy. Most value investors are so disdainful of the use of volatility as 'risk'... but the reality is many of them align their investment processes with low volatility principles.
Read up on Buffett's low-vol + quality strategy here... http://www.econ.yale.edu/~af227/pdf/Buffett%27s%20Alpha%20-%20Frazzini,%20Kabiller%20and%20Pedersen.pdf
greater irony is the same research people kills the dividend part. Subsumed in Value (p/bv) & quality (growing dividends) and offering a fraction of the premium of said "value" & "quality".
Good to see the paper you attached - 'Buffett's Alpha' again. I wondered what you meant initially when you referred to Buffett as highly leveraged, but of course you were referring to his use of insurance float - good point.
I think Buffett would point out that low volatility was a by-product of investing in companies that are both very large (by necessity given the scale of funds invested) and high-quality (to achieve superior long-term returns), as well as avoiding paying too much, rather than actually setting out to achieve low volatility to reduce portfolio risk. As you will be aware, Buffett put it this way: "The estimate of risk has nothing to do with volatility. It is based on the certainty that the individual stocks will, over time, produce a profit." [See 'The Essays of Warren Buffett by Lawrence A. Cunningham] Maike Currie, Personal Finance Specialist at Fidelity Worldwide Investment added: "Don't confuse risk and volatility. Volatility, while painful, is not risk. If you're investing for the long term, fluctuating market sentiment along the way does not matter." [Thisismoney.co.uk, 17th Jan 2015]. I think this distinction between short- and long-term is crucial. I can understand the attraction to Quants of using price volatility to measure risk, and for short-term risk I think it is valid; but not a QV buy-and-hold portfolio over many years. I wonder whether a liabilities-to-profit ratio, perhaps in combination with net gearing and an earnings-stability measure (such as that used by Bill O'Neil) might provide a more successful measure of portfolio risk over long holding periods. The strategies of many successful small-cap growth investors suggests it might.
Regards,
Ed
Ed, of course you do hear these arguments a lot and Howard Marks has written dozens of pages about what risk is or is not. But there's no doubting that on average less risky companies are less volatile. It may be individual companies that matter to value investors, but it's averages that matter to quants.
Ican't perceive of a scenario where the lowest volatility set of companies in the market are the most risky. I can imagine individual assets that are low volatility being risky (e.g. Bernie Madoff's fund)... but averages will tend to iron extreme point examples out.
I do go into some more thought in the RiskRatings ebook, and there are some scatter plots showing the relationship of Volatility with Bankruptcy risk. It's funny, but nearly all modern models of bankruptcy risk include volatility as a measure of perceived market risk. So there's certainly something in it.
All good points, Ed. I'll take a look at the info behind your latest links - thanks. Howard Marks is never terse!
Really interesting feature Ed, thank you - will get the book to keep expanding my education, in what has become, I guess a sort of part time job - managing my pension investments. Perhaps it would be better to be less active, and make this less of a part time job! I guess my natural instinct has always been to have a foundation of solid dividend paying, high quality companies - often terribly boring ones without massive momentum under their wings from month to month, and then to put some icing on the cake and mix it up and take a good few punts on the high momentum - growth companies which can often be terribly expensive. Then I just keep running my winners, and pretty quickly cut the losers once I have lost 12% or so...hard to crystallise those losses, but I force myself. I have stopped using automatic stop losses though after being burnt badly - shaken out - at a sudden dip, which recovered in an hour. I prefer to do it manually now, but this is probably another topic for the boards! Loving this site and all the tools you afford us little private investors.
Joy - what a lovely post. I agree it's best to avoid automatic stop losses... I learnt the hard way too. We're developing some tools that will help set more appropriate (volatility adjusted) stop losses. I want them for myself but they'll always be a guide to me rather than absolute.
Regarding making it less of a part time job. I am of course biased but I will always adamantly bang the table for DIY investing. What drives me mad about most institutional funds is that they are increasingly designed for scale. Scale benefits the fund provider, not the private investor and scale reduces the opportunity set. As private investors we're much more nimble and can buy small positions easily in the market and benefit from opportunities that larger funds just can't access.
In my fork I have added a requirement that the Altman Z2 score be greater than 3 (in the safe zone) and the number of stocks qualifying drops from 31 to 12. Those that are left have higher Stock Ranks.
So some sort of quality filter added to the screened criteria makes sense to me.
"For these rules there are 31 stocks that qualify in the UK, 78 in the US, 61 in Australia, 131 in Asia and 137 across Europe........ For Low Risk Investing taking a global approach can really help and ensuring sector diversification is key"
This makes sense but in last few days have come across a situation where overseas stocks are not universally available through CREST (e.g. 'Equities held in local custody outwith Crest' or ADRs) as CDI's (CREST Depository Interest). This means that execution only platforms (e.g. A.J. Bell or Stocktrade-Alliance Trust) won't trade or hold them or if they do will charge a significant 'supplementary account charge' which is nearly 5 x the cost of the standard annual account charge! This may reduce the universe of available companies that can be traded or held or at best significantly increase the costs associated with doing so.
I am having the same issue with AJ Bell currently. Ateme and Xilam are the culprits at present.
Agreed, AJ Bell have a long list of supposedly available markets (most of Europe), but I can never get an online quote for any small caps.
I also have a share account and an ISA with IG. The range of markets is much more limited, but they seem to be much better in terms of what can be bought - I've bought Holland Colours NV and m-u-t AG no problem recently, both sub 100m market cap. Forex fee seems very reasonable as well, 0.3% I believe.
OTOH, they cover US, UK, Australia, Canada, Germany, Netherlands, Austria, Belgium & Ireland. Don't think US OTC stocks are available, but could be wrong. Really frustrating for me is the lack of France and Scandinavia, I'd welcome ideas on UK providers that give low cost online access to small caps in those markets.
I have opened an account with Saxo bank for this purpose, they purport to have access to a number of European markets. Irritatingly they do not seem to allow trading via SEAQ (AIM shares) so I'm having to resort to dual accounts ISA accounts.
The screen includes Renewi which on a Stock Rank of 22 and a description of Value Trap doesn't seem to fit. In fact it qualifies for the Altman Z score short selling screen.
I guess all screens are best viewed as a starting point for further research. I think I'll add a minimum Stock Rank filter to my version.
I'll get a copy of the book, if only to have a good argument with myself because my investment style is rather more aggressive.
One advantage the private investor has is that we can just sell up and sit in cash - we don't have to keep running a fund and own equities in a bear market.
That "Yield % > 3" rule is taking out a lot of good companies. I would be interested to know what the motivation for this rule is. It will tend to eliminate growth companies in favour of cash cows, so maybe that is the thinking.
I tried removing that rule but increasing the "%price chg 1yr" rank in market to 75% to compensate and found 20 stocks, but with some slightly more aggressive stocks such as JD Sports Fashion (LON:JD.) and Rentokil Initial (LON:RTO) .
Nick - it was one of the screening rules in the book.
"Income is an elegant value indicator as it favors companies that at least make profits.... Income always says something about management behaviour, as it signals that managers are good stewards cautiously managing the cash and profits of a company."
Would earnings yield rule not better capture this idea of "income"? Dividend yields are a function of tax rules so are not very comparable internationally...