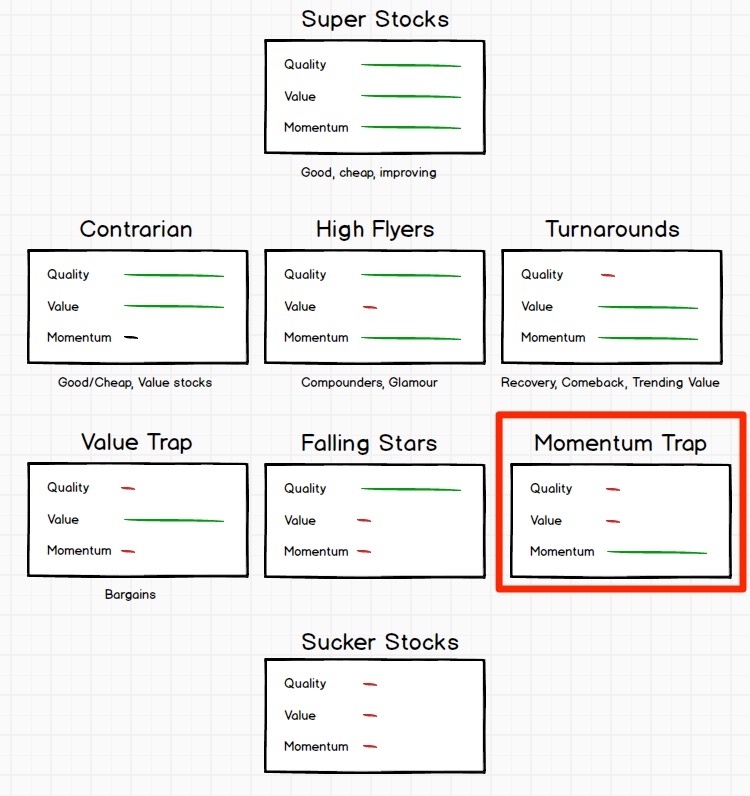
I kicked up a bit of a storm on Monday with an article titled “Why you think there are more high StockRank profit warnings than there really are”. Yes, this year has been tough for many investors in the stock market. There have lots of profit warnings, a few accounting scandals, Greek executives doing a runner, Chinese companies vaporising and seemingly most of the speculative & blue sky AIM stocks being ground to dust. As I pointed out in my article, while the prevalence and ferocity of the ‘bad news days’ tends to cloud our perceptions, it actually hasn’t really been that bad a year for sensible investors. There have been solid gains for the kinds of stocks we favour at Stockopedia - good, cheap, improving companies have (on average) done very well.
Understanding averages and probability is where many of us slip up. Ultimately the StockRanks are a stock selection system based on probability, and an understanding of probability is very useful to using them. So I thought I'd indulge in an investigation into 'hit rates' and basic probability.
A trip to the races ?
Most investors seem to treat the stock market a bit like going to the races. They find a horse (or a couple) they like the look of and put all their bets on them. Then they grip the side of their seats and hope their horses comes home. That’s really not the way to play the stock market - owning one or two stocks leads to binary outcomes - you’ll either win, or you’ll lose. The sensible way to play the stock market is to put the odds in your favour by using broad diversification while investing in higher probability stocks.
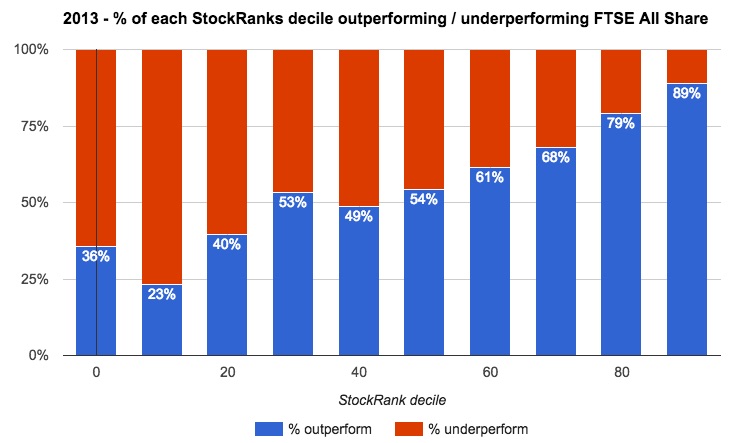
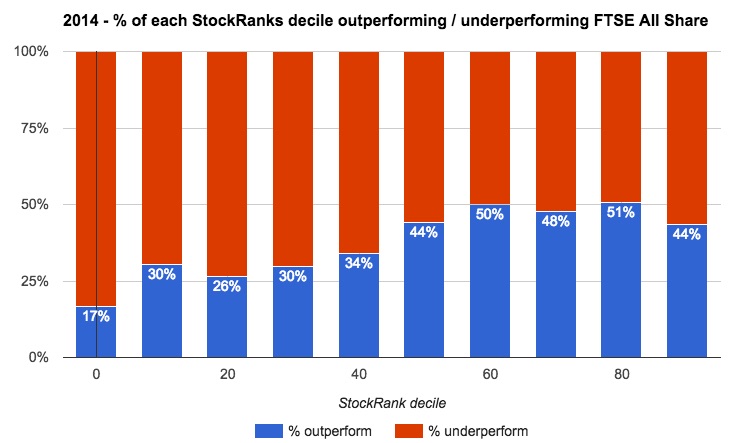
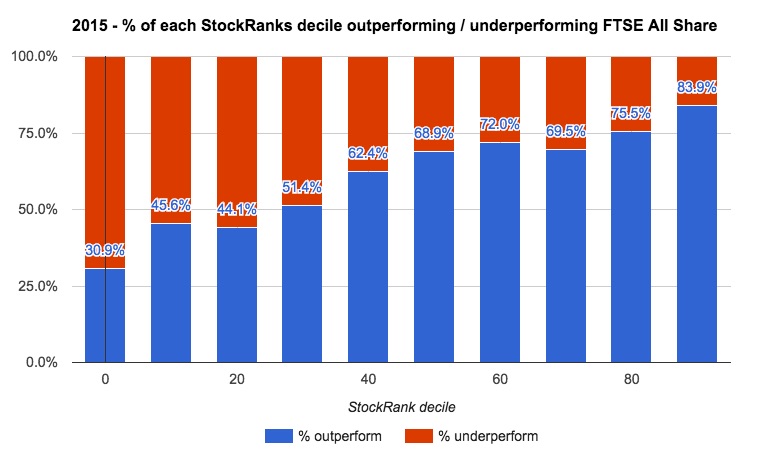
Here are 3 charts which show the percentage of stocks in each of of 10 StockRank deciles that either outperform (blue) or underperform (red) the FTSE All Share. For my own ease I’ve used annual periods to create these charts since the UK StockRank inception - from April 2013 to end March 2014, April 2014 to end March 2015, and April 2015 to today. (For benchmarking - the FTSE All Share was up 8% in the 2013 period, up 3% in the 2014 period, and has been down 9% in the latest 2015 period.)
Alternatively we can look…