Is the Stockopedia Community influencing the market?

A couple of weeks ago I received the following questions from one of our long term subscribers: “Now that Stockopedia is so successful, do you feel that you are influencing the market as a whole?” “Does the availability of high-grade information to private investors cause them to all move together under your guidance?“ “Are you increasing the volatility of the market?”
I hear these kinds of questions time and again, and until now I’d mostly disregarded them. We’ve always punched above our weight, but as a niche player our market impact was intuitively low.
But over the last 12 months our subscriber base has grown by more than a third, the readership of the blogs has grown to all time highs and the StockRanks have continued to perform stunningly well.
Given these facts, and the fact that I use the StockRanks myself as my core investment process, I feel some responsibility to answer these questions.
The Study
Part of the Stockopedia service is a suite of portfolio tracking tools. I would say that less than half of subscribers use them but they serve as a good proxy for the proportional weight of money moving into certain shares.
To help answer these questions for the community, I’ve aggregated the last 3 months of buy and sell transaction data from the portfolio systems.
I’ve limited the search to London Stock Exchange securities. While do have a growing army of international investors on the site, from Canada to Oz, as a UK founded site, the majority here are British.
I’ve also excluded some portfolios that are clearly marginal or erroneous. We do have quite a number of fund managers using the service, and their portfolios are normally £200m+ in value which skew the results. I also excluded all the outlier transactions which could have been entered by fat fingers. While the resulting data set is not perfect, it’s good enough to answer quite a few questions.
The Results
1/ Breadth
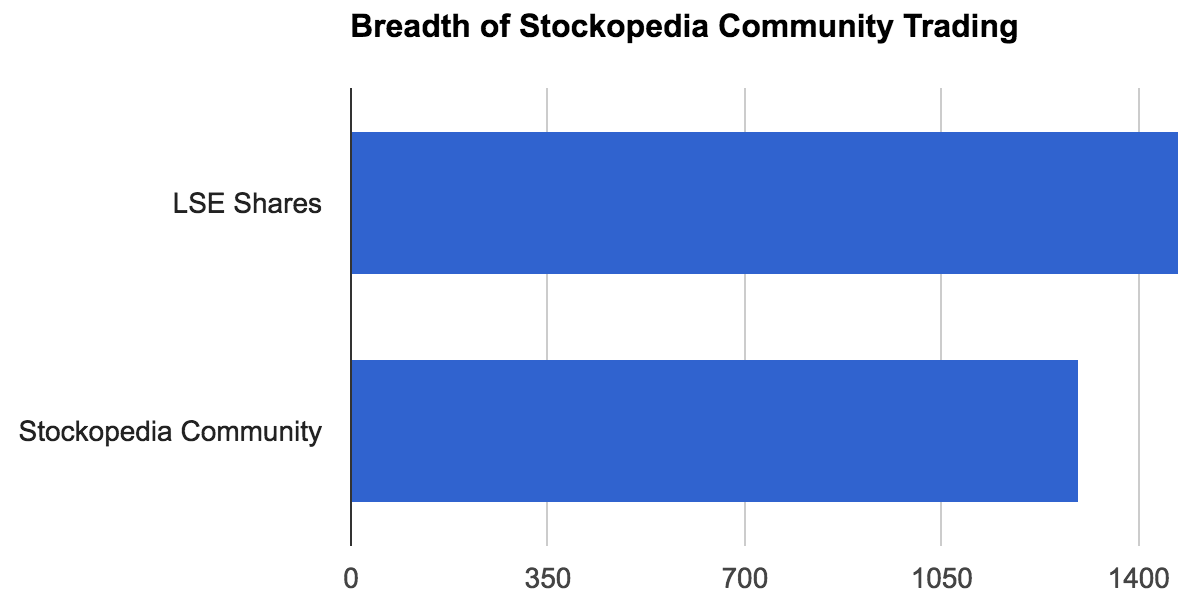
The first surprising result is quite how many different shares are traded by the community. If you exclude all collective investment vehicles, dual lists and other odd listings there are 1472 common shares on LSE. The community traded 1294 of them. That’s 88% of the market’s shares in a single quarter.
2/ Concentration
Of course there are hundreds of these shares that are barely traded at all. The chart below shows this clearly. The horizontal axis shows the number of trades logged in the quarter, while the vertical axis shows the number of different stocks traded that much. The large vertical bar on the left shows that more than half the stocks traded had less than 15 trades logged during the quarter. But there were also some names that were traded hugely.
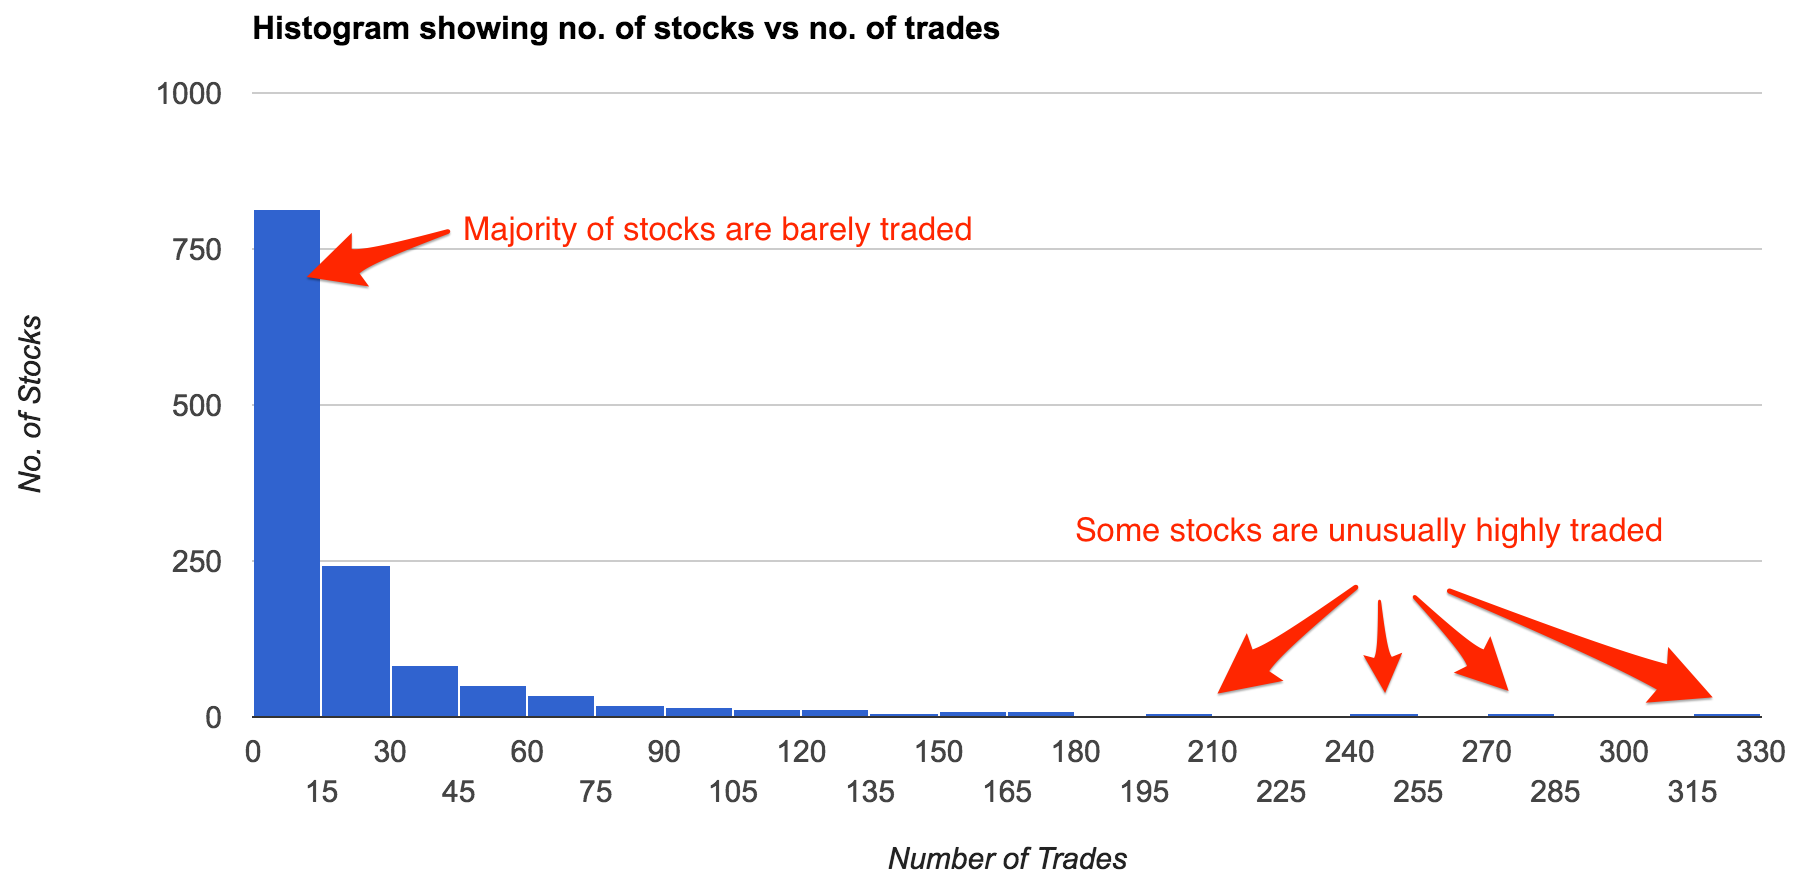
There are though 2 ways to consider the trading interest in a stock. The first is the number of trades, and the second is the value of trades. The most traded shares in both cases differ quite substantially and we’ll look at each in turn.
2a/ Most Traded by Trade Count
Firstly, the top ten most traded shares, by number of trades during the quarter were:
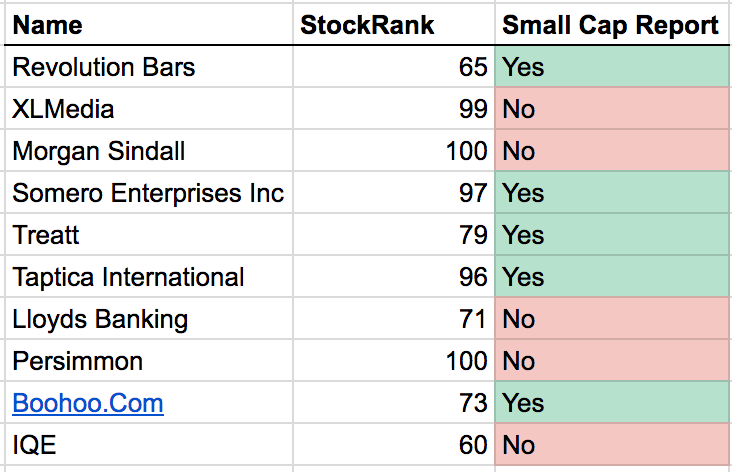
In the above graphic I’ve included whether the Small Cap Report has been covering the stock at all favourably. Paul & Graham who write the report never tip shares, but they are often opinionated in their analysis and their own positions. We can see that about half of the top ten traded stocks on the site by trade volume have had some coverage by Paul or Graham during the quarter. It is also worth noting that a few of the other shares (Morgan Sindall and XLM Media) not covered by the Small Cap Report are also current holdings in Roland Head’s Stock in Focus Model portfolio.
2b/ Most Traded By Value
Of course there’s an army of small shareholders out there who trade in very small size. If you actually multiply the number of shares traded by the share price you can estimate the value of the trades during the quarter. If we do so, a very different picture emerges:
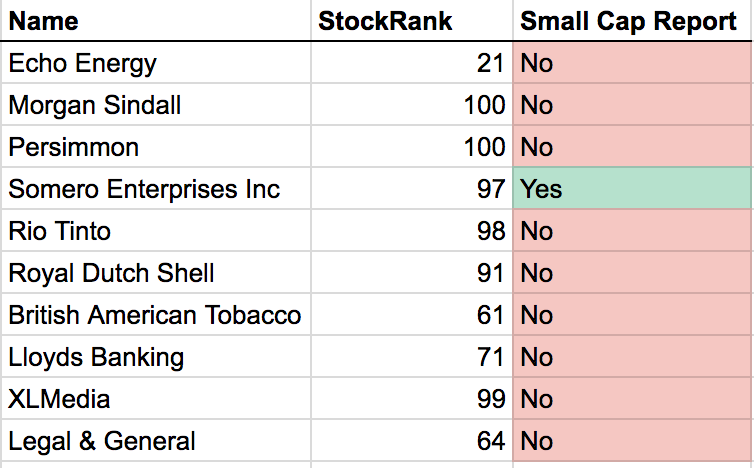
Most of these shares are large cap blue chip names, and there’s very little editorial coverage on these names, if at all on the Stockopedia site.
It’s great to see how independent our community is in making their decisions. This is very much a DIY/DYOR site and we do not ever make stock recommendations. We provide the subscription tools and data to empower everyone to make their own independent decisions. The community appears to be informed by the editorial, but not overly influenced by it. There are a lot of independent decisions going on.
Influence of the StockRanks
The following chart shows the average StockRank of stocks traded during the quarter - buys in blue, sells in red. Given the huge breadth of trades made during the quarter (88% of the market traded), it should be little surprise that the average StockRank of stocks traded is around the 54 mark. But if we ‘value weight’ the trades to show the weight of money a different picture emerges. There’s a much larger weight of money going into higher StockRank shares. The average StockRank of buys is 71, while the average StockRank of the top 100 most bought stocks is only slightly higher at 76.
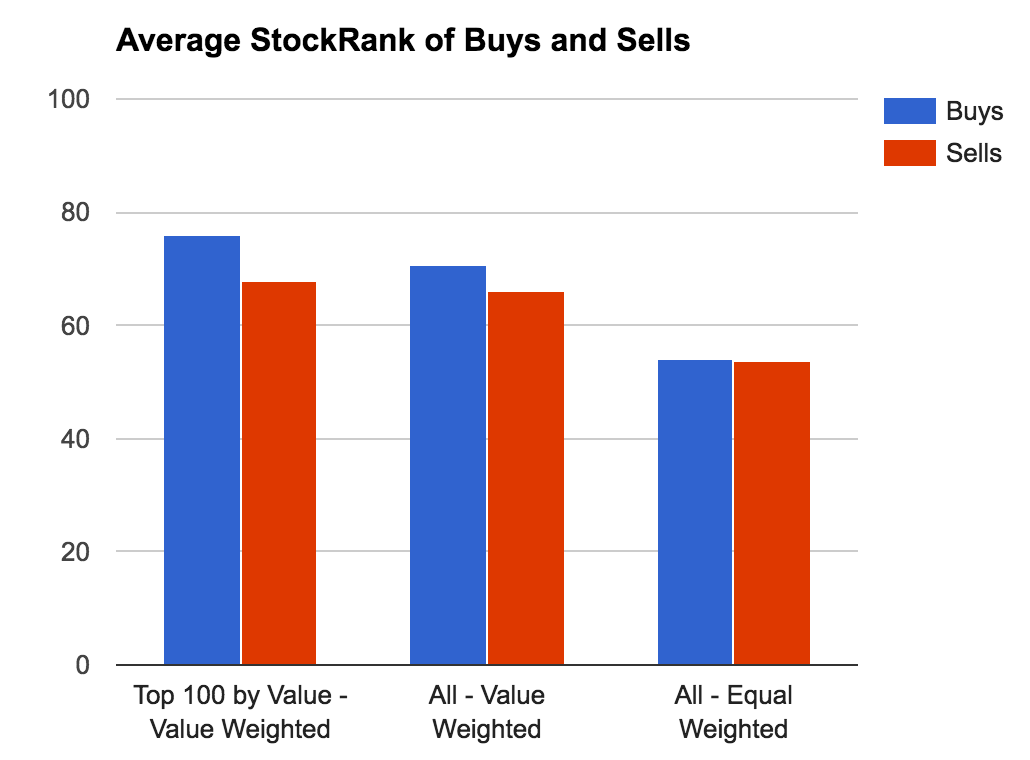
Given that the 90+ StockRank set of shares has most outperformed the market, It may surprise some that the average StockRank purchased is so low. . But let’s look a bit deeper. If we take the top 100 shares traded by value and plot them as a histogram we find the following:
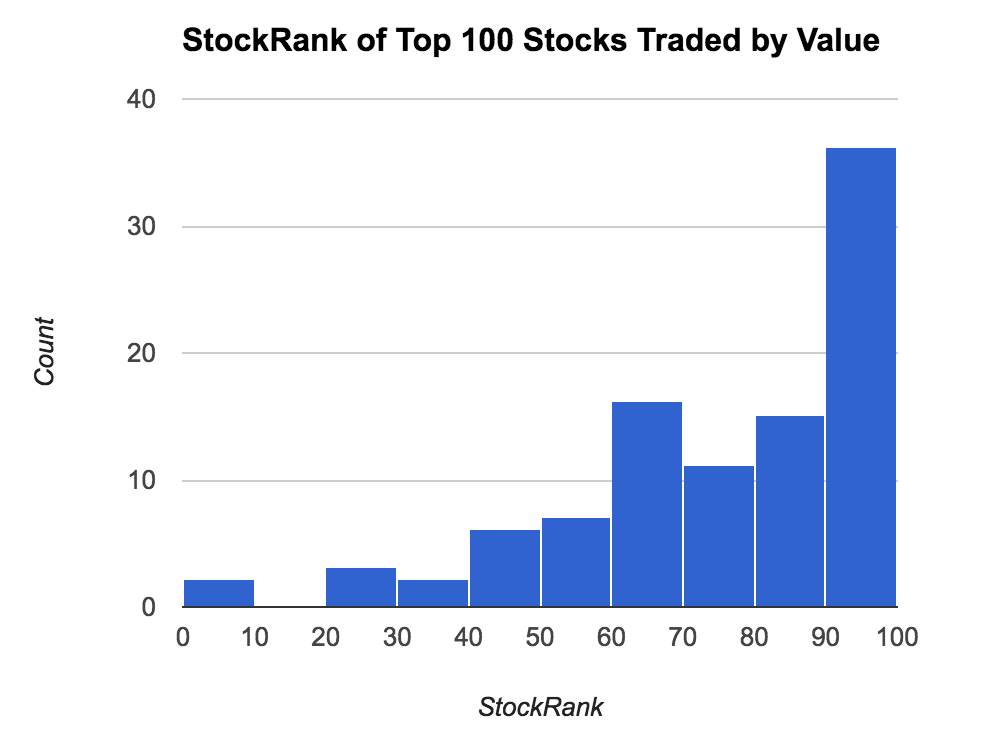
About 36% of the top 100 traded stocks had a StockRank greater than 90. It’s a sizeable proportion, but it’s clearly not excessive. I believe these insights may help dispel the notion that there is herding amongst high StockRank names. This community is much more diverse than many believe.
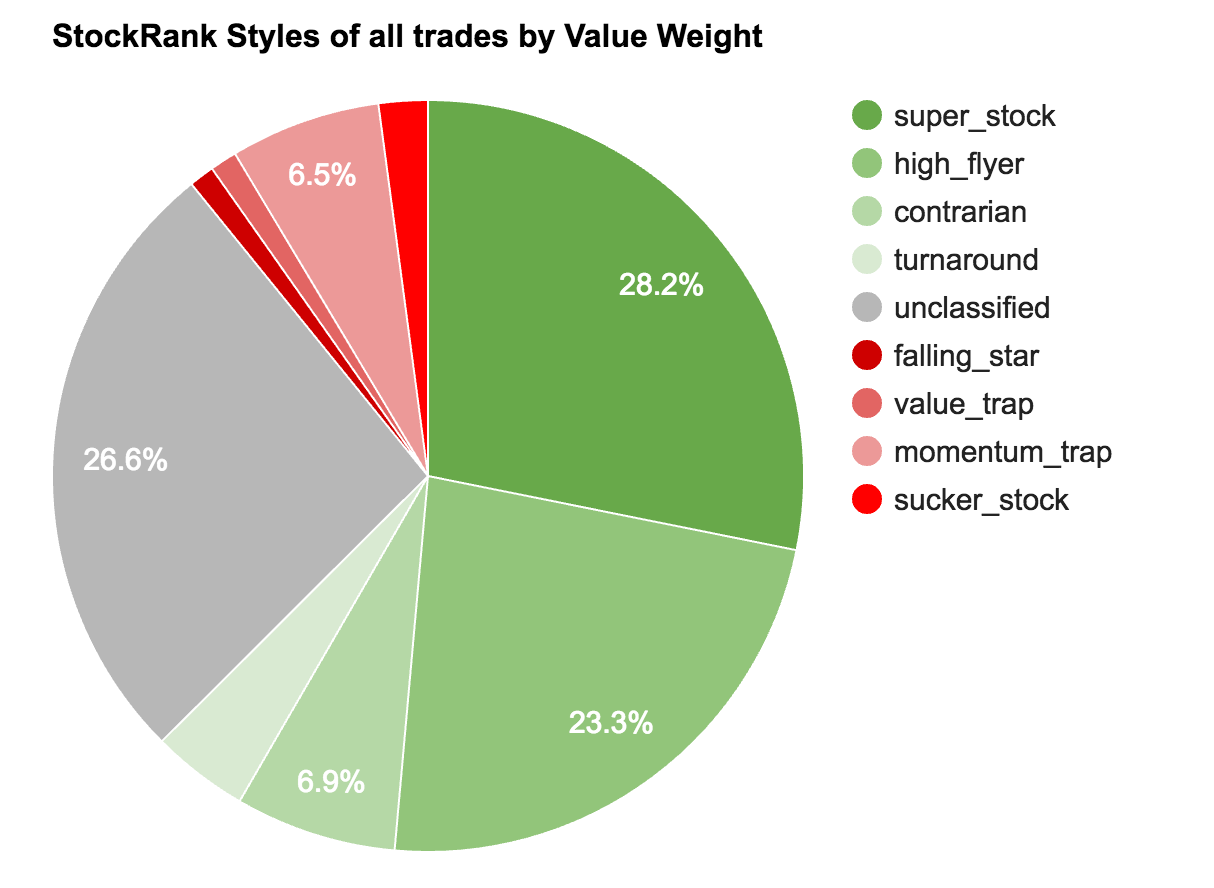
We can also view the transactional data using the StockRank “Style” feature we’ve recently released. Only 11% of the money invested by Stockopedia Subscribers has gone into “Losing Style” shares, with 63% into “Winning Styles”. I take my hat off to the community here - we’re all managing to avoid the dregs and skew our portfolios to higher probability investments.
The Market Impact of the most traded stocks
I’m now going to tread into the area of ‘market impact’. This is tricky to assess for a few reasons. Firstly, not everybody subscribing to (or reading) Stockopedia is tracking their portfolio in the system. Many people also use spread betting or CFD accounts which we currently don’t provide for. So any data I publish here really needs to have a multiplier added. What that multiplier should be is very hard to assess, so I will only publish the facts that I know.
I’ve defined ‘market impact’ as the value of Stockopedia Community trades divided by the total value of trades in the market. So if the Stockopedia community has traded 100 of every 1000 shares traded during the quarter, the ‘market impact’ is 10%.
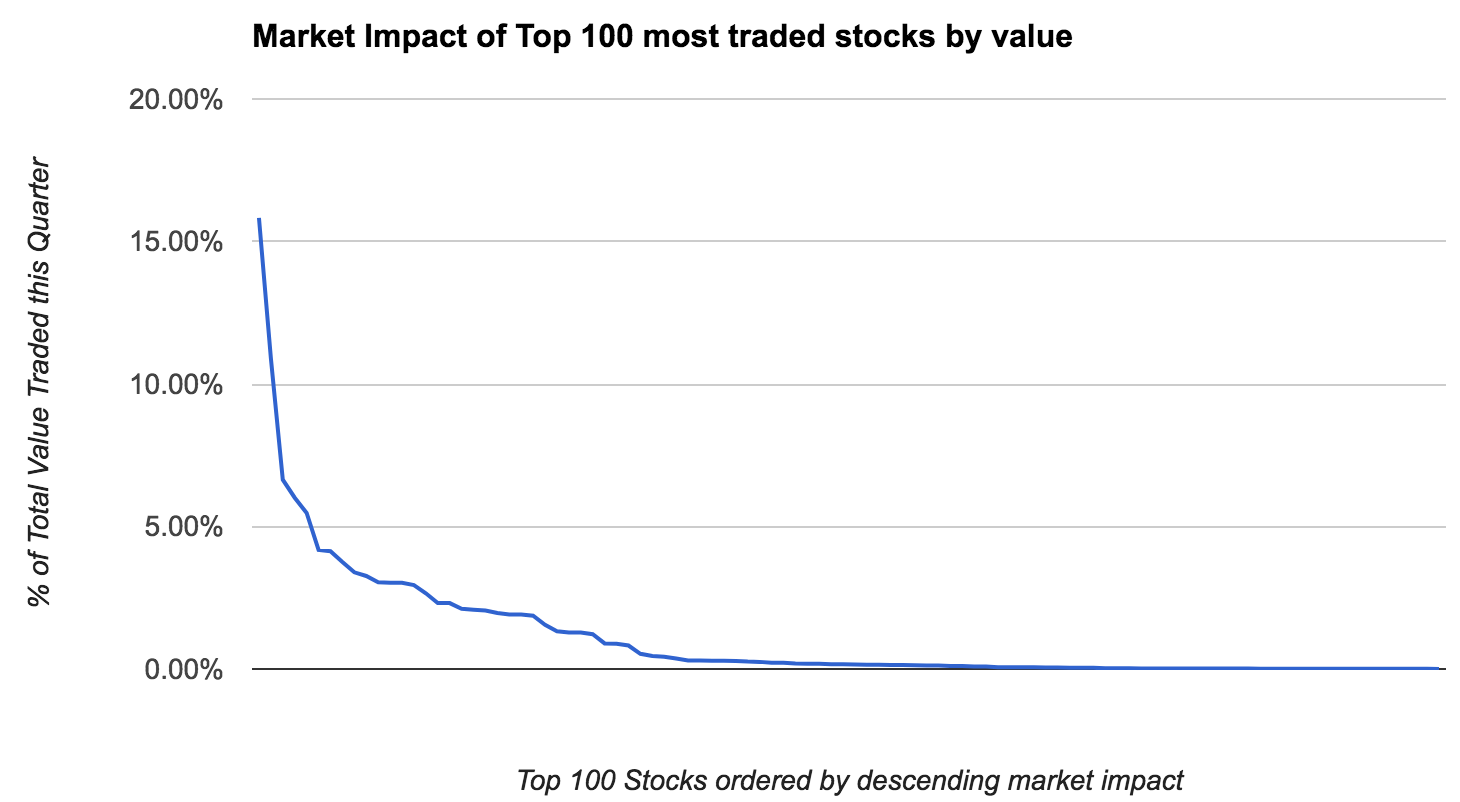
From the above chart we can see that, aside from a few outliers, the community market impact is fairly small. Less than 5% of volume for all but 4 stocks. The average market impact of the top 100 is 1.14%.
Even if we conservatively presumed that only 1 in 5 trades by the Stockopedia community are logged in the portfolio tracker, the market impact would still average less than 6% of volume. Even across all traded stocks (not just the top 100), there are only 11 shares where the market impact has been greater than 10% and these tend to be in illiquid micro-cap shares.
Market Impact on the top 100 by StockRank
It’s so easy to find the highest ranking shares on Stockopedia that the assumption must be everyone is using them. After all, you just have to click the “ranks” tab to find the top 100 ranked shares. The historical performance is published for all to see in the tab next to it and we blog about the philosophy behind them constantly. Surely everyone is trading these?
Well if we flip our market impact analysis and start with the top 100 ranked shares, here’s what we find:
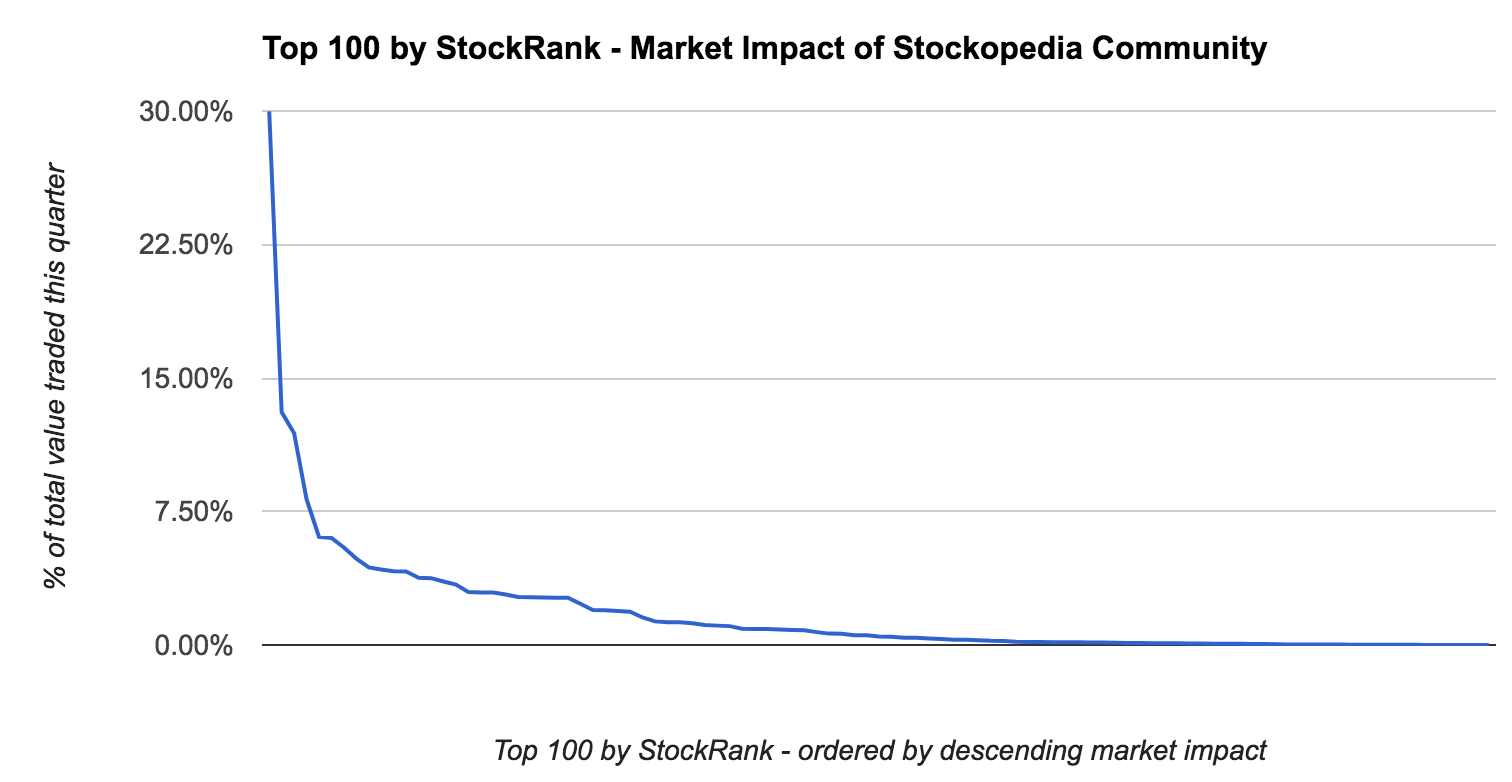
There’s a slightly higher market impact across these stocks but barely. On average 1.79% of total volume (median 0.48%) has been traded by the Stockopedia community. This is hardly excessive, in fact in most cases it’s barely noticeable.
To the left of this chart, IEnergiser is the anomaly with nearly 30% of the volume traded, but this is a highly illiquid, tightly held stock. While 2 micro-caps Titon Group and North Midland Construction both have had more than 10% of their total volume traded by the community. That’s only 3 out of 100 top ranked shares seeing high participation rates by the community.
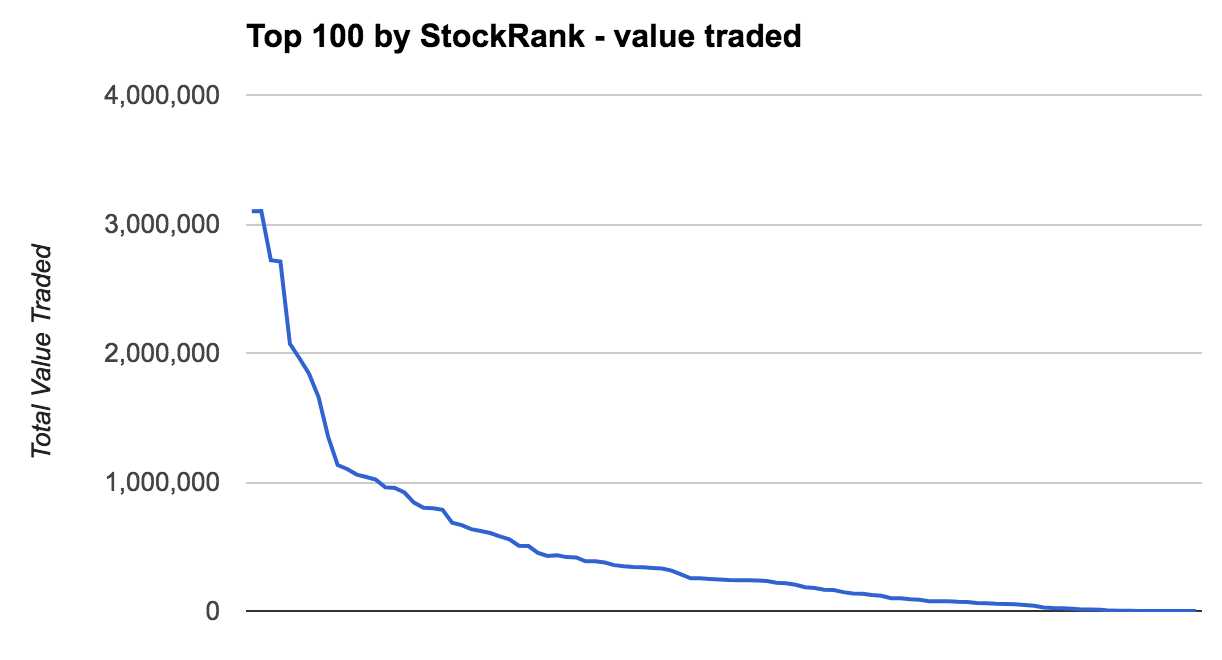
What’s more, the levels of investment into these names is not linear. Of the £50m invested in the top 100 StockRank names over the quarter, 50% was invested into only 14 of those names. A third of the top 100 by StockRank took in less than 2% of the total.
This is clearly illustrated by this chart.
Conclusions
It’s been fascinating for me to run these numbers. I’ve often wondered at what point the size of the UK subscriber numbers would become a problem, but it doesn’t seem like we’re anywhere near it. The market impact is low, and there’s room for many multiples of the current subscriber numbers unless trading behaviour changes considerably.
Our community is mostly full of DIY self-directed investors who all use the tools in different ways. Quantitative investors like me may be more likely to systematically purchase shares purely due to high StockRanks. Qualitatively driven investors are more likely to take other softer factors into account - such as business trends, management and sentiment. My last poll suggested that 80% of subscribers classify themselves as qualitatively driven investors. While my own mission is to grow the 20%, I don’t think we’ll see an enormous behavioural shift for years to come.
The prevalence of qualitatively driven investors in the community may explain the slight aversion to higher ranking shares. High StockRank shares are often psychologically hard to buy. The StockRank selects for Quality, Value and Momentum. But Quality shares are often rather dull and unexciting, Value shares often have perceived problems, while Momentum shares are often at new all time high share prices - nobody likes buying these kinds of stocks. I’m sure this is a reason why there isn’t nearly as much buying amongst high StockRank shares as we might expect.
I hope you’ve found these insights useful. I’d be fascinated to hear your comments.
Disclaimer
This is not financial advice. Our content is intended to be used and must be used for information and education purposes only. Please read our disclaimer and terms and conditions to understand our obligations.
28 comments
Feeling my way,very slowly !
It would be even more interesting to pour over the numbers but nonetheless, a fascinating result. Like others, I have a main portfolio where I can see total performance as a whole and then portfolios which are watch lists but only my transactions would have been included, as I understand Ed's introduction. I manage NAPs in its own portfolio and also in the main one so there is duplication there.
I have been worried that I have positions with a lowly stock rank that are performing well, like RPC and Johnson Matthey but obviously other people are not afraid of poor stock ranks.
Hi Ed,
As well as the two "real" portfolios (one for my ISAS and one for my SSAS) I also have one for your 2015 Naps and one for your 2016 NAPS which I benchmark my "real" portfolios against. I'm guessing that there are others interested in tracking what is happening to your NAPS - if so, maybe there's a way for you to take that into account.
So maybe a "tick box" is needed where a user can indicate that it is a real portfolio.
Also - "Are there any women here" as they say in the life of Brian ? The wonderful Jane B is the only lady I am aware of.
I've spotted a few women amongst posters. Sometimes it is obvious like Jane B or Andrea. Other times it just becomes clear from the content of posts.
Thanks Ed for an interesting article. Like Herbie and Mechanical Bull I wonder what relation Folio data actually bears to active invested portfolios. None of my 7 folios bears a close relation to my share portfolio. They are more like watch lists.
That is a fascinating stock mix: a combination of blue chips and high momentum stocks. Is this an example of the wisdom of crowds? It seems to be a classic barbell strategy.
I wonder whether the choices will change in the future now that Stockopedia provides volatility guidance which will allow for a risk-adjusted approach.
Should be an exam question on what you learnt so far by study stockos company accounts:)
Seriously great website, I just keep learning and learning more
Nice article, although the main message I was left with was - wow people are buying Echo Energy, what do they know that I don't! :-)
Sometimes I struggle to switch off the monkey brain!
I wonder if, knowing that the portfolios are visible, if only to the site's owners, there are some 'shy suckers' not recording their punts in their portfolios? Like shy Tories not showing up in opinion polls..
Thanks Ed - Really interesting post.
I am using one of my folios to track CFD shorts based mainly on low Stockranks. It is possible there are others doing something similar so maybe that is something to be aware of. This could well explain the breadth of stocks being traded. Perhaps there could be an option to flag a folio is being based on real trade to improve data quality?
It would also be interesting to see all trades in the above analysis broken down by buys and sells.
Cheers,
MB
I have 10 folios on Stockopedia (1 is USA/Canada and 1 European) but none of them are the same as my actual holdings, so I think your figures will not be reliable, if I'm anything to go by. Only one folio is similar to one of my accounts but that is mainly for small companies which has small holdings. I have set up various NAPs, I hold few of those shares, another is just a watchlist of possible buys, one is a watchlist I set up after Brexit. One is based on Lord Lee's holdings, another is based on Minervini. So yes there is some duplication but probably 80% I don't hold and I lot I do hold are not in the folios.
Hopefully Ed filtered out the "watchlist" portfolios (this is easy, they have no transactions). Still the data will remain a bit noisy (partial data, fantasy trades, etc), but it's probably not bad an approximation.
Well all mine have transactions, otherwise how do you see how they perform?
It's possible that duplicated folios result in some overstatement of values in each stock - for example I have a folio for each individual account (ISA, SIPP, IG ISA etc), but also a total holding folio, so all purchases and sales show up twice in aggregate.
Interesting to hear that you have fund managers using the service, I had sometimes wondered about that.
I found this article extremely interesting. Obviously with large capitalisation shares the impact would be minimal, but it is good to see that even with small cap shares it is so small in general.
Ok Ed was just wondering, as I'm sure many do.
On the customer insights/community benchmark, I think this would be very interesting and probably heavily referenced if implemented. Would need some way to prevent gaming of the system (BB types who will do anything to publicise their favourite penny share as one example)
Yes, we've been discussing the ways we could algorithmically exclude weird outliers from aggregate statistics. I think it should be quite straightforward to clean up odd or gamed data.
Hi Ed.
Interesting article - thanks for that.
Like several other commentators I use the portfolio feature to play out ideas, strategies etc., in a virtual world before investing for real as well as to hold one "real" portfolio that I use to keep a real time track of my actual share and IT investments. To improve the integrity of your data, would it be possible to add a user defined flag for us to indicate which portfolios are "live" and which are "fantasy" and the base any analysis on the live data? It would still be susceptible to those that want to game the system (which your algos might be able to weed out) but would be a step towards a more accurate picture of subscriber investment patterns.
Gus.
Edward, these figures are based on members Folios?
Very interesting Ed. Does Stocko sell this data? I wonder how much such analytics would be worth and if our brokers sell such info? Surely in this data age they do. Imagine what Hargreaves Lansdowne knows about AB retirees? Another good argument for diversifying across accounts.
The results are excellent, the distribution is not a surprise though, I would expect to see something approximating a power-law distribution. I'm pleased that I have some of the most active shares and even more pleased that I don't have some of the others!
One point on use of portfolios there is no pain free way to log spreadbets, which count for a big chunk of my trading now.
Also, that part of the service is not delivered https. For most it won't matter, but in some cases it would.
StevieJ - no, no, no - we'd never sell any data ever - not while I'm at the helm and I'd have to ripped from the helm kicking and screaming. It's all about trust. We don't spam, we don't sell customer data, we only host a small amount of advertising for non-financial purposes. This business is 100% funded by subscriber fees. I want to keep it this way forever. Private investors deserve a better deal and I'm determined that we provide it.
Also I've done this analysis myself. Nobody else is involved and I've been personally motivated to do this analysis to answer questions that I hear again and again from subscribers.
I'm considering adding a "Community Insights" dashboard somewhere on the site that shows the recent top buys/sells and holdings of the community - so this research has also been done with that in mind. I'd be interested in everyone's feedback on this point.
Also - I'd also be interested in creating a Community Portfolio Benchmark as an alternative to the FTSE All Share. i.e. to answer the question "What is the average return of Stockopedia subscribers in the market?" - if anyone has feedback on this point I'd love to hear it.
I wish I was wrong but I fear the average Stocko subscriber underperforms slightly. If I'm right, it may be unwise to work hard to prove it. :-)
If we tried to devise a subscriber style classification system in the spirit of stock classification, we could have something like:
A style-weighted benchmark could work out if you have good enough data to auto-classify subscribers ;-)
@cig - I have a working theory of investor archetypes... I'm going to publish it next week.
Hi Ed I am with Gus and Herbie in using the service to test various strategies my actual holdings are very different. That being said in recent months I have noticed a lot of activity does appear to coincide with Pauls analysis of particular stocks all I need now is a crystal ball and I could be a mullionair. Rodney
do you publish the number subscribers there are
At the end of 2015, Stockopedia subscribers numbered around 60,000
Assuming that number has continued to grow at a rate of 35% pa ("more than a third"), then as of today it will be an circa 92,000
ie 60,000 * (1.35)^(17 months/12)
I placed my largest holding in Treatt when it showed up on my stock rank screening in May 2016. Its up by 180% now, my largest gain