We've just come through one of the most intense periods in the UK stock market calendar. From December to end March, hundreds of UK-listed companies released trading statements, full-year results, and interim updates - and our editorial team have been there hustling out the signals every single day.
In this piece, I want to help you see the wood from the trees. Buried within four months of regulatory announcements are some powerful signals - signals that research has shown can predict future share price performance.
And the timing right now may prove to matter. Markets sold off sharply on the Iran conflict but are now rallying on the first signs of a peace treaty. If you're thinking about where to redeploy capital, this is exactly when you want to know where the strongest signals are. Reporting season isn't just news - for those who know what to look for, it’s a real edge.
The Numbers
From the 1st December 2025 to 2nd April 2026, the Daily Stock Market Report has covered an incredible 2,034 individual news stories across 86 trading days. Of those, our team has written 557 individual analyses - ranging from quick assessments in the summary table to detailed deep dives.
Here's what the signal breakdown looks like:
| Signal | Count |
|---|---|
| Significantly ahead of expectations | 14 |
| Ahead of expectations | 137 |
| In line with expectations | 251 |
| Profit Warnings | 63 |
That's a roughly 2.3:1 ratio of positive to negative surprises - which tells us something about the resilience of UK corporate earnings, in spite of all the budget, inflation and rates uncertainty. Or perhaps it just tells us that management has learned to lower expectations to beat them.
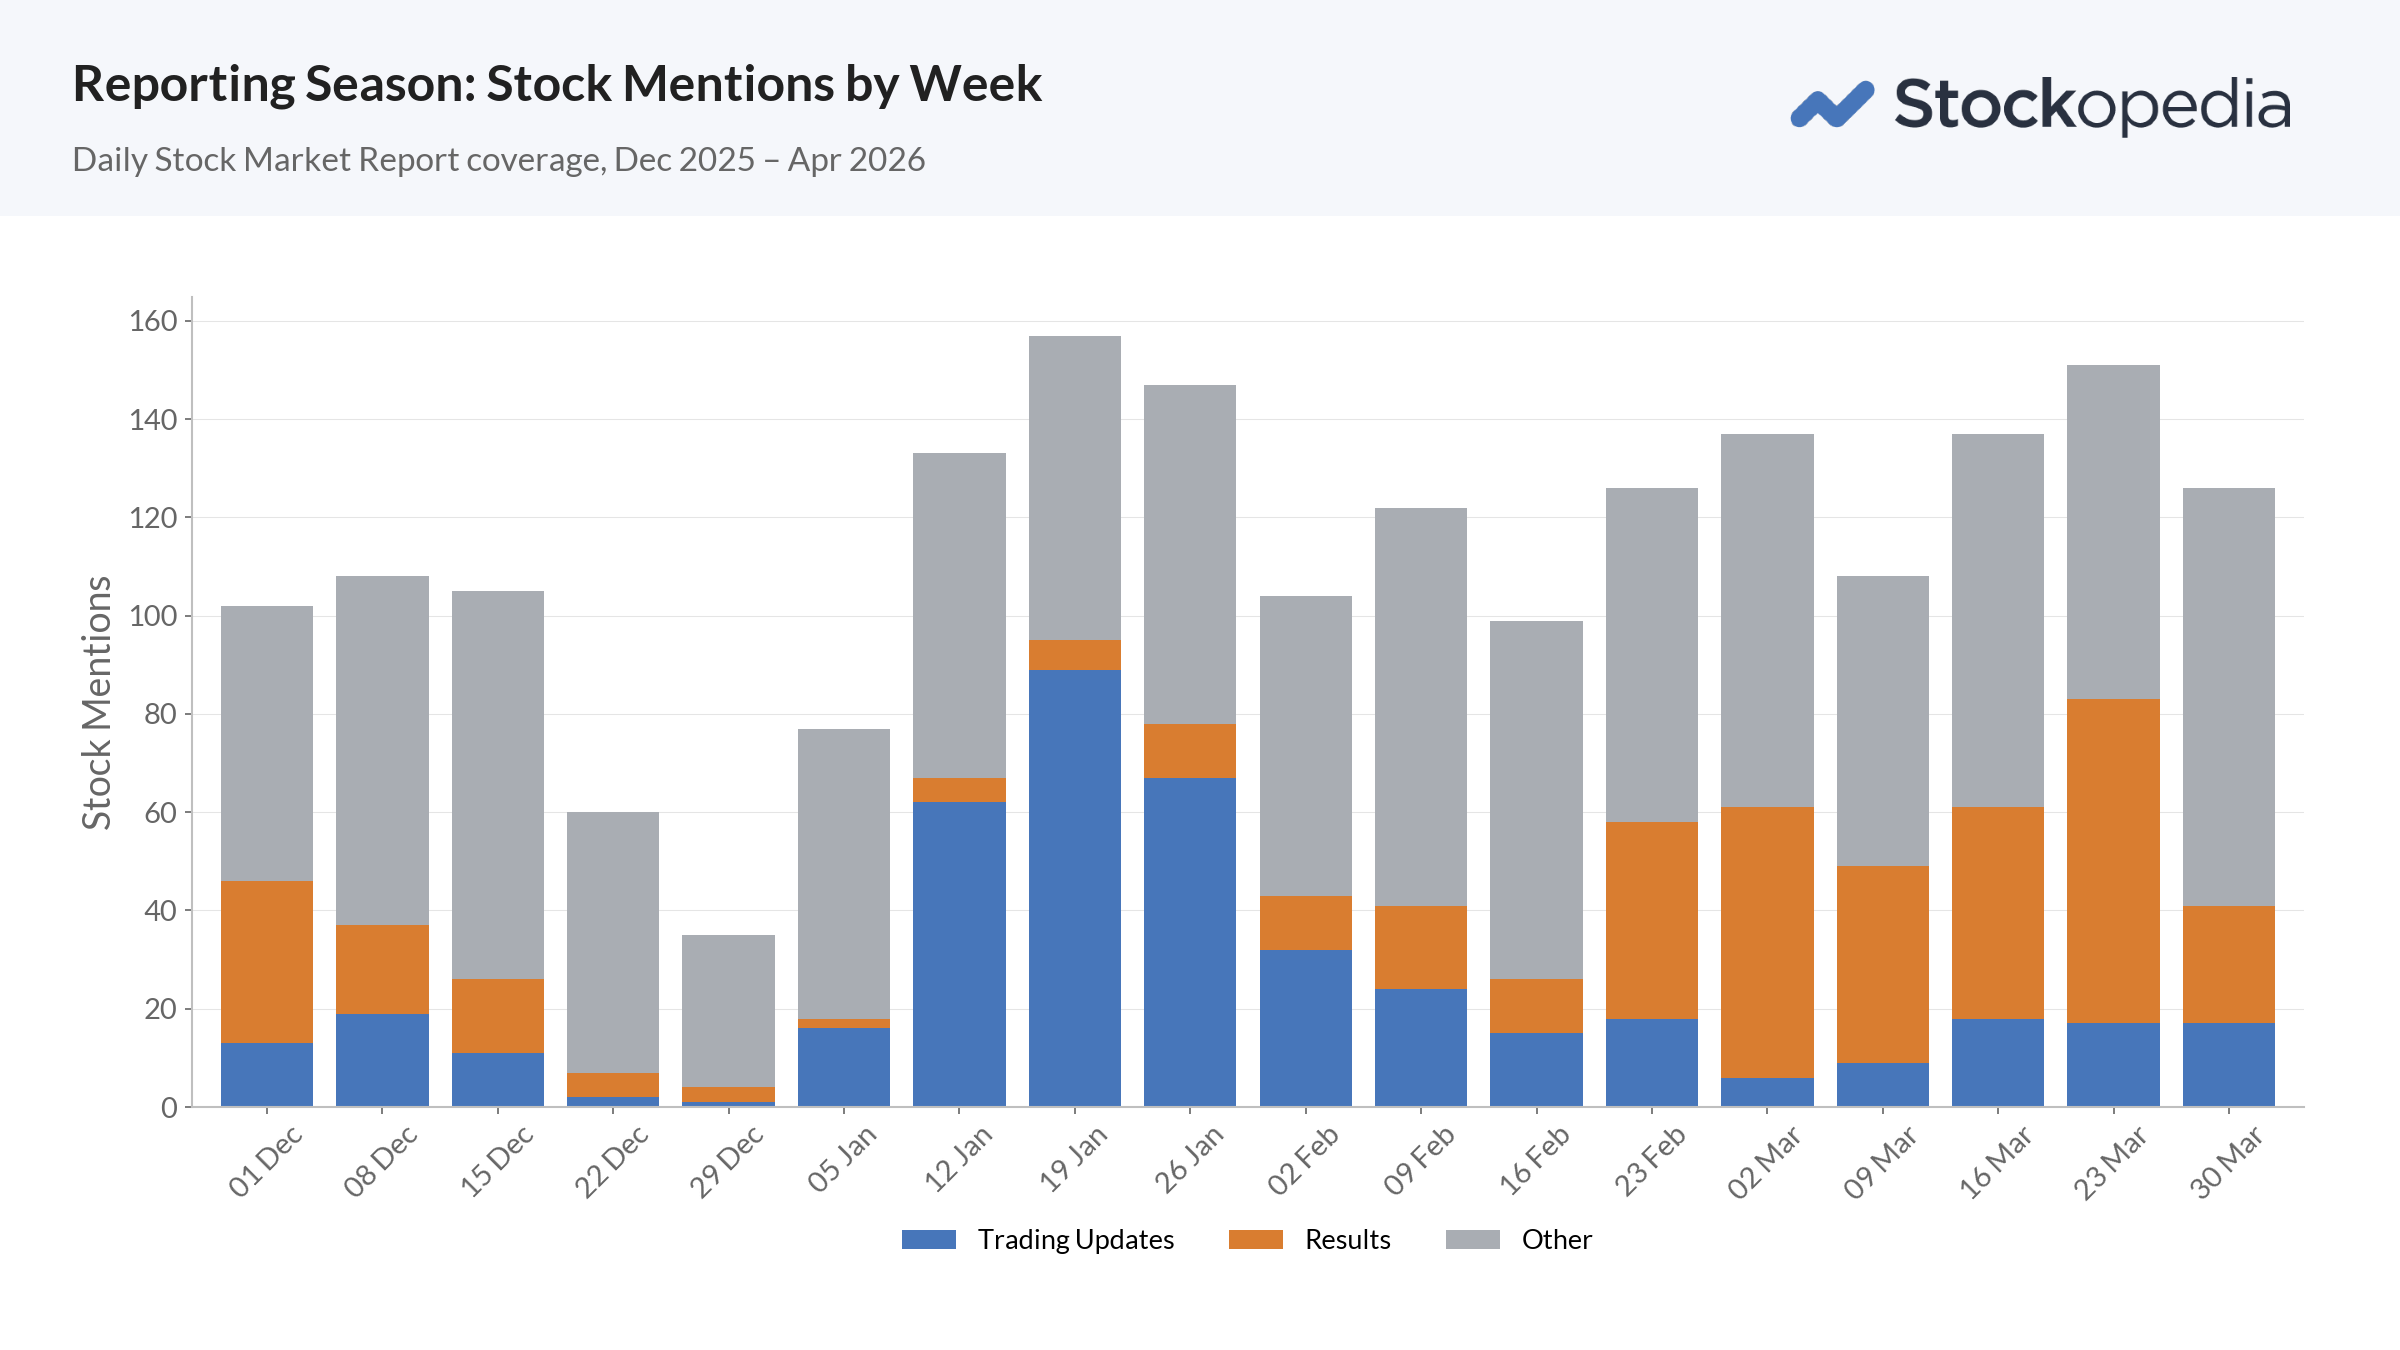
It’s worth reflecting on the shape of reporting season. The chart below shows that January was peak trading statement season - with 45% of all mentions in the month due to trading updates (blue). March then brought the full wave of annual and interim results (orange).
When you break out just the trading and results signals against expectations week by week, the picture is even more striking:
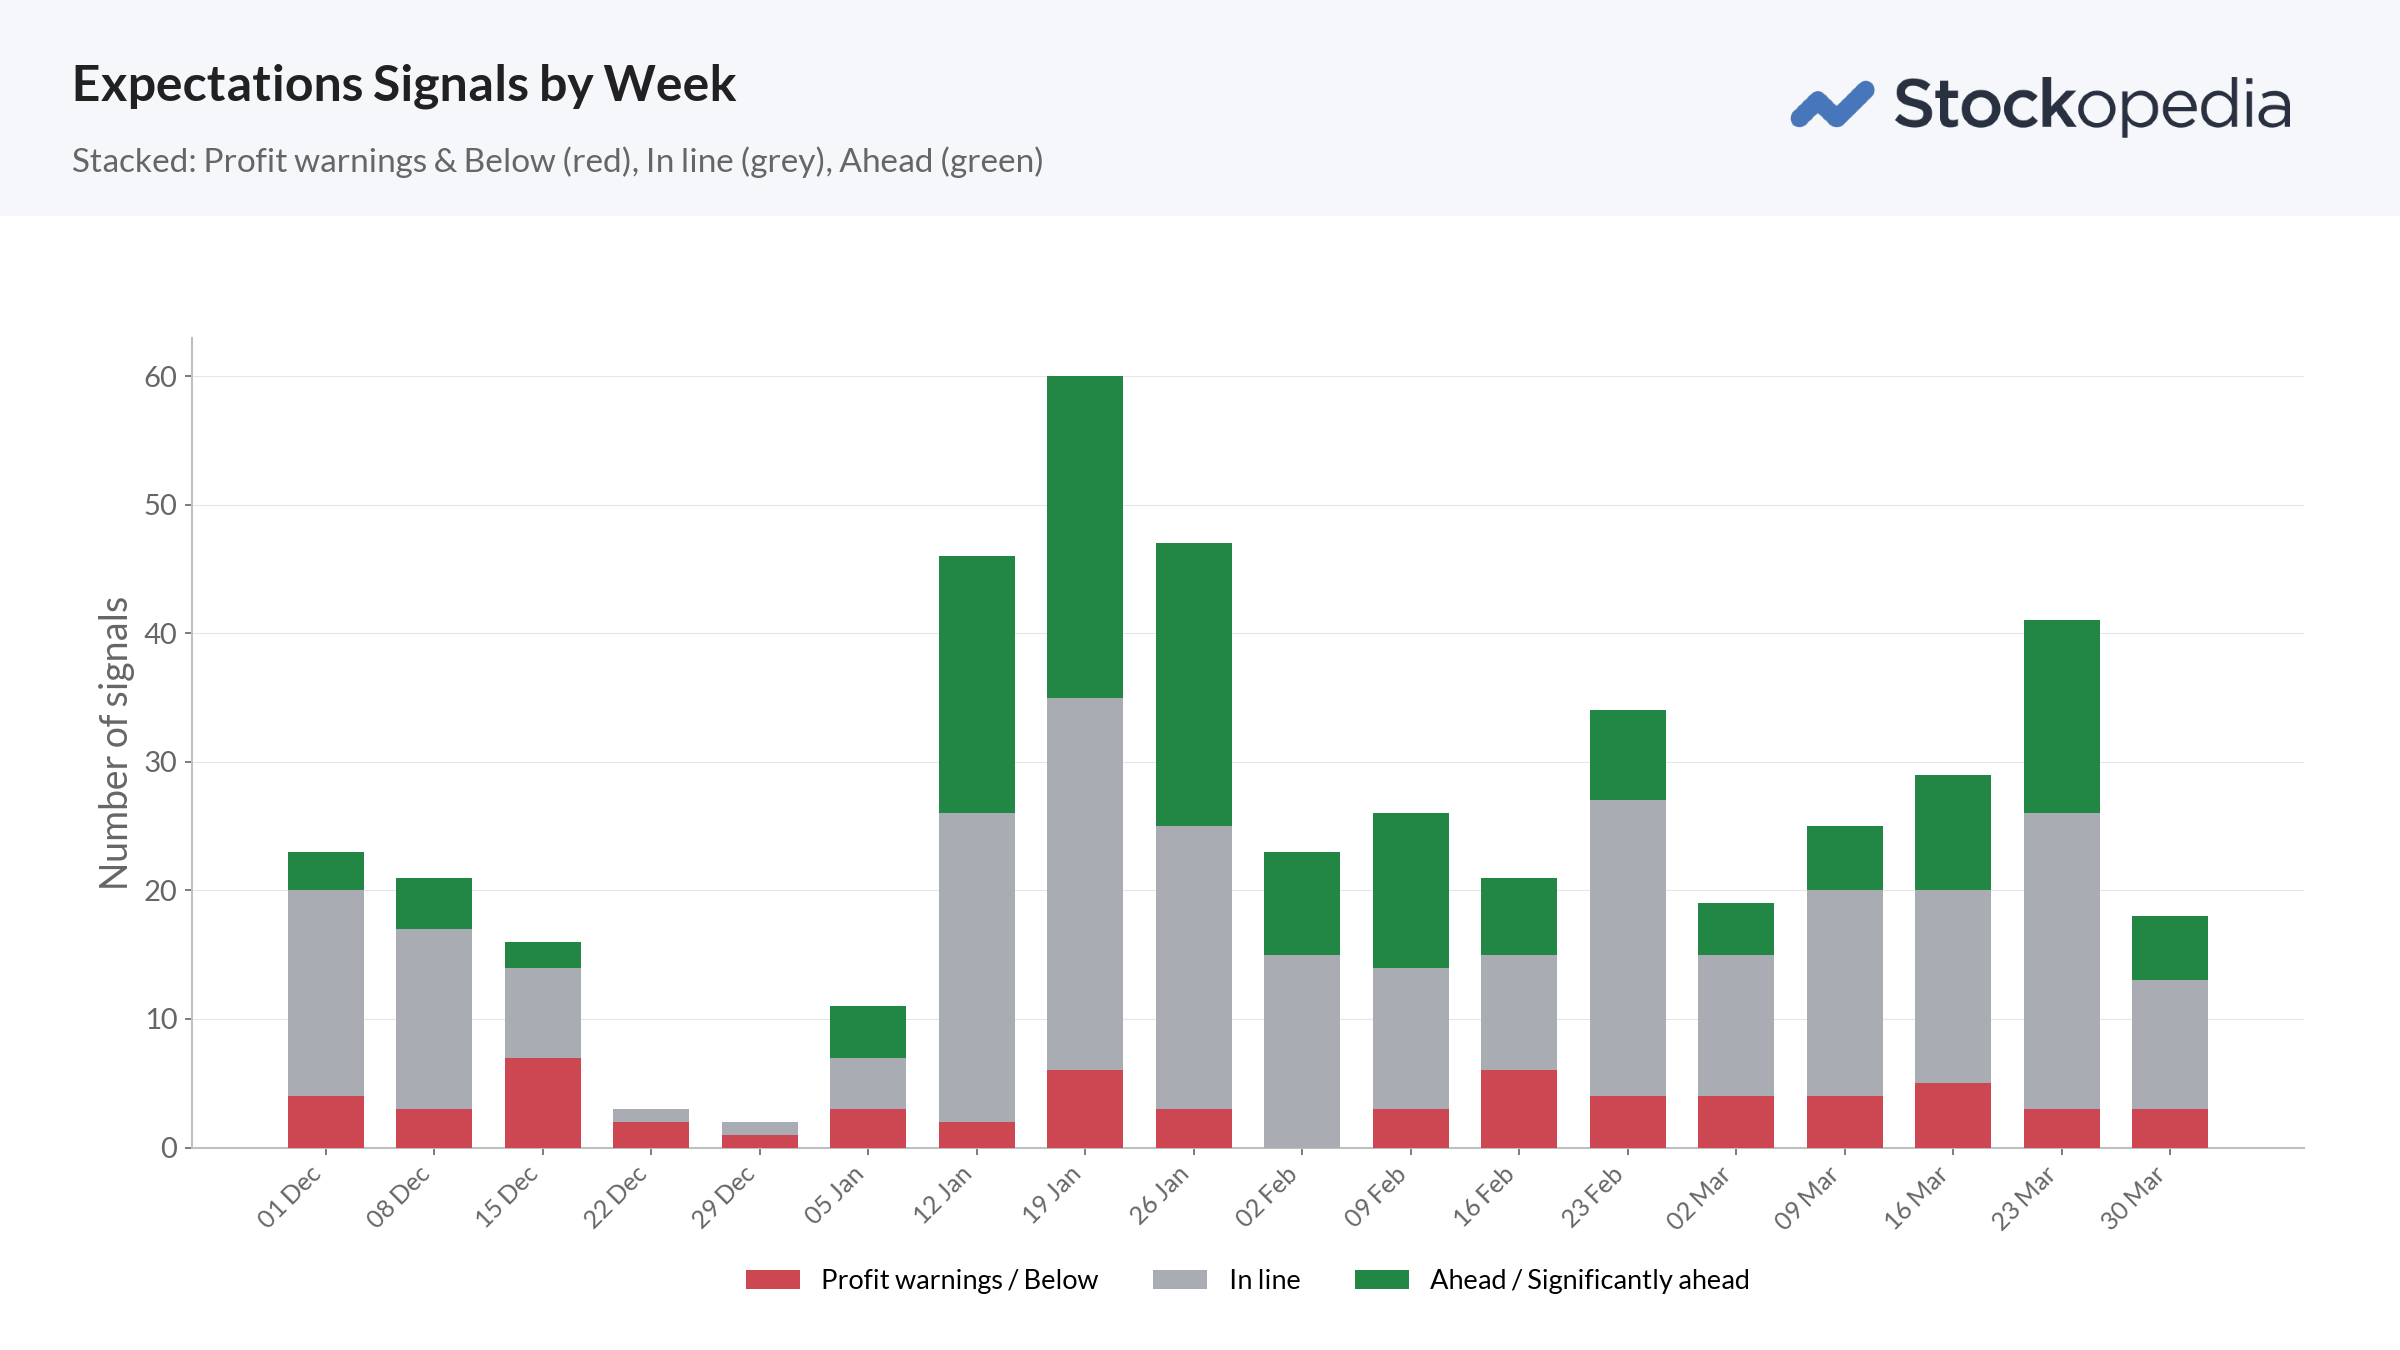
The green (ahead/significantly ahead) announcements dominated the red (profit warnings / below expectations) throughout the period. January's peak weeks saw 20–25 positives stacked up against just…