Mechanical Bull's StockRank Portfolio - 2016 Performance Review

Following Ed’s New Years update on his NAPs strategy, I will give an update on my own version of a high Stockranks based strategy. I have been applying this now for over 3.5 years, more or less from the time that the Stockranks were first launched. So quite possibly I have been using a rules based Stockranks strategy longer than anyone.
The basic strategy is pretty simple. Buy stocks with the very highest Stockranks (which also score highly on the Screen of Screens) and sell them when they go below a certain level. There has been a bit of tinkering with the rules over time. The most important change has been the lowering of the sell threshold from 90 to 80, which means that stocks tend to be held for longer with less churn overall. This year I have gone a stage further and if it drops below 80 but the stock is showing signs of momentum I will top slice and maintain a position until the momentum peters out.
Other tweaks include incorporating PEG by creating a rank from to low to high and combining with the Stockrank based score so selections are weighted to low PEG stocks. I have also taken inspiration from one element of the NAPs approach, namely the bid spread, and similarly weight selections towards tighter spreads. Unlike NAPs, I am not overly concerned about diversifying across all sectors, although I do try to avoid having more than two stocks in the same industry peer group. Finally, I make reasonable attempts to avoid suspected fraudulent listings. Maybe all these tweaks make for a secret sauce with a more complicated recipe, but the main ingredient is a high Stockrank, which remains unchanged.
So how is it all working out? I am no longer maintaining my blog's fantasy portfolio, but what I can show is the indexed change in the total valuation of my (and my wife’s) UK trading accounts for every week since 26 October 2013 (index = 100).
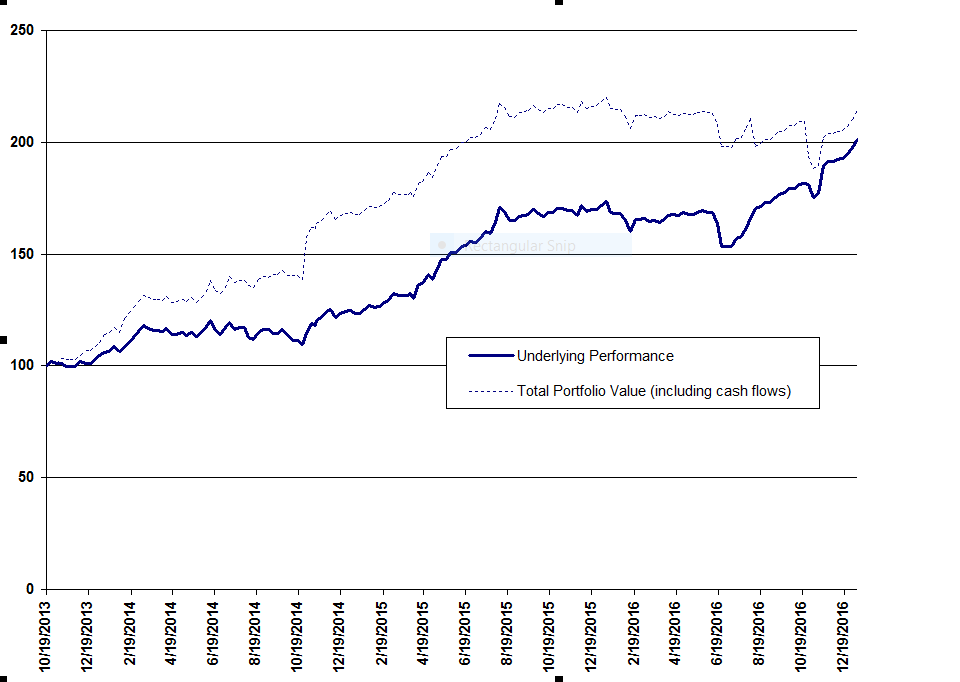
This chart includes dividends and all trading and other costs, so this is a good reflection of what kind of returns are achievable in the real world. However, there has been some movement of cash into my accounts, mainly over the first couple of years, as well as a couple of big cash withdrawals over the last year. I don’t think these have had a major impact on the underlying performance, but I have included this above for the purposes of transparency. The annual underlying performance figures look like this:
| Year | % change |
| 2014 | 20.6 |
| 2015 | 38.3 |
| 2016 | 16.1 |
| Average | 25.0 |
I don’t have a precise figure for 2013, but I estimate it to be at least 28% between May to December 2013. Therefore, in just over 3.5 years I have comfortably averaged 25% per year. Remember, these include dividends and all trading costs. However, these figures also include cash holdings in the trading accounts and I am never fully invested - the cash level has been anywhere from about 10% to 30%. This will dampen overall returns but offers a certain amount of safety and makes it easier to sleep at night.
2016 was a bit down on previous years. Performance was certainly not helped by a lot of silly ad-hoc trades I made around the time of the EU referendum. When the polls suggested we would remain in the EU day before the vote, I bought in with the idea of beating the rush. When it turned out that we were leaving, I was convinced that markets were going to tank and I took some heavy losses on cyclical stocks, such as house builders and retailers. Of course, many of these rebounded quite quickly so I bailed out at exactly the wrong time. Fortunately, my system also picked up a numbers of stocks around this time that performed very strongly in the second half of 2016 including Ferrexpo (a 3 bagger), Beximco Pharma and Avesco (that both doubled), thus sparing my blushes. Indeed the overall performance over the last six months has been staggering – up over 30 per cent.
My take on all this is that factor based investing seems to get quite “hot” at particular and unpredictable times. I also suspect (although I have no firm evidence) that new entrants into the higher echelons of the Stockranks tend to perform a bit better than ones that have been highly ranked for some time. Therefore, I think it is better to have a strategy where you are rotating into potential “hot” positions on a fairly regular basis rather than rebalancing once a year. This may partly explain the big difference in the performance of Ed’s NAPs portfolios for 2015 (where the beginning of the year was a very “hot” period) and 2016 (which was not).
The experience of 2016 suggests that trying to predict the direction of markets is pretty futile. However, I cannot escape the feeling that there is a collective hubris around the increasing likelihood of a hard Brexit in March 2019, and that the markets are not pricing the disruption that this would entail.
For this
reason I have sought to further diversify my investments abroad, specifically
to Australia and New Zealand. I am now 30% invested in Australian and NZ
denominated trading accounts, hence the big cash withdrawals in my UK trading
accounts. This offers a hedge in case of either a fall in UK stocks and/or
further currency falls. I have extended by Stockopedia subscription and I am
already applying the Mechanical Bull system in Australasian markets. Although
the performance to date has been flat, I have no regrets. Again, it is all
about being able to sleep at night …. and dreaming of early retirement!
Disclaimer
This is not financial advice. Our content is intended to be used and must be used for information and education purposes only. Please read our disclaimer and terms and conditions to understand our obligations.
14 comments
Daniel
I use ASB securities. https://www.asb.co.nz/asb-securities.
I'm originally from NZ and have had an account with the ASB since I was young. The trading platform allows trading in both Australian and NZ shares which is great. I think you may need to provide an NZ address so I use my Mum's. So, not sure if it is a practical option for most people.
Cheers
MB
Not sure about the screen of screens, has not performed so well in last 18 months and you would have missed Sopheon (LON:SPE) one of the best performers since June 16.
What broker do you use for NZ shares?
I have a query on the Screen of screens screen, why don't any shares currently qualify from 2016, there are 2017 and 2015 ones? Looks a bit odd?
pka
I can't give a definitive answer but I can say the following:
- The screen of screens probably doesn't make a big difference - it is just part of my personal style
- The low spreads idea appeals because the spread is a trading cost and it makes sense to minimise it. On the other hand smaller caps have a greater potential to outperform so there is a balance to be struck. I am toying with the idea of a size rank which seeks out smaller stocks with the tightest spreads. However, in terms of the above results I really can't say what the impact is.
- Backtesting suggests that combining QVM factors with a PEG between 0 and 1.5 makes a significant improvement to returns so I view this as a key ingredient to my secret sauce.
Cheers,
MB
Hi Mechanical Bull,
Many thanks for your reply to my question, pka
Hi MB,
I'm also running a 3 year annualised rate of 25% by picking high QM stocks which feature a low risk adjusted PEG. It's worked very well for me too.
I filter for stocks with a spread < 500 bps.
Keep up the good work.
Phil
Hi Mechanical Bull,
Congratulations on the excellent performance of your portfolio over 4 years.
If you had just bought stocks with the very highest Stockranks and with low spreads, without insisting that they score highly on the Screen of Screens and without weighting to low PEG stocks, how do you think that would have affected the performance of your portfolio?
Fascinating review, I'm in agreement that it is an impossible task to predict Macro stuff, all we can do is buy good cheap stuff and keep everything crossed,
A quite stunning performance - congratulations ! I agree with a more frequent rebalancing approach to pick up the hot factors... even in an annually rebalanced portfolio, it's wise to rebalance a quarter of the portfolio quarterly.
Mechanical Bull
Very interesting post, thank you for doing that. I liked your reflections about hot stockrank stocks and have had similar experiences.
Regards
Howard
Any ideas on the best way to work out the hotness? I know there are top ranked stocks on the move displays on the home page but is there a better way?
Carey
No single procedure, rather a combination.
I do use the Stock Ranks movement tool.
I also have my Momentum screen showing current change, 1 week change ,3 month change, 6 month change and 1 year change. I find this helps me see decliners as well as budding risers either within a screen, my portfolios or sector/industry scans.
I also use a twin screen process whereby I have one screen with settings at rigourous (possible buy) levels thus few stocks actually pass. This I run say weekly which catches new risers. A have this same screen but as a second whereby its settings are slightly loser, thus it shows me stocks which might be coming up (or are going down). Again running this regularly soon helps you to see stocks for your selection criteria which are possibilities in the near future. Obviously you can narrow screening to Mkt caps, Sectors or Industries as well.
Finally I am starting to use the 'Chart Signals' tool but have yet to define my approach to this, but it looks quite useful.
Hope this helps, sorry no single silver bullet answer from me.
Regards
Howard
Hi Howard - Interested in your response above re. identifying "hotter" Stockrank stocks. Don't quite follow your description of two screen process above. What variable are you actually screening for?