New Year NAPS - Top Stocks for 2019 and the Symmetry of Risk

Well it had to happen eventually didn't it? After a barnstorming 43% return in 2017, the No-Admin-Portfolio-System (NAPS) hit a wall in 2018. My musings on the benefits of ignorance last January led to nearly 100,000 reads over the year but, if private investor sentiment is anything to go by, I've a feeling that this year's more sober reflection may not prove as popular. I think this would be a shame, as it's in the harder times that the best investment insights are learned.
As usual, this is an extensive piece, ruminating on the sources of risk and return since the inception of the NAPS, reviewing the portfolio selection criteria and culminating in the list of 20 stocks for the year.
Yes, these are the "top stocks for 2019" according to my current NAPS criteria, but I have absolutely no crystal ball as to where each stock will go. Up, down, sideways, in circles - I have no idea. I know this is a controversial thought to traditional stock pickers, but the individual stocks don't matter to me. I wouldn’t bet my home on a single one of them. What matters to me is how the stocks have been selected, what traits they bring, and how they synthesise into a portfolio. The NAPS seeks the perfect portfolio, not the perfect stock.
What is the NAPS?
(Long term readers can skip this section.) The NAPS is a process that can be used once or twice per year to generate a stock market portfolio with a good chance of market beating returns. It's based upon a few fundamental principles:
- Behavioural Investing. Many stock market investors (myself included) are plagued by behavioural biases that can lead to investment mistakes. A disciplined, rule-based approach to stock selection helps counter these biases.
- Factor Investing. Market beating stocks are regularly driven by a common set of factors or traits (such as quality, value & momentum). We can screen the market for stocks with these traits to select potentially, market beating portfolios.
- Diversification. It's the only free lunch in investing. Since most investors either don't diversify or don't know how to, rigorous diversification helps avoid the risk of ruin and maximises the potential of profiting from factors.
In practice, it's a simple, rule based approach that generates a portfolio of 20 high ranking stocks from different market sectors. It's been extremely powerful, leaving the vast majority of active fund managers & passive index trackers dead in their tracks. You can read all the back-history of this approach in the NAPS Portfolio Blog Archive, and a brief of the performance in the next section.
2018 Performance Review
The market wobbled in January 2018 before recovering. But the foray back above the previous highs proved short lived. Since May, most international markets have been on a downswing, topped off by a particularly black December. The NAPS Portfolio ended down 11.4% for 2018 in comparison to a 12.6% fall for the FTSE All Share. But since the inception of the NAPS in 2015, it's generated a 91% capital return before dividends, at almost an 18% annualised rate of return. You can visualise the four years of history in the chart below.
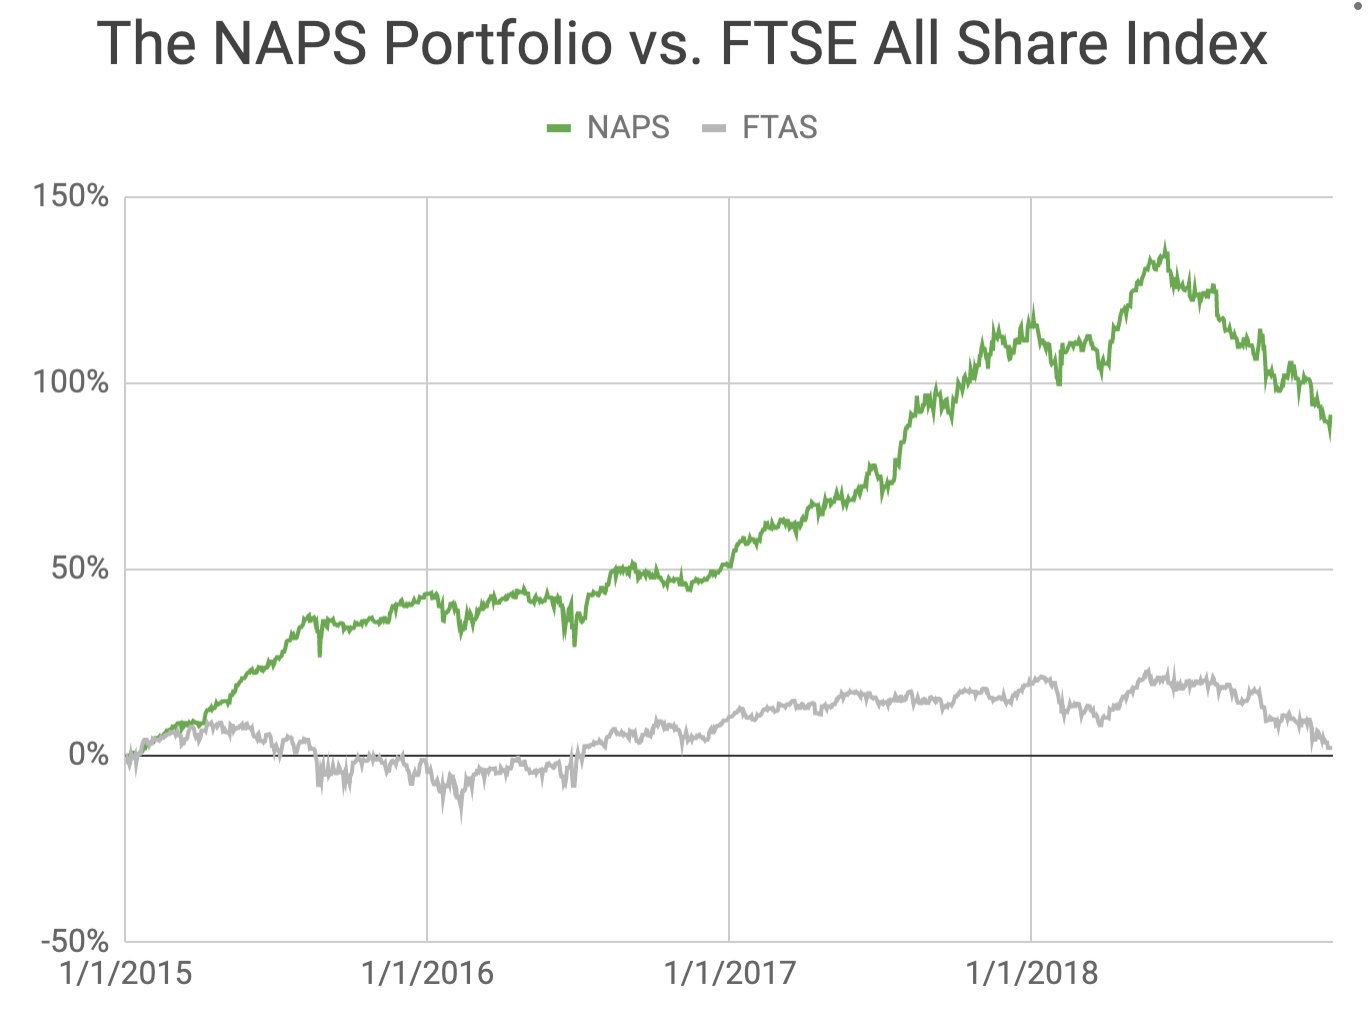
(NB - Please note that for the rest of this article, all performance statistics exclude the last couple of day's trading of 2018. To improve publishing timeliness I wrote the bulk of the piece at the weekend which excluded the final end of year rally. I hope to update the data when I'm back from holiday in the office next week.)
One of the issues with relative return charts like the above is that drawdowns between the two lines are not compared like for like. The NAPS return year-to-date looks worse than the FTSE All Share drawdown, when in actuality it's less. It's a visual distortion. Looking at the returns as a column chart makes the picture clearer. The NAPS have outperformed the FTSE All Share in 3 out of 4 years.
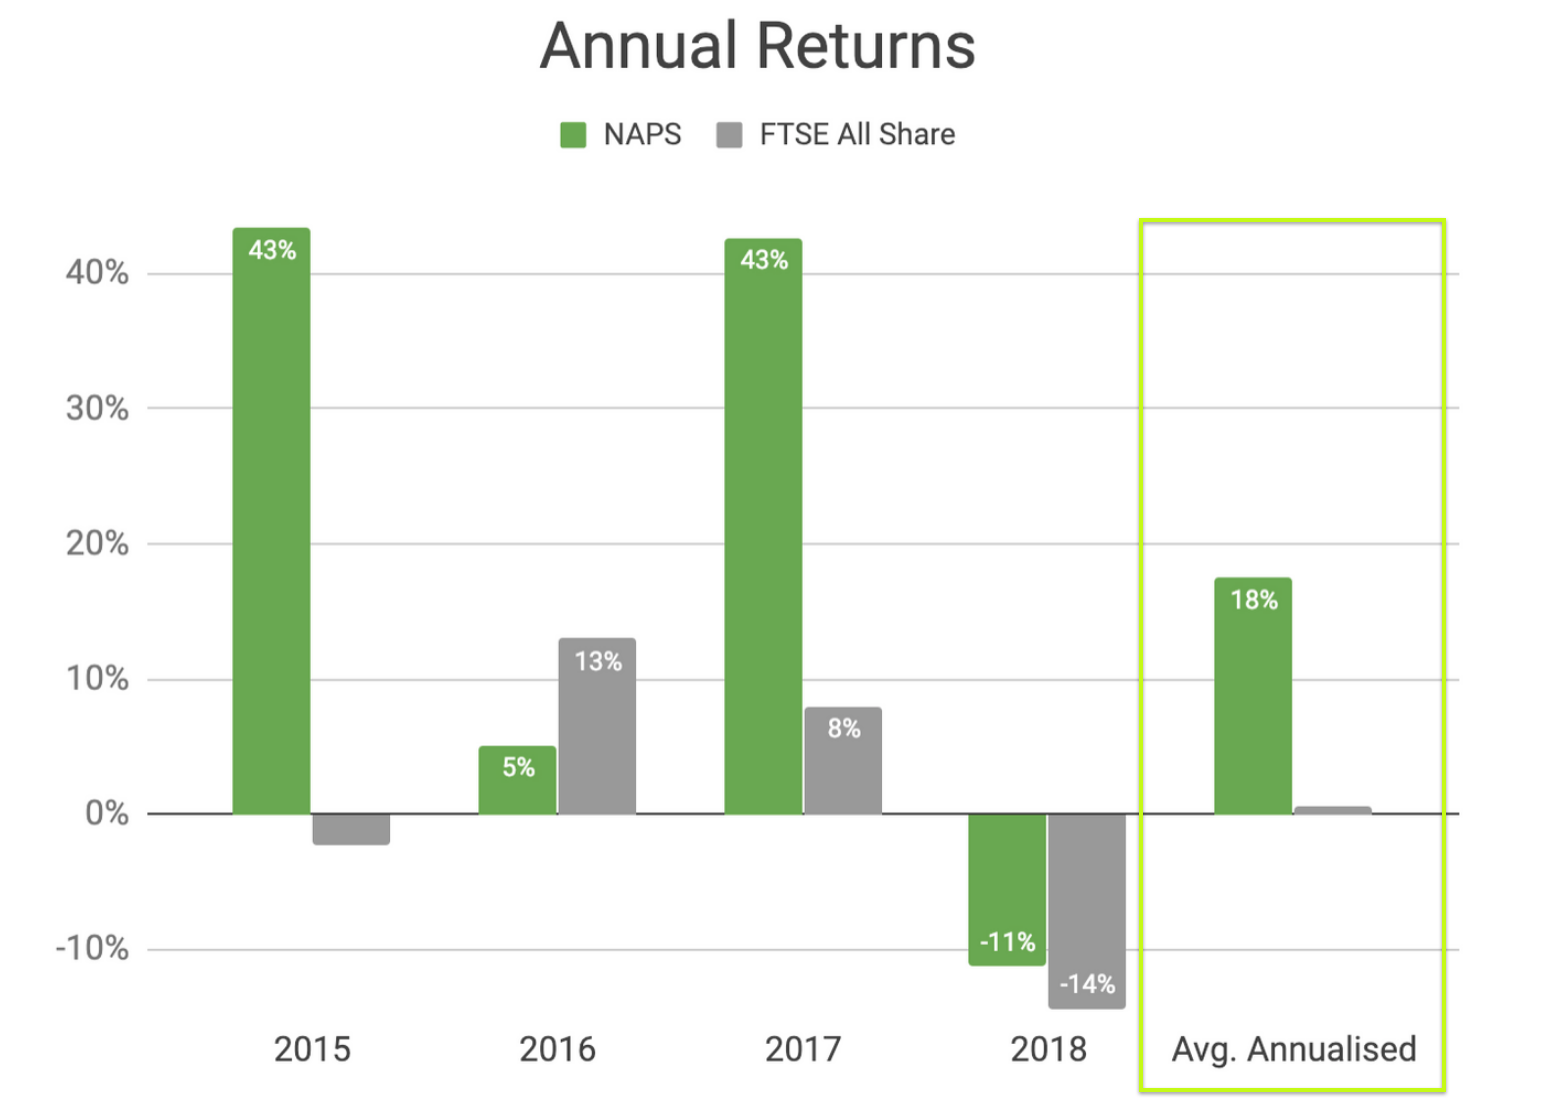
I don't want to treat a -11% return as a positive. Capital losses are frankly dreadful and nobody enjoys bearing them. But I do want to treat this loss in context. From the start of the project I've made it clear that my version of the NAPS is a fully invested, long-only portfolio. I'm not using any stop losses, and not trading intra-year to minimise losses. So negative years are to be expected. It's just the nature of stock markets. Significant downside volatility comes with the territory of long-only investing. No pain no gain.
Last week I posted a major analysis of nearly 100 years of stock market data. If you haven't yet read it, I recommend you do. It helps to set your expectations about the base rates of the stock market. History shows that the stock market falls roughly once every three years. In the UK we've seen two falls in the last four years and low returns, so the period in which the NAPS has been invested has been worse than the typical four year period from the study. But the NAPS have only fallen for one of these four years, and have returned more than 10% annualised above the long run average equity market return of 8%. Yes we might have been lucky - but this outperformance appears more and more significant as time accrues.
The NAPS has beaten all benchmarks
In each of the four years that I've written about the NAPS I've had a few comments critical of my choice of the FTSE All Share Index as benchmark for performance comparison. e.g.
- "Most individual investors invest in small caps so you should use a small cap index like the AIM All Share"
- "The FTSE All Share is market cap weighted and full of miners - you should use the FTSE 250 as it’s more representative"
The critique has been stronger in big up years like 2015 and 2017, as though some readers want to attribute all the outperformance to a small cap effect. But the NAPS is an all-cap strategy, full of mid and large companies, and the outperformance has been generated not just in up years... but also by reducing the downside in down years (such as 2015 and 2018).
The following chart should show that the choice of benchmark is a moot point. I've printed the full four year performance of the NAPS against seven different benchmarks - a range of UK FTSE indices, as well as the S&P 500 (as the major US benchmark), and an MSCI iShares All-World ETF (for the globally inclined). The NAPS has more than doubled the performance of the best benchmark (the FTSE AIM 100).
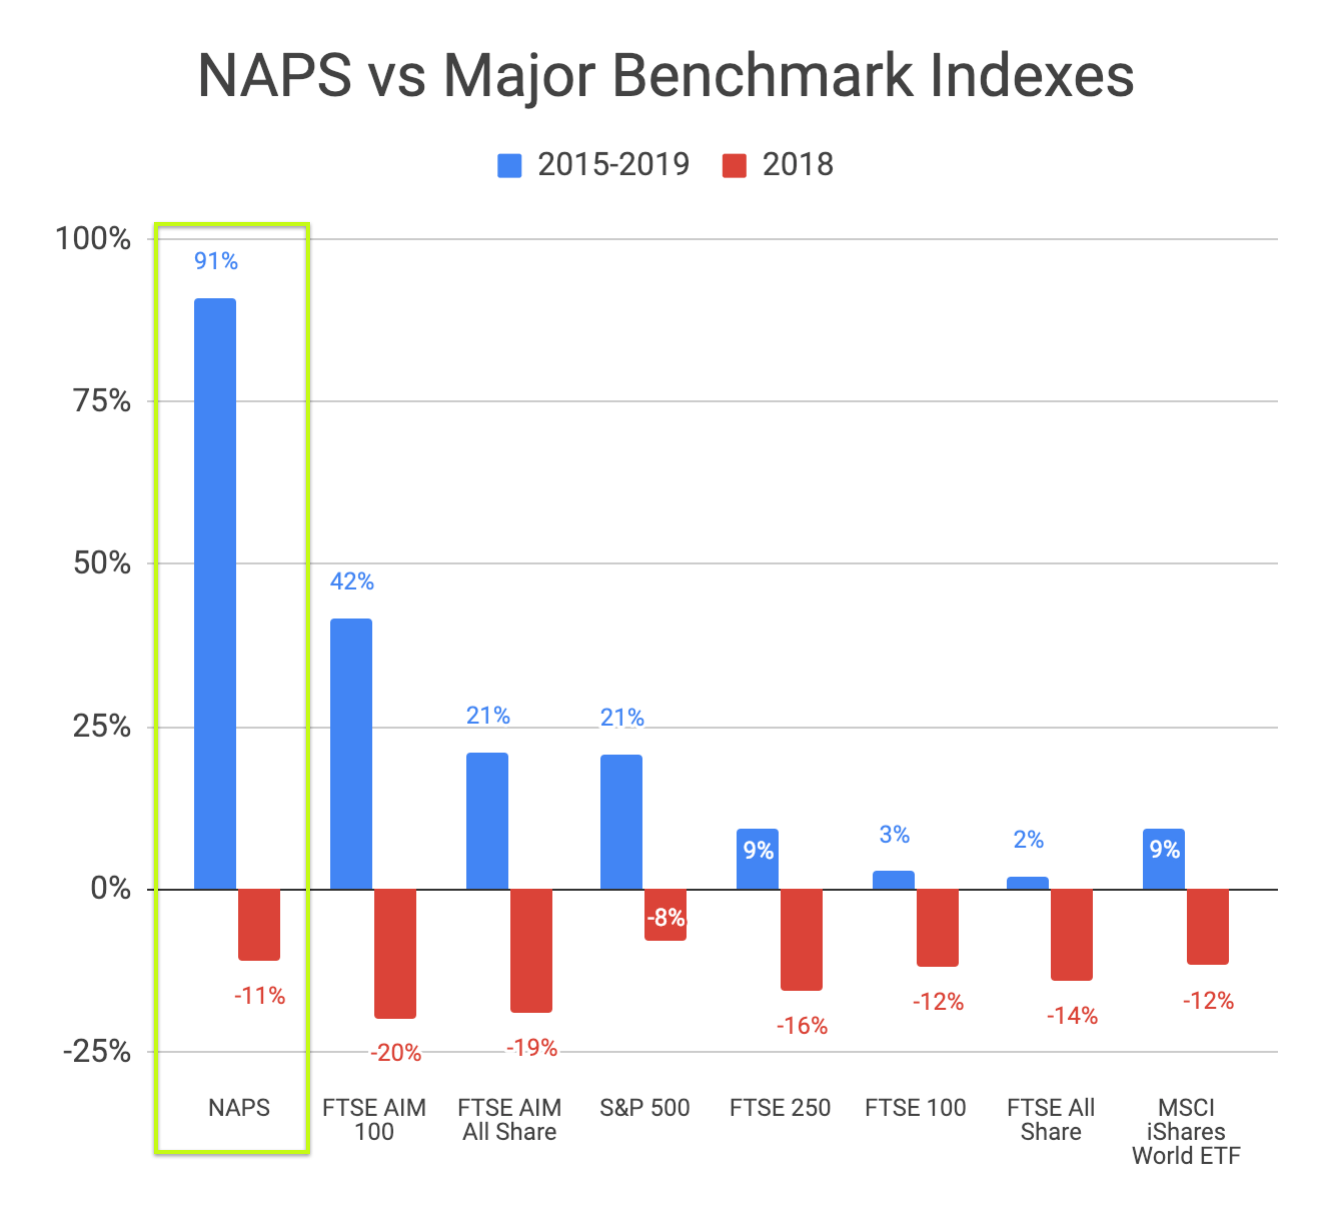
But more notable is the recent downside minimisation. Last year I showed that the portfolio had not only outperformed the FTSE All Share, but it had done it at a lower volatility/risk.
This year the NAPS has fallen less than every benchmark except the S&P 500. But if the S&P 500 is denominated in pounds rather than dollars, the NAPS would have outperformed all the indices in the set above.
It's the measures put in place to reduce downside risk that I will be discussing for much of the rest of this piece.
Winners and Losers in 2018
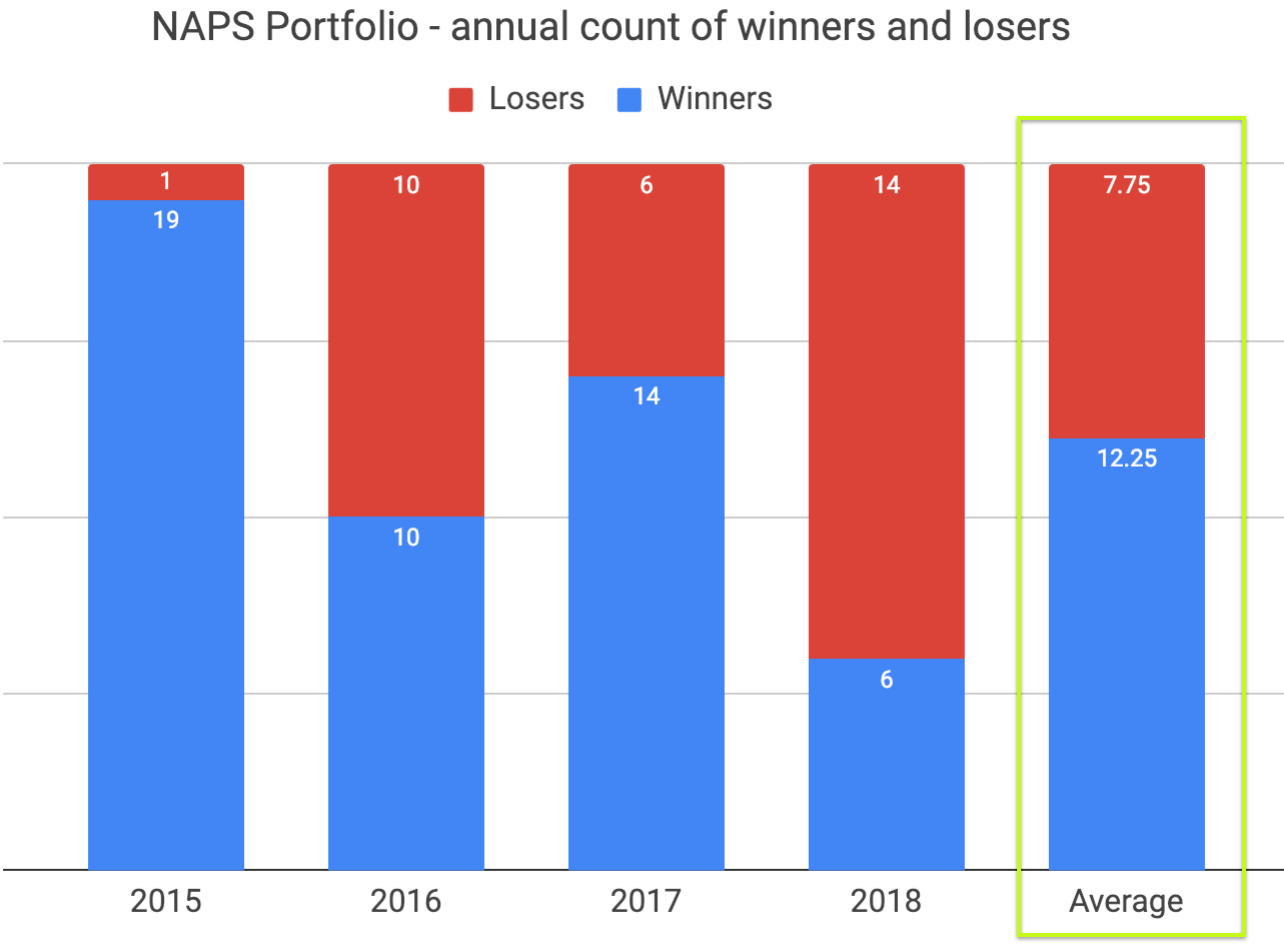
Unfortunately, being a down year, the win/loss ratio is not looking nearly as rosy as last year. Of the 20 stocks in the portfolio, 6 have shown a profit and 14 a loss. A complete inversion of the result in 2017. As you can see from the graphic below, this is the worst win/loss ratio since the inception of the NAPS. On average over the last 4 years though, the portfolio has maintained an annual win rate of 61.25% - i.e. 6 winners for every 4 losers per year.
The biggest winner of the year was Plus500 - the stock that everybody loves to avoid. PLUS runs a CFD business that profits from punters trading cryptocurrency. It's certainly not a stock that Buffett would buy. Indeed I hate the stock so much myself that I found my monkey brain wanting to manually ditch it from the portfolio at the start of the year. I'm very glad that I stuck with the method and ignored my biases. Without PLUS the year would have ended much more dismally.
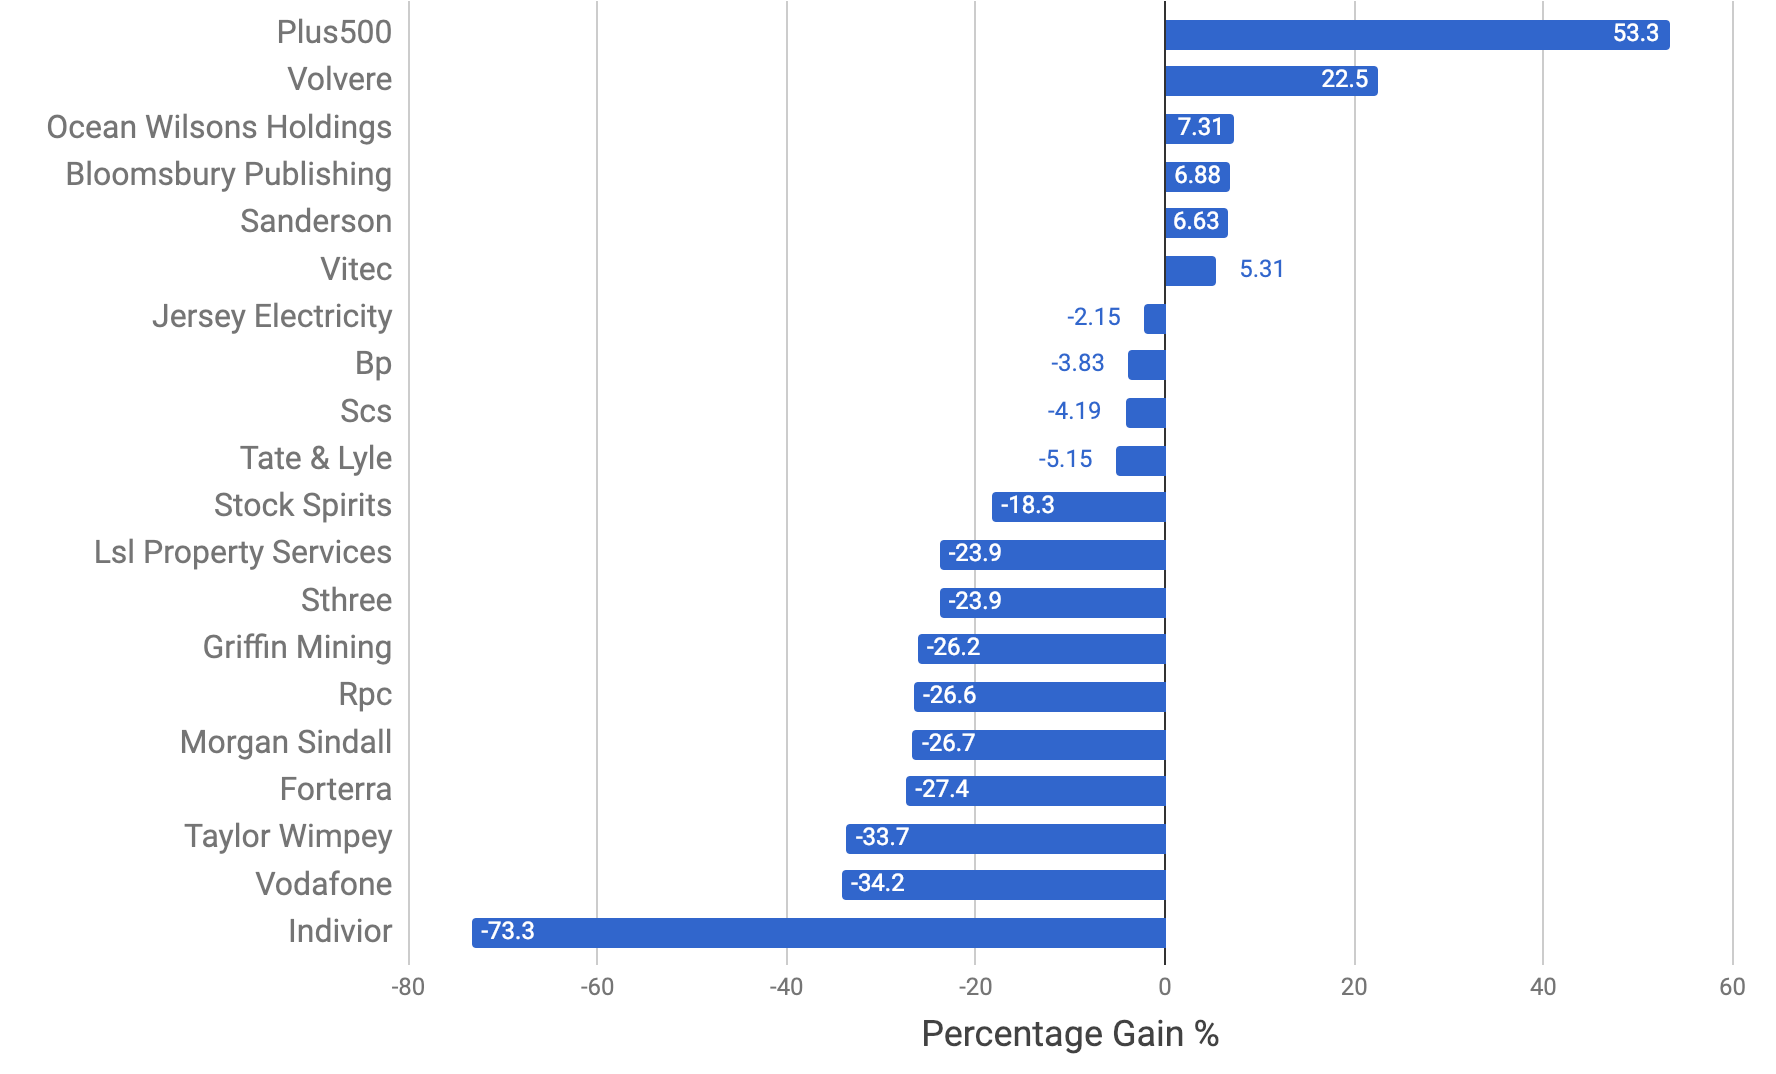
In the stock market your upside is potentially infinite but your losses are capped at 100%. We've seen 300% winners in the NAPS before (IQE, GAW) but this year we've seen our biggest loser - a full 73% lost in Indivior. But there are a few things to note regarding Indivior:
- At the start of the year Indivior was marked with a "Speculative" RiskRating. So a 45%→70% annualised volatility was to be expected on the upside or downside. While it's a bad loss, it's at the edge of normal for a stock of that volatility.
- At the start of the year a group of extremely wise readers mentioned that Indivior was facing significant risks in 2018 and wouldn't touch it. I'm not so smart, so I held it. Perhaps a smart human on top of the algorithm could add value. But the problem with discretionary decision making like this (for a time poor investor like me) is that I could have made the same rationale for avoiding Plus500. I'm happy to embrace the contrarian error rate, it has benefits as well as drawbacks.
- This is the third year in a row that Indivior has been owned by the NAPS. In the 2 previous years it was handsomely profitable. From a nominal starting portfolio of £100k, INDV made a pair of £3.5k profits and now a £7.8k loss... so overall it's been less than a £863 loss... which is less than 0.45% impact on the ending capital. INDV has fallen 43% since the first purchase at the start of 2015. A 43% loss in the stock’s price over 3 years was almost turned into an overall profit through annual rebalancing. Ben Hobson has written about this Robin Hood Rebalancing Alchemy of stealing from the rich to give to the poor before.
I'm actually a fan of stop-losses - and I think they would have helped the portfolio in 2018. But they don't sit well in a 'no-admin-portfolio-system' so I chose early on not to use them. The theory and practice of stop losses is that they don't tend to increase your upside, but they do minimise your downside. I know a lot of subscribers who do use them are currently 'stopped out' and holding a lot of cash right now. They may have ensured their overall 2018 drawdown is less than 11%, but at the potential cost of being a late participant in any rallies from the lows.
What's protected the portfolio - sector or risk diversification?
The original NAPS began as the Noah's Ark of investing. 2 stocks from each sector, chosen for their handsomeness according to the StockRank. Nice and simple.
But over time, and as the tools have developed at Stockopedia, I've sought broader forms of risk management. After the first year I spread the holdings more evenly across Size Groups - to diversify away from the micro caps that had burned me before in bear markets. Then I took if further, and diversified more evenly according to each stock's volatility using the RiskRatings.
If you haven't read the RiskRatings eBook - then download it and read it today. I'm biased but I do believe it's a groundbreaking innovation for individual investors. It provides an 'at a glance' classification of each share into one of 5 risk buckets - Conservative, Balanced, Adventurous, Speculative and Highly Speculative. We publish them at the top of every StockReport. If you use them, you really know what to expect from a share's price action.
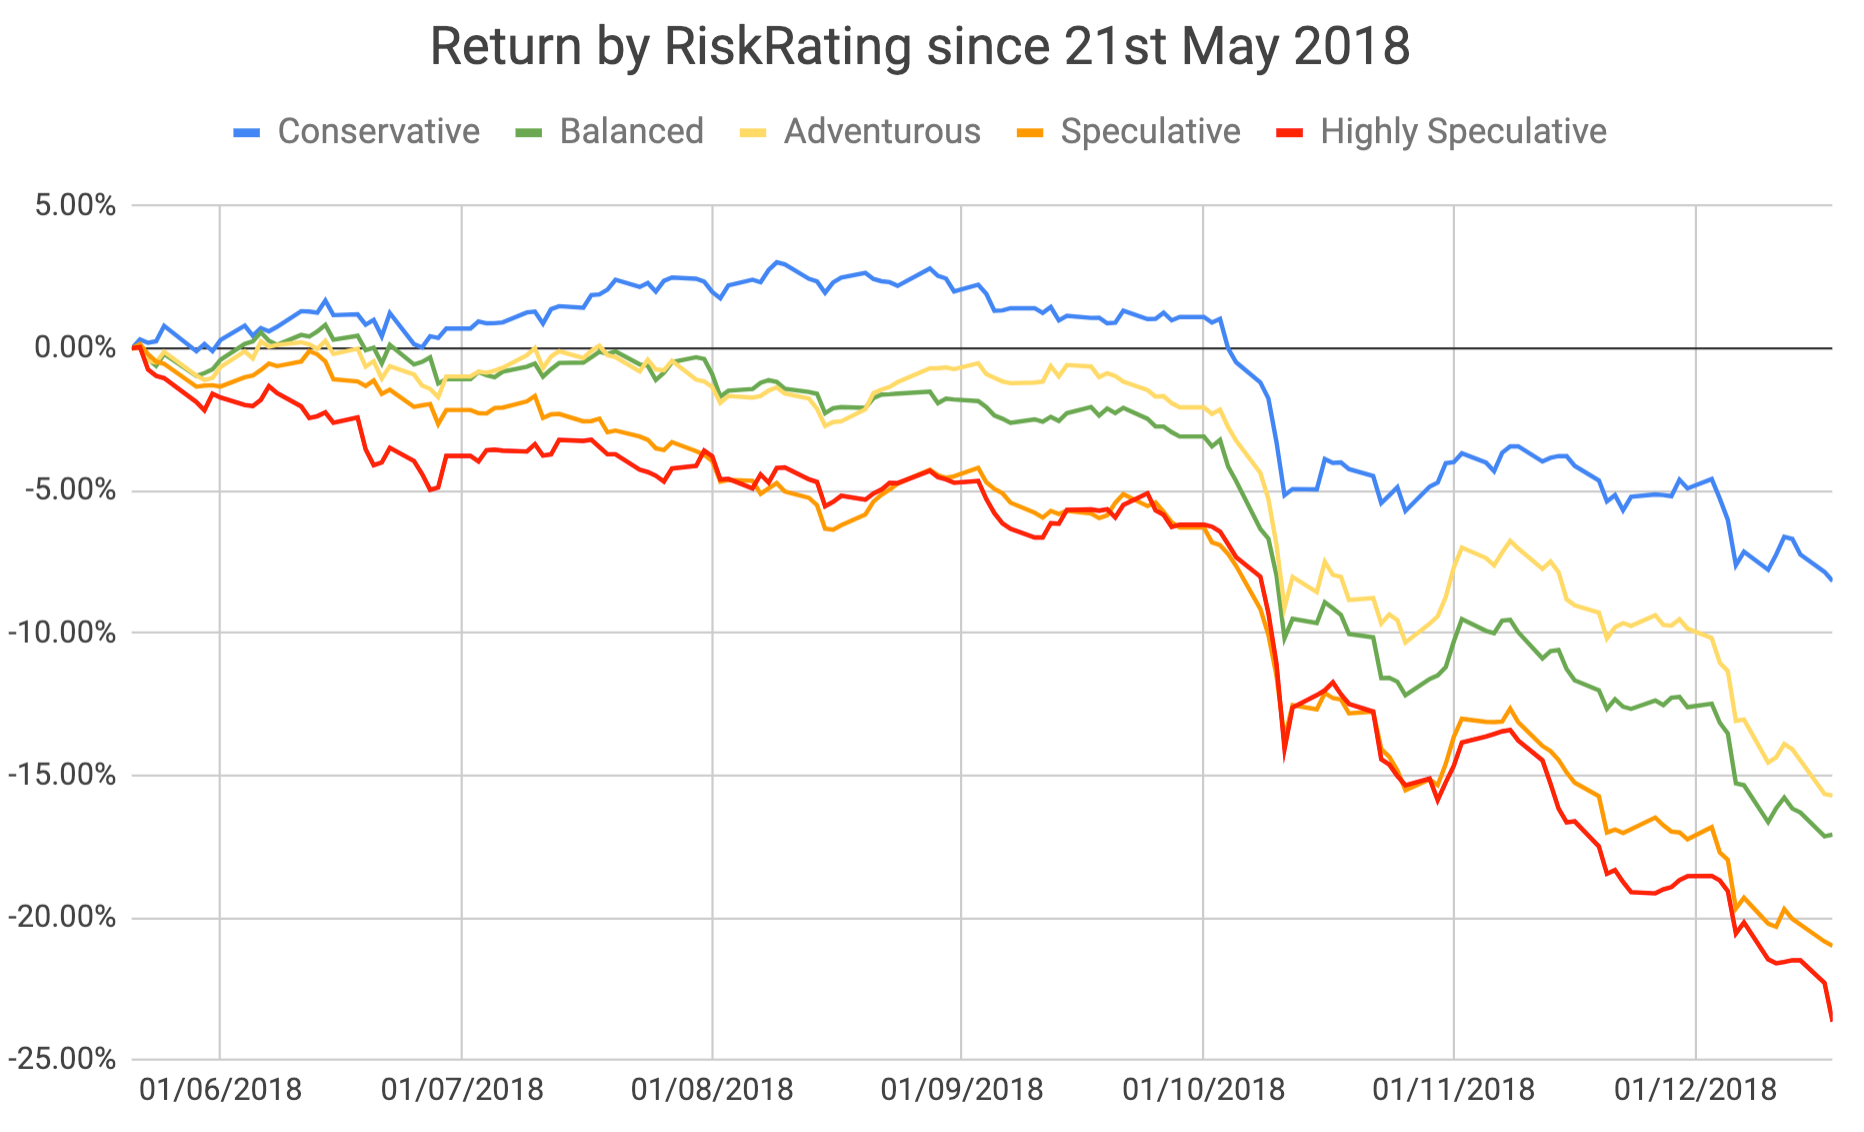
Since the market topped in May 2018, lower volatility shares have significantly 'outperformed' the rest of the market, while higher volatility shares have crashed. This is neatly summarised by the following chart produced by Oliver Cooper. Conservative (low volatility) shares in blue have fallen far less than Speculative (high volatility) shares.
This is all very well across the whole market but do the RiskRatings really have the same impact in a small portfolio? Well to answer this question I've aggregated the performance of the 2018 NAPS positions into their respective RiskRating buckets and created the charts below. The losses endured by "Conservative" (low volatility) shares have been far lower than any of the other classifications. And if we remove the anomaly of Plus500 from the "Speculative" bucket you can see the trend even more clearly. Increasingly volatile shares have had a far higher downside contribution. Conservative → Balanced → Adventurous → Speculative.
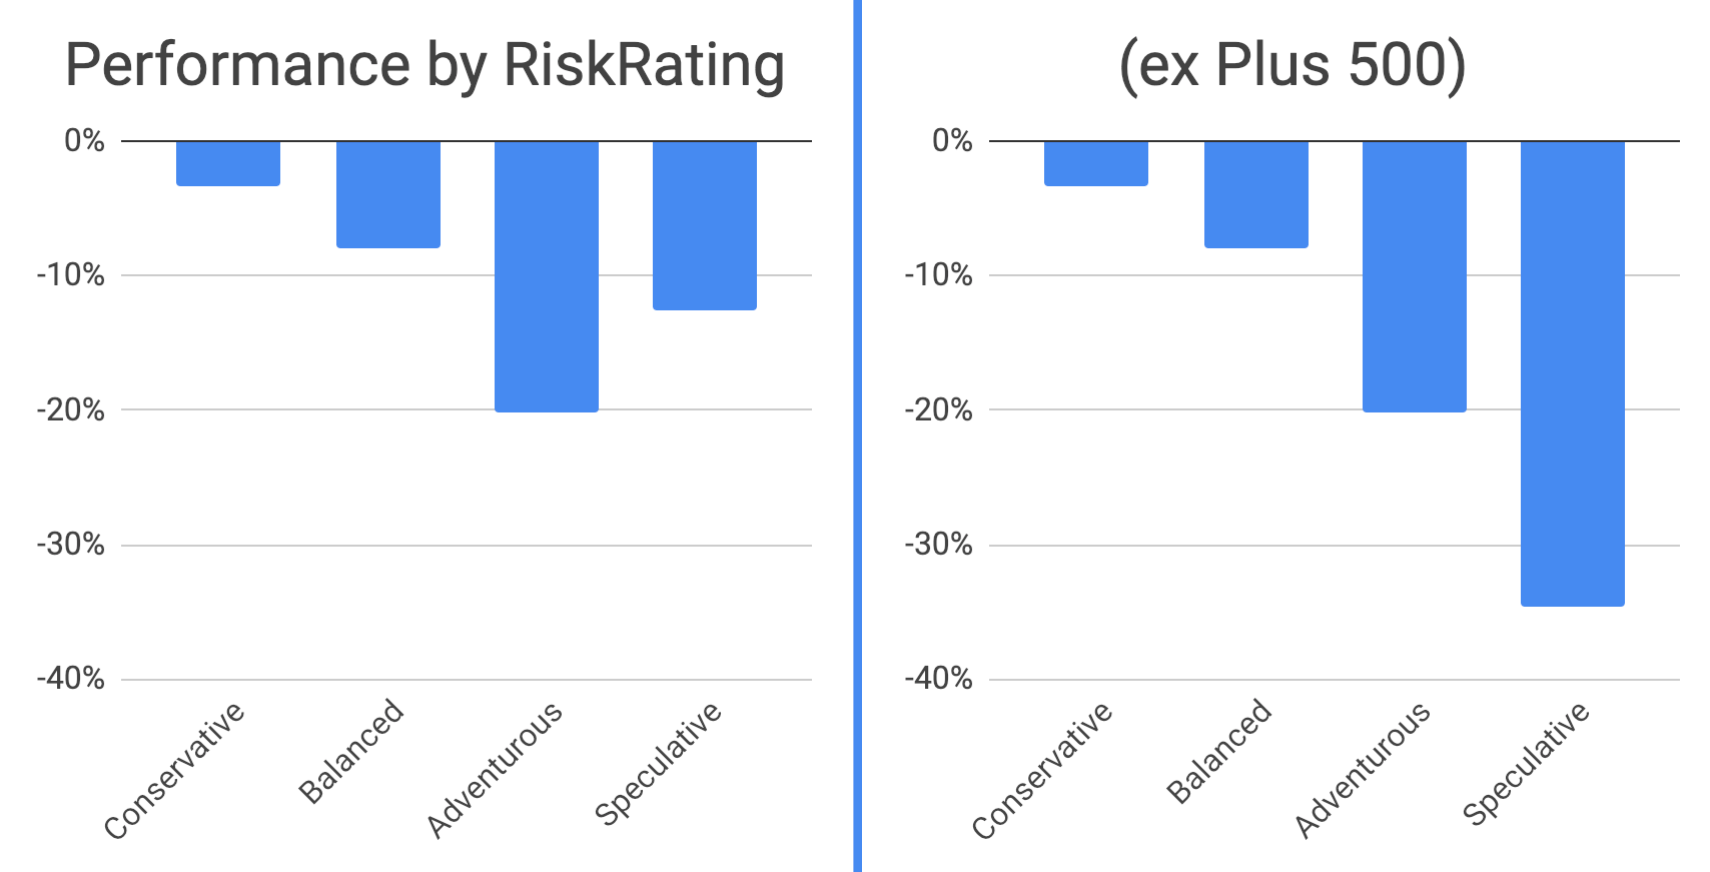
When I initially forced half of the NAPS Portfolio into lower volatility shares I was anxious. If the bull market kept roaring ahead would the portfolio lag the market? What falls less fast, also tends to rise less fast... there's a symmetry to risk.
But the market did fall, and the prudent diversification really paid off. Without the Conservative & Balanced spine of the portfolio, the NAPS would have fallen by far more than 11%. I think the intelligent use of the RiskRatings has made a fundamental contribution to the NAPS outperformance vs major benchmarks.
Defensive Sector Diversification failed...
Here's a couple of charts to show the performance of the NAPS positions by sector. Ironically, in a year where recession and Brexit fears have come home to roost, the "Cyclical" sector picks have outperformed the "Defensive" sector picks.
The observant will comment that Indivior is absolutely NOT a defensive stock... and I completely agree. My point is that traditional sector classification naming schemas can be misleading. It is far more prudent to use measurable volatility as a predictor of future downside risk (represented by the RiskRatings) than an arbitrary sector classification (such as "Defensives").
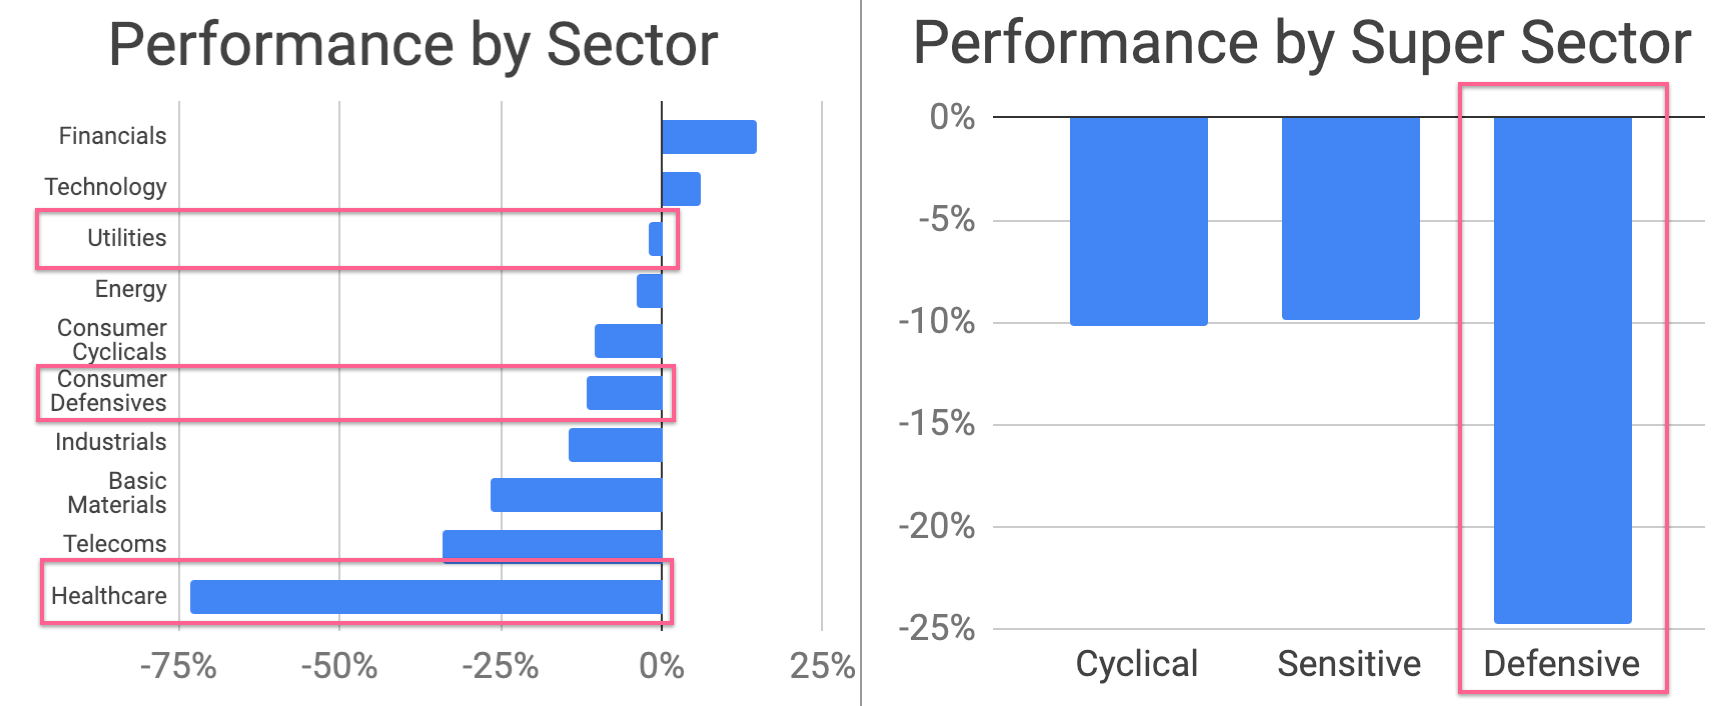
I am not suggesting that we throw sector diversification out of the window. It's prudent to spread bets across different areas of the economy as sectors peak and trough at different times. But if you want to minimise your downside volatility during substantial market corrections (such as December 2018) then you absolutely must prioritise the ownership of low-risk, low-volatility stocks.
This is why I advocate the use of a bar-bell portfolio. Owning Conservative low-volatility shares provides spine to a portfolio, but owning Speculative shares provides thrust. Spine and thrust mean you can protect yourself in down markets, but participate strongly in up markets.
Which factors work best in which market environment?
Adding in a blend of lower volatility stocks has clearly helped enormously in the poor market of 2018 but is it likely to hold us back in an up market? Yes quite possibly. But I have absolutely no crystal ball. Lots of intelligent market forecasters are predicting a volatile year in 2019, and my own study last week confirmed this likelihood. But it could be volatile up or down.
There's a growing body of research that attempts to discern which factors (Quality, Value, Momentum, Size, Volatility etc) are the best 'plays' for different stages of the market, or economic cycle. One piece that caught my eye was from Amundi Asset Management called "Equity Factor Investing according to the Macroeconomic Environment", from which I'll be quoting.
In this 2015 piece they define four stages of the economic cycle (expansion, deceleration, recession and recovery) using US NBER data, and calculate the performance of individual factor-based portfolios in each. The table below shows which factors over or under-perform in each state of the cycle. Most of these factors map neatly Stockopedia ratings data. Quality, Value, Momentum and Growth to a variety of StockRanks, Minimum Volatility to the RiskRatings etc.
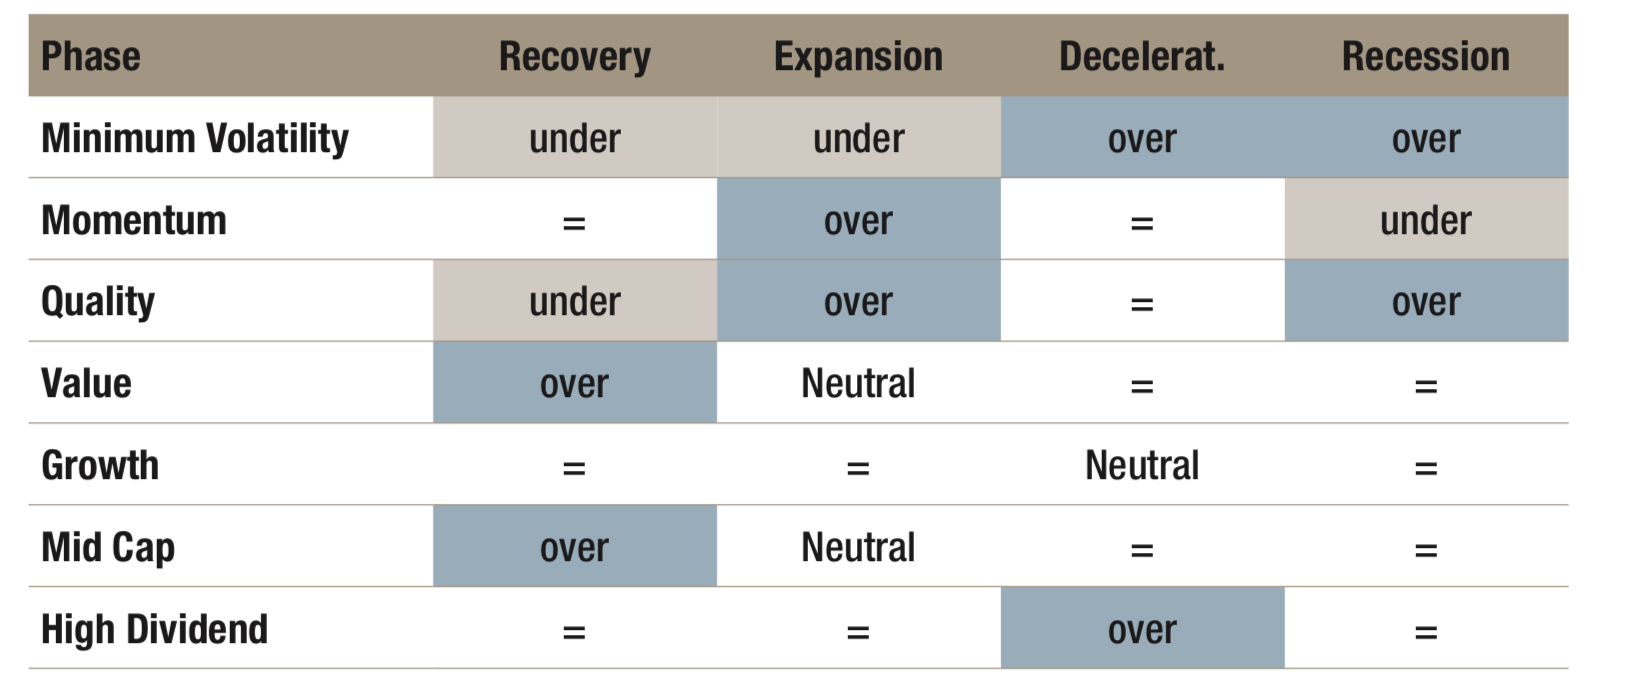
While we aren't in a recession at this stage, the risks are picking up. Most believe there's a deceleration going on. So from this perspective it's best to focus on lower Volatility, higher Quality, higher Dividend stocks. Value stocks tend to do best in recovery, and Momentum tends to do best in expansion. Should we switch our strategy away from High Flyers and into Conservative Quality?
Well there are risks in factor timing and it's notoriously difficult to get it right. I've been designing the NAPS Portfolio as an all-weather strategy and not trying to be too clever. Yes I'm a little concerned that the significant exposure to Value stocks (like Wincanton and Dart) may bite in a downturn, but there is a lot of research that suggests that a diversified all-factor Q+V+M approach may remain performant. Perhaps the more agile among you will attempt to factor-time these swings. If you do, please do keep us updated.
2019 Selection Rules
So after all the above musings, and in the interests of consistency, I've decided to stick to the 2018 selection rules with only very minor tweaks.
The 2019 NAPS Portfolio rules select:
- The top 20 stocks in the UK ordered by descending StockRank qualifying for the following constraints:
- Diversification:
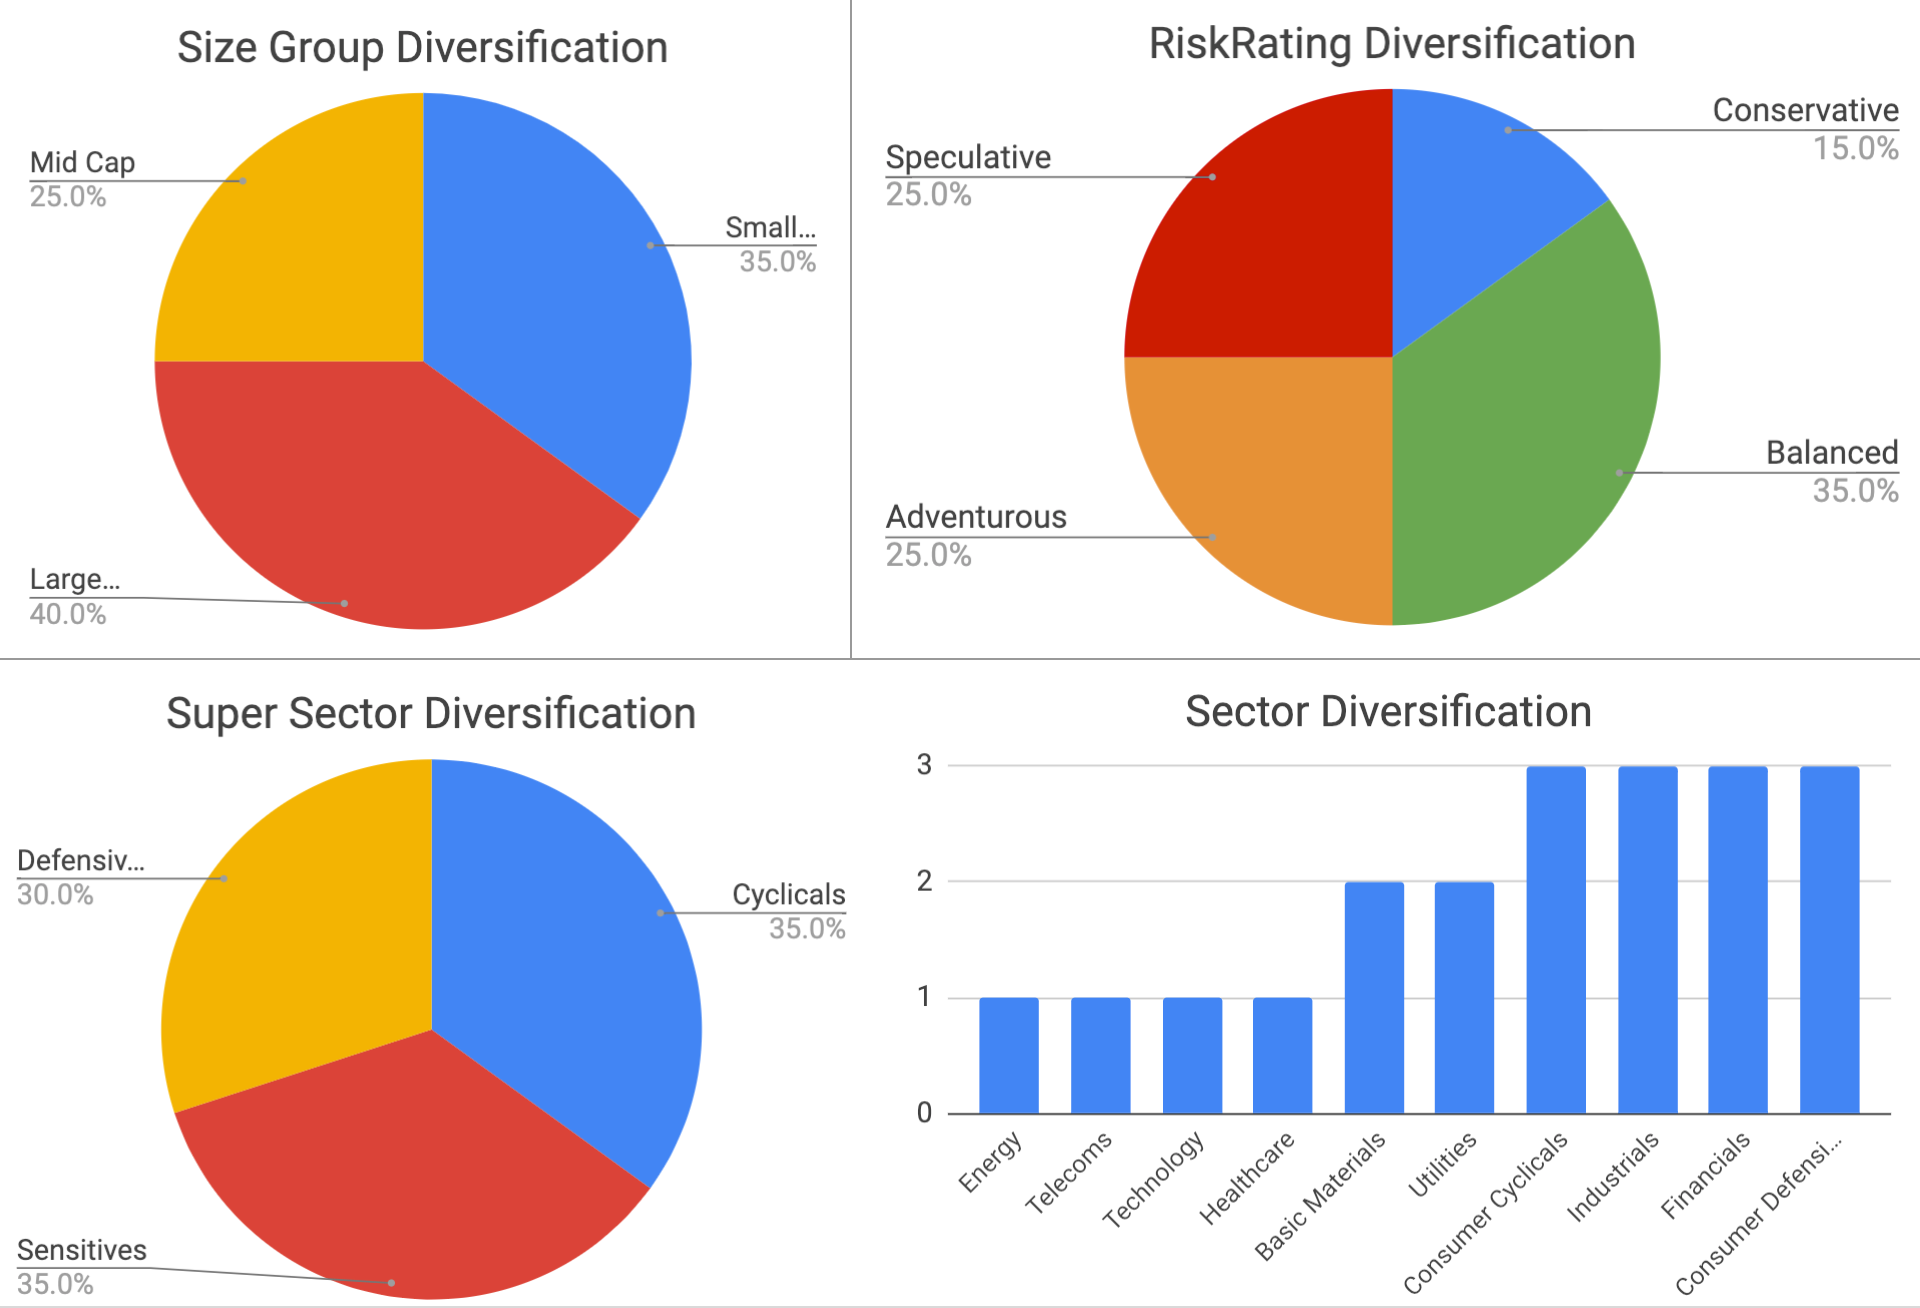
- by Sector - Maximum of 3 from each sector, and no more than 1 in any industry group.
- by Size - no more than 8 stocks in any of the large, mid or small cap buckets.
- by Risk - Half the portfolio in lower volatility RiskRatings (Conservative & Balanced) and half in higher volatility RiskRatings (Adventurous & Speculative). No extreme volatility Highly Speculative stocks.
- Tradability:
- by Size - A minimum market capitalisation of £50m.
- by Liquidity - A bid-ask spread of less than 5%.
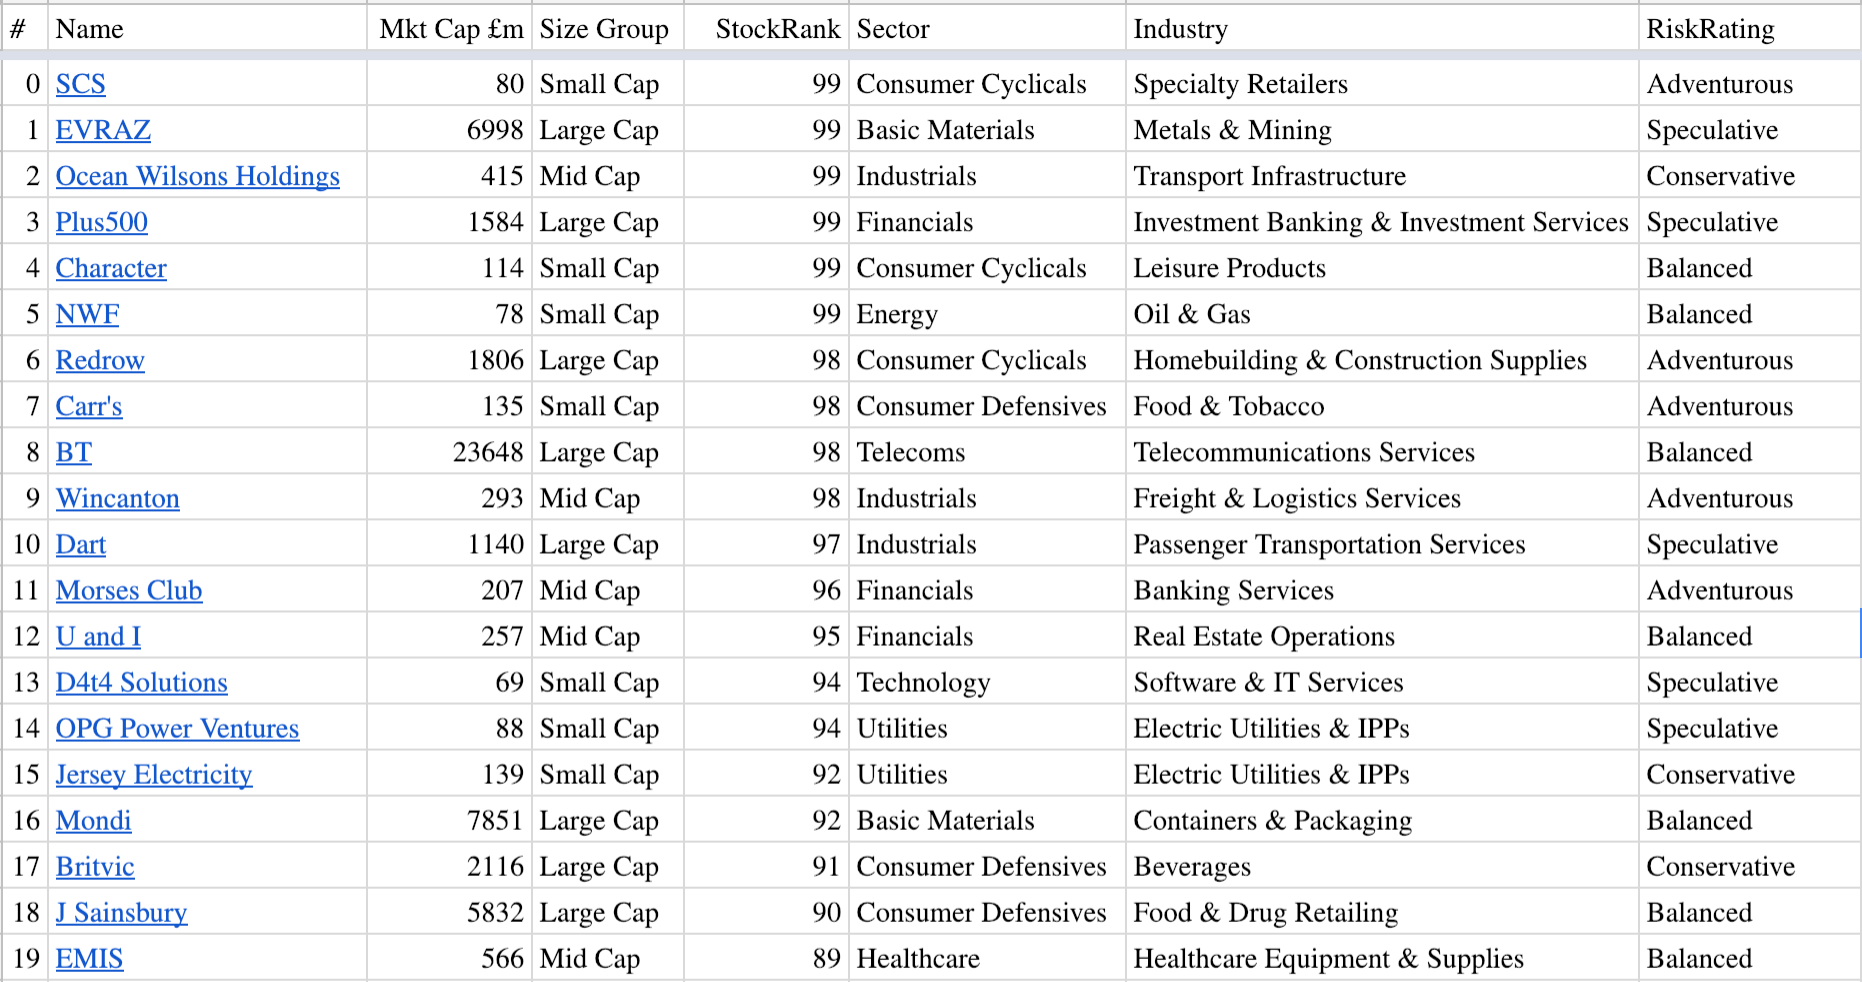
The resulting portfolio is diversified across size, risk and sector as below. There's zero discretion involved (aside from selecting the strategy). What worries me? Well there's only one from each of the healthcare and technology sectors but two utilities. If I was applying discretion I might seek some additional exposure in those two sectors. But then again, we've had some nice winners in utilities, and perhaps there's a reason they are in vogue again. Spine and thrust, spine and thrust. I'm also concerned that there are only 3 "Conservative" RiskRatings in this set. I'd rather we owned 5. But this is how the cards have fallen, and I will stick to them.
Before I handover to the analyst team I wanted to make a couple of asides.
- Firstly, I may end my running of the NAPS Portfolio series at the end of the year. It will have been a full 5 year period and my personal investing interests are moving onwards. For those concerned, this does not mean that the NAPS Portfolio will cease to exist, but it may mean that it's put more on autopilot or handed over to the team to run. I'm keen to explore a more focused, actively invested, systematic portfolio as a diary on the site. I haven't thought of a good acronym yet, but perhaps the HATS (high-admin-timing-system) will do. No promises, but watch this space.
- It's been 18 months of change at Stockopedia. We've grown from 12 staff to 25, and the organisation has changed shape considerably. My time has been pulled away from writing and research over this period, but I've now repositioned myself away from the operational side, back to the research and content side. I'm hoping that I'll have a lot more time to think, write and make videos. I hope you haven't been completely un-entertained by these long articles as you may be in for more regular musings in 2019.
The 2019 Portfolio
Thanks to Ben Hobson and Jack Brumby for their excellent work writing up all the 2019 portfolio selections. There are a few that naturally make me extremely nervous - but if you've toiled through 90 minutes of the 5 year StockRank Webinar you'll know that factor investing requires frogs to be eaten whole. With Plus500 and Wincanton in the list there's plenty for the community to comment about as they obviously have some big downside risks. If the regulators or rate-setters don't blow them up, then you never know, one of them might just end up a winner in 2019. All I do know is that the big winners are always a surprise. Perhaps you'd be willing to have a guess which will do best in the comments below?
Safe Investing once again for 2019.
Ed
Consumer Defensives
Carr’s Group
Sector: Consumer Defensives / Food & Tobacco
Market Cap: £135m, Stock Rank: 98
Risk/Size/Style: Adventurous, Small Cap, Super Stock
Carr's Group has two operating segments. Its Agriculture division sells animal feed and equipment to farmers in parts of Britain, Germany, the US, and New Zealand, while its Engineering division provides remote handling equipment and fabrications to the nuclear, oil and gas, and petrochemical industries. Weak demand for animal feed in the US and a major contract delay in its UK manufacturing business saw Carr's net profit nearly halve in FY2017 but the company has confirmed a swift recovery in subsequent trading updates as a result of increasing demand in its agricultural markets, investment in operations and acquisitions. In the group’s full-year results in November, Carr's chairman Chris Holmes said: “The breadth of our product offering, investments in acquisitions and research, and our international footprint leaves us well positioned for further growth across both our divisions in the medium term.”
Britvic
Sector: Consumer Defensives / Beverages
Market Cap: £2.12bn, Stock Rank: 91
Risk/Size/Style: Conservative, Large Cap, High Flyer
Britvic, the soft drinks maker and distributor, had a solid year in 2018 and its shares were largely unaffected by the market downturn late in the year. Better than expected earnings came as the company benefited from a trend towards low sugar drinks in the UK.
Britvic boasts some decent quality traits, including consistent double-digit margins. Its return on capital has come under pressure in recent years but is still robust at 15.6%. Brokers upped their earnings forecasts for 2019 in response to last year’s earnings beat. As such, Britvic displays the classic high quality, strong momentum characteristics of stock market High Flyers.
In the full year results in November, Britvic chief executive Simon Litherland, said: "Whilst political and economic uncertainty will undoubtedly continue, we are confident we will continue our long-term track record of growing earnings, dividends and shareholder value."
J Sainsbury
Sector: Consumer Defensives / Food & Drug Retailing
Market Cap: £5.8bn, Stock Rank: 90
Risk/Size/Style: Balanced, Large Cap, Super Stock
The UK grocery market is incredibly competitive. Price wars and the battle for market share have been exacerbated in recent years by new threats from discount stores like Aldi and Lidl and the spectre of online players like Amazon entering the fray. But Sainsbury’s has been taking the fight to the competition. First it bought Argos and now it’s attempting to get approval to join forces with Asda. New store formats, new staff contracts and work on a new banking platform have been costly but necessary.
Grocery retailing is a low margin business but on the upside Sainsbury’s has a consistently solid earnings track record. If its strategy pays off then buying it on an apparently cheap rating could pay off handsomely.
In the interim results 2018, Mike Coupe, Sainsbury's chief executive, said: “Our proposed combination with Asda will create a dynamic new player in UK retail, with the ability to further lower prices and to reduce the cost of living for millions of UK households.”
Consumer Cyclicals
SCS
Sector: Consumer Cyclicals / Speciality Retailers
Market Cap: £80m, Stock Rank: 99
Risk/Size/Style: Adventurous, Small Cap, Super Stock
SCS Group sells furniture and flooring, with a focus on fabric and leather sofas. It has had a lukewarm reception since listing in early 2015 despite paying large dividends year-in, year-out. Today, its forecast dividend yield is c7.5 percent and is covered 1.6 times by earnings. What’s more, the group’s shops generate lots of cash, meaning SCS’s cash flow from operations was comfortably ahead of net income in 2018 (£17.9m vs. £10.2m).
The group had this to say in its AGM update in November: “We believe the group's increasing resilience and value proposition will enable us to manage the continued economic uncertainty and take advantage of opportunities.”
Character Group
Sector: Consumer Cyclicals / Leisure Products
Market Cap: £114m Stock Rank: 99
Risk/Size/Style: Balanced, Small Cap, Super Stock
Character designs, develops and distributes of toys, games, and giftware. The company encountered a tricky year in 2018. It was the demise of iconic toyshop chain Toys ‘R’ Us that did the damage but the group survived this difficult patch and management now sounds much more optimistic about the group’s prospects. The company boasts a return on capital of nearly 37 percent and a free cash flow yield of 7.9 percent but only trades on a forward PE ratio of 11.
In its full-year update in November 2018, the company said:
“The new financial year has started well and in line with management expectations; we are confident in the prospects for the current autumn/winter trading period, which includes the all-important Christmas season.”
Redrow
Sector: Consumer Cyclicals / Homebuilding
Market Cap: £1.81bn, StockRank: 98
Risk/Size/Style: Adventurous, Mid Cap, Super Stock
Redrow is a developer of residential housing in England and Wales, where it has approximately 100 live developments. Its range of properties include Heritage Collection, Regent Collection, Abode Collection and Bespoke Collection.
Although the London sales market remains subdued due to Stamp Duty Tax and Brexit uncertainty, Redrow continues to see strong demand in its regional businesses.
The group qualifies for a total of 16 Guru Screens and boasts Quality, Value and Momentum ranks of 98, 87 and 75 respectively. With a 2018 dividend yield of 5.7% covered three times by earnings, a price-to-book value of 1.23 times and high Quality metrics, Redrow shares continue to look attractive despite the strong performance over the past few years.
In the group’s November AGM statement, Morgan commented: “Redrow has an industry leading, highly desirable product, an excellent forward sales position and a very healthy balance sheet. We are in great shape to deliver another year of progress for the business.”
Basic Materials
Evraz
Sector: Basic Materials / Metals & Mining
Market Cap: £6.99bn, Stock Rank: 99
Risk/Size/Style: Speculative, Large Cap, Super Stock
Evraz is a steel, coal mining and vanadium business based mainly in Russia but with operations in territories ranging from the United States and Canada to the Czech Republic, Italy and Kazakhstan. Its production of 14 million tonnes of steel in 2017 placed it among the top producers in the world.
In 2017 it swung from several years of net losses to a profit of $700 million. This year that net profit figure is forecast to reach $1.9bn. Debt has been falling in recent years as cash flow has started to rise. Margins and return on capital have leapt as rising steel prices have fed through to the company, and its balance sheet now looks solid.
In the interim results last year, Evraz's chief executive Alexander Frolov, said: “In the first half of 2018, the group delivered a solid financial performance, supported by the ongoing improvement in the global steel market environment. In the second half of the year, despite possible price correction, we expect market conditions to remain positive overall.”
Mondi
Sector: Basic Materials / Containers & Packaging
Market Cap: £7.8bn, Stock Rank: 92
Risk/Size/Style: Balanced, Large Cap, Super Stock
Integrated paper and packaging giant Mondi has been a regular fixture in the Naps and Snaps portfolios in recent years. It has a solid track record of earnings growth and brokers love it, which you can see in a consistent run of earnings forecast upgrades through last year. Mondi’s quality characteristics are also strong with its return on capital and operating margins both well into double figures.
The numbers are supported by a well refined business model whereby Mondi manages its own forests and takes raw materials such as wood fibre, which it processes in its pulp and paper mills and turns into packaging and paper.
In a trading update in October 2018, the company said: “With our robust business model and culture of driving performance, we remain confident of continuing to deliver an industry leading performance, and sustaining our track record of delivering value accretive growth.”
Industrials
Ocean Wilsons Holdings
Sector: Industrials / Transport Infrastructure
Market Cap: £415m, Stock Rank: 99
Risk/Size/Style: Conservative, Mid Cap, Super Stock
Bermuda-based Ocean Wilsons Holdings is an investment holding company with two main subsidiaries. Wilson Sons provides a variety of maritime services in the port terminals of Brazil, while Ocean Wilsons Investments runs an investment portfolio with roughly $275m of assets under management. Its maritime services include towage, port terminals, ship agency, offshore, logistics and shipyard services.
The stock scores well against our QVM framework and brokers have upgraded their earnings per share forecasts for the stock recently. Interestingly, Ocean Wilsons calculates its own net asset value per share as £16.21 compared to a share price of around £12.
Management said in the company’s recent first quarter update:
“The company remains focused on increasing cash flow and improving capacity utilisation across all businesses in order to maximise value for stakeholders.”
Wincanton
Sector: Industrials / Freight & Logistics Services
Market Cap: £293m, Stock Rank: 98
Risk/Size/Style: Adventurous, Small Cap, Super Stock
Wincanton is a logistics business and it has long been a marmite stock among investors. On the upside, it has a strong record of earnings growth and it put out some solid trading updates through 2018. Debt, which has dogged the investment case for many years, has fallen substantially. The downside is that Wincanton’s pension deficit is still considerable and payments to fund it account for half of the company’s profits. If interest rates were to rise, the pension problem could ease, but until then, the weak balance sheet is something that deters value investors like Paul Scott.
That said, shares in Wincanton had a strong year in 2018 and they resisted the broader downward pressure, reinforcing the view that this is a very much a value and momentum play.
In a trading update in October, the company said: “The group has continued to experience good levels of trading in the first half of the year and the board expects results for the financial year to 31 March 2019 to be in line with expectations.”
Dart Group
Sector: Industrials, Passenger Transportation Services
Market Cap: £1.14bn, StockRank 97
Risk/Size/Style: Speculative, Mid Cap, Super Stock
Dart Group makes it back to the NAPS Portfolio as its valuation has moderated and price action remained robust in 2018. As one of the biggest long term Stockopedia winners, well publicised early on by David Stevenson in the FT, it's familiar to many subscribers. But it's even more familiar to lovers of the TV Show Love Island who book flights on Dart's Jet2.com airline with abandon. In spite of deeper H2 losses, the analyst community almost doubled their profit forecasts for 2019 for Dart putting it on a very low forward PE Ratio of 8.9x. Many in the investment community are worried that Dart is cyclical and could suffer if consumer sentiment continues to plummet post Brexit. The question is whether those worries are fully priced in.
Chairman Philip Meeson stated at the half year: "Our strategy for the long term remains consistent - to grow both our flight-only and package holiday products. On the assumption that the UK Government secures a pragmatic and balanced Brexit agreement with the EU, the outlook remains bright and we continue to have confidence in the resilience of both our Leisure Travel and Distribution & Logistics businesses."
Financials
Plus500
Sector: Financials
Market Cap: £1.58bn Stock Rank: 99
Risk/Size/Style: Speculative, Mid Cap, Super Stock
Plus500 is an international financial firm that divides opinion among investors. It provides online trading services in contracts for difference (CFDs) across various markets. Recently, business has been good for the financial trading firm. Its shares have shot up by more than 400% since January 2017 but they still only trade on around 8 times forecast earnings. Regulators continue to eye the Contracts for Difference and Spread Betting sub-sector, but Plus500 has rolled with the punches (chucking off bags of cash in the process) and has profited from the cryptocurrency boom.
Plus500 chief executive, Asaf Elimelech, said in a recent update: "We believe we are in a good position for 2019 and continue to focus on acquiring high value customers as well as growing in existing and new jurisdictions."
Morses Club
Sector: Financials / Banking Services
Market Cap: £207m, Stock Rank: 96
Risk/Size/Style: Adventurous, Small Cap, Super Stock
Morses Club is a home collected credit business, and in the 12 months to its half-year at the end of August its net loan book grew by 4.3% to £68m. Doorstep lending is an area of the consumer credit market that’s coming under a lot of scrutiny from the FCA. Morses says it’s doing all the right things, but it looks like the market is still wary. The stock has the profile of a solid, growing and high quality business with strong margins. The shares have resisted the pressure of falling markets through 2018 but still don’t look outrageously expensive.
In its interim results in October, Morses’ chief executive Paul Smith, said: “Our focus on successful integration, the sustainable growth of the loan book and high-quality lending has resulted in a robust performance across all of our key financial metrics and delivered significant earnings growth for investors.”
U and I
Sector: Financials
Market Cap: £257m, Stock Rank: 95
Risk/Size/Style: Balanced, Small Cap, Super Stock
Formerly known as Development Securities, U and I is a property regeneration business which specialises in taking unused brownfield sites and transforming them into something new. Its share price easily outpaced the falling market in 2018 and the business looks to be performing well. Brokers upgraded their EPS forecasts through 2018 but the cyclical nature of U and I’s sector means the shares continue to look relatively cheap. So this is very much a value and momentum play that will hopefully continue to perform well given the positive conditions in the sector.
In its interim results last October, Matthew Weiner, chief executive of U and I, said: “We are confident that we have the strategy, team and pipeline to meet our £45-50 million development and trading target for the full year and we remain well placed to benefit from the shortfall of quality mixed-use schemes, which continue to drive strong demand in our key, high-growth, geographies of London City Region, Manchester and Dublin.”
Healthcare
EMIS
Sector: Healthcare Equipment and Supplies
Market Cap: £566m, StockRank: 89
Risk/Size/Style: Balanced, Mid Cap, High Flyer
EMIS develops software that is used in pharmacies, GP surgeries and hospitals to help manage and share information. The company hit some serious contractual and performance reporting problems last year, which rocked its share price. However, it appears to have moved quickly to repair the damage and its shares have rebounded in a falling market.
EMIS throws off a lot of cash and ranks well for consistently above-average returns on capital and margins. The group is growing, profitable and pays a dividend, so it’s no surprise that the stock is on a high multiple. High quality, strong momentum stocks like EMIS are known as High Flyers. They can be hugely rewarding but they often look expensive.
EMIS Group chief executive, Andy Thorburn, said: “With a strengthened senior leadership team now in place and further growth in recurring revenues, we remain confident of delivering on our expectations for the year as a whole.”
Energy
NWF
Sector: Energy / Oil & Gas
Market Cap: £78m, Stock Rank: 99
Risk/Size/Style: Balanced, Small Cap, Super Stock
NWF is in the business of delivering fuel, food and feeds. Dependably profitable and cash generative, with an excellent dividend track record, the company reported record results in the year to May 2018. Revenue was up 9.9 percent to £611m due to both increased activity across its three divisions and favourable tailwinds of increased commodity prices in both feed and fuels.
Headline profit before tax jumped 20 percent to £10.2m, passing the £10m mark for the first time ever, while net debt more than halved to £6.4m.
In its most recent trading update in December, management said: “The group expects that overall trading for the half year will be ahead of prior year and the board remains confident of delivering its full year expectations.”
Technology
D4t4 Solutions
Sector: Technology
Market Cap: £69m, Stock Rank: 94
Risk/Size/Style: Speculative, Small Cap, Super Stock
D4t4 Solutions is a software business that helps companies to collect, manage and analyse customer data. It used to be called IS Solutions but rebranded in 2016. D4t4 has some strong quality characteristics, with margins well into double figures and trending upwards in recent years. There are some suggestions that lumpy revenue has dragged on the share price performance. Even so, its profitability has been rising and momentum has been strong in the stock over the past year.
In the half-year results, Peter Kear, the chief executive of D4t4 Solutions, said: “Overall, our business is in a good position and together with a strong pipeline of opportunities makes this an exciting time for the group and we look forward to the rest of FY19 with a high degree of confidence."
Telecoms
BT
Sector: Telecoms / Telecommunications Services
Market Cap: £23.6bn, StockRank: 98
Risk/Size/Style: Balanced, Large Cap, Super Stock
It’s set to be all change at telecoms giant BT in February 2019, when ex-Worldpay boss Philip Jansen steps up to take the reigns from outgoing CEO, Gavin Patterson. Under Patterson’s tenure, there was no let up in pressure from competitors and regulators. Add to the woes a £500 million accounting scandal in Italy, and you can see why BT felt a change at the top was needed.
The stock market giant has been rising from the ashes over the past few months in response to these changes. The shares trade on a forecast price/earnings ratio of around 10 times and have a forecast yield of just over 6.0 percent.
In its half-year report last November, BT’s outgoing chief executive, Gavin Patterson, said: “Our strategy is delivering, with benefits evident from the steps we’ve been taking to simplify and strengthen the business and improve efficiency.”
Utilities
OPG Power Ventures
Sector: Utilities/Electric Utilities
Market Cap: £88m, StockRank: 94
Risk/Size/Style: Speculative, Small Cap, Super Stock
OPG Group develops, owns and operates private sector power projects in India. The electricity it generates is sold to public sector undertakings and heavy industrial companies in India or in the short-term market.
Its share price performance over the past twelve months suggests its Turnaround classification is justified, having fallen by more than 80% by late November only to spike up again on a positive half-year update. Operational performance has been solid and the group trades on a forecast PE ratio of just over 4 times, with investors set to receive a 4.69% dividend.
In its results for the six months to 30 September, the company commented: "Healthy operational performance, an increase in tariffs and continued reduction in coal prices keep us optimistic about the prospects for the Company in FY19. All these factors are expected to provide the basis for OPG to demonstrate robust profitability in FY19."
Jersey Electricity
Sector: Utilities
Market Cap: £139m, Stock Rank: 92
Risk/Size/Style: Conservative, Small Cap, Super Stock
Jersey Electricity is the sole supplier of over a third of Jersey's energy needs. Despite its relatively small size in the utilities sector, it has a track record of consistent financial performance, with earnings and dividends both growing over several years (albeit at a pedestrian pace).
In terms of business quality, the key for investors here is consistency. Jersey Electricity has delivered double-digit margins over the past three years, cash and debt levels have been stable and profitability has been growing at low single-figure rates, as has the company’s dividend. The current yield on the stock is just over three percent.
In its full year results in December, Jersey Electricity chairman Geoffrey Grime, said:
"The Group recorded its best ever financial performance for the third year in succession. Group revenue for the year 2017/18 was £105.9m, 4% higher than 2017 and profit before tax increased to £15.3m up from the £13.5m achieved last year.”
Disclaimer
This is not financial advice. Our content is intended to be used and must be used for information and education purposes only. Please read our disclaimer and terms and conditions to understand our obligations.

71 comments
paul scott did say in last report wincanton not to good,,, maybe naps need adjusting bit sooner if others following,, brexit does play abit.. into this ,
How would you advise switching shares in a current portfolio of say 15 or 40 shares into a NAPS portfolio? Having done that when would you recommend any holding should be sold, for example on the next annual NAPS review or only if a 'holding began to show good results?
"or only if a 'holding began to show good results?" - is that a typo?
Otherwise I can't understand the logic. Why would you sell something that was beginning to show good resuluts?
naps as stated is one year,, so ride the waves,, maybe apart from plus 500,, but maybe now is cheap to get in,,
Posting on behalf of @Laughton
Here is what the breakdown for individual stocks should look like.
I think my education is becoming too long and probably boring for most. I tried that Nick but I end up with everything in a single column so it looks even worse. That was using an Excel spreadsheet with 5 columns.
Did you select "show text editor" first?
I get something like the below example (but I am using OpenOffice):
(This is from web to spreadsheet and then back here again!)
With thanks to Gormley - here is a list of the constitent stocks and their individual performance:
Sorry - I've used an edited Excel spreadsheet to get the width to fit but, as you can see, the resulting look is far from ideal. More tips and experimentation needed.
Ticker Name Gain % Stock Rank™
BVIC Britvic 17.5 86
BT.A Bt -5.91 96
CARR Carr's -8.33 97
CCT Character -3.11 99
D4T4 D4t4 Solutions 30.3 84
DTG Dart 1.08 93
EMIS Emis 19 89
EVR Evraz 35.8 99
SBRY J Sainsbury -11.4 71
JEL Jersey Electricity -0.22 87
MNDI Mondi 6.49 92
MCL Morses Club 5.92 95
NWF Nwf -15.1 96
OCN Ocean Wilsons Holdings -3.8 93
OPG Opg Power Ventures -1.75 96
PLUS Plus500 -45 88
RDW Redrow 23 99
SCS Scs 19.1 100
UAI U And I -9.77 78
WIN Wincanton -3.4 96
Any ideas of how the 2019 NAPS portfolio has performed in the first quarter?
As of now (10.45am on April 2) overall I make it UP 2.528% - that excludes dealing costs and any dividends.
If someone could explain how to import or copy and paste a Folio into this message I could give returns for each share but it takes too long for me to type in 20 company names and percentages.
If you want to cut&paste from a spreadsheet, click on the "show text editor" button (top right above dialog box) and then just cut and paste directly from spreadsheet to this dialog box. It will appear as a table.
If you want to cut&paste from a web page, it doesn't seem to import as a table. However, you can cut&paste from the web page to a spreadsheet, and then from the spreadsheet to here!
Many thanks for the info and your travails. I have had a similar experience with the text editor. You've got the results - that's the main thing. up 2.5% doesn't seem too bad. I thought it might have been worse than that.
captain_trader i have my own portfolio on about 13 stocks but since dec 1 till now i have been playing spread bet on ftse, dax, wall street,, i put in 5k i do my own system is hard work and boring spend alot time , but i watch tv as doing so not really hard work on sofa lol.. so now my 5k is of tonight 8.3k.. so
made 3.3k in less than 3 months , what i like this is in my own hands shares are in the company owners hands to run my profits, but this is a side line i tried, as you asked i tried went long on convatec monday banked £100 in 30 mins,, i could made more keeping, but id rather bank profits soon then maybe go in again if drops same day,, i do spend many hours aday selling and buying but i enjoy it,, i play chess for hours and computer takes hours at least this way i make money also do study shares you gunna spread on or its like playing fruit machine
I have a question, in an effort to remove the trading costs would it be possible to spread bet the NAPS folio with zero leverage? Example £10,000 account size over 20 stocks is £500 per stock ,imagine stock A is trading at 500p then you spread bet that stock at £1/point therefore requiring no leverage.Now the meat of the question, as you are not using leverage would you incur overnight charges? I understand you will miss dividend payments.
Yes, certainly on IG funding interest charge is charged on the entire value of the position, regardless of the amount of margin held against it.
However, you do receive dividend payments, on the ex-dividend day a dividend adjustment is made in the form of a payment to your funds.
For small positions, a non-leveraged spread bet might have cheaper trading costs than any real purchase, but this is not certain. I can't look up the actual spreads quoted on IG spreadbetting at the moment since markets are closed, but IIRC it was approx 0.5 percent each way greater than the market makers spread. So on a £500 position, an extra £2.50 each way. That is cheaper than any normal dealing charge, but you can normally deal within the MM spread with normal dealing. So on stocks with a wide spread you could soon start losing, say, 2% each way, which equates to a normal dealing charge. And then you have to pay the funding interest, if you hold the NAPS for a year that's about £15/year on a £500 position, there are some normal platforms where you can deal cheaper than £7.50 each way so if you hold for a year you're behind with the interest even before considering the spread. In summary, at £500 positions held for a year I think you'd probably be better off with a normal account.
Thank you for your advice , probably best to look for a cheap platform then, I have seen some trading at £5/trade and stick with an annual re balance rather than quarterly
Is their an easy way to follow NAPS as it progresses throughout 2019? Could it not be a Guru screen?
Hi Ed,
Fantastic article.
NAPS is a great idea and glad to see it going so well.
Cheers
Stuart
Just when Ed says he might be moving on from NAPS, I find I am getting increasingly intrigued by how well NAPS performs. But partly because I am not sure exactly how it does as well as it does!
For example, here is a comparison of the top quintile/decile/vigintile's performance in 2014-2018 taken from the Stocko performance charts (QVM, annual rebalance, mcap>£50M) but turned into a bar chart as per Ed's remarks about seeing a clearer picture. (NB: I have deliberately used overlapping groups here to try to see how changing the rule SR > x would affect the return of a 'typical' portfolio built by sampling from that range of SRs.)
What is interesting is that NAPS has out-performed all of the top percentile grouping in three out of the four years. If it was just "sampling" from those top bands then we would not expect such a clear performance difference. And it seems unlikely that it is because NAPS is fishing from an even tighter percentile band (such as SR>97) because we know that in fact it does choose stocks with SR over a reasonably wide range due to the diversification rules.
Having said that, its poor showing in 2016 might be related to the fact that the 95-100 band completely flopped that year. (What happened guys?)
Conclusion: NAPS is about more than just picking the very highest SR stocks.
My own limited experiments suggest that there is a big benefit from the way that NAPS forms a "union" of stocks using slightly different criteria. (e.g. two from each sector, or a spread of market caps.) This union approach seems to work very well. I have found that you can choose almost any fundamental criteria to use for the union rules (e.g. a range of ROE) and get similar benefits.
I have even used random weights for a set of criteria with good results. Obviously it would be no good using random weights on useless metrics. But if you have a set of metrics which you believe are representative of "what makes a good stock" then randomly weighting them helps to "forgive" a stock which falls short on maybe one or two, and switches around what you care about enough to force a bit of variation in the types of stock your rules find.
Nick,
A very interesting observation. You mention e.g. a ROE union giving a simalar SR outpreformance outcome, but were these “Good” factors limited to Quality/Momentum ratios? I assume that Value was struggling over the same period?
My feeling is that factors started to fail about 6 months ago ( esp Q4) because the “Good Company” factors were sold off alongside the Rubbish, as investors took profits and moved to greater cash. My own portfolio has improve tremendously in the last 4 weeks as Quality factors appear to be making a comeback, which I assume is because investors now believe that these companies are oversold? Thoughts? Ian
Valuation metrics are a whole story in themselves. Although it is "obvious" that you should not over-pay, it is not at all clear that Valuation metrics help with this. I have even experimented with selecting for low-V and compared it with similar rules but selecting for high-V and there is really not much difference in overall performance of the resulting portfolios. On the other hand, they don't seem to do any harm either if you combine them with rules selecting for Q and/or M.
2018 was a very odd year for Value metrics though. The NAPS portfolio started to droop from June onwards and that seems to be typical for portfolios built which include rules to select for high V. Portfolios based on QM which ignore V or select for low-V started to droop later - in September or October. But they all ended up at a similar point at the end of the year.
However I doubt whether this is a usable way to detect a market downward drift in the future. It may just be an oddity of 2018 in the same way that in 2016 the very-high Stock Ranks didn't do anything but the slightly lower ones performed very well.
Thanks for the Valuation reply. Sometimes what should be obvious turns out not to be so!
I am away on holiday at the moment and during quiet moments have taken opportunity to listen (Audible book) again to Daniel Kahneman’s, Thinking Fast and Slow. He is of course famous for System 1 and System 2 decision making. One particular part got me thinking about the use of factor metrics in stock selection.
Kahneman recounted an early epiphany during his time in the Israeli army. He was assigned to a project to assess a recruit’s fitness for active service. Despite psychometric tests the Israeli army's interview and selection procedure at the time was; "almost useless for predicting the future success of recruits”.
Kahneman asked the army interviewers to ditch their existing approach and limit the interviews to a series of factual questions meant to generate a score on 6 separate personality traits. Within few months, it became clear that Kahneman's systematic approach was a vast improvement over gut decisions and was so effective that the Israeli army would use his exact method for decades to come.
What I found most interesting though was Kahneman’s observation that if the army interviewer having asked the same systematic questions was asked to “close their eyes” and to give a subjective interview score, that this “intuitive” scoring method was also found to be effective in predicting future recruit success to.
I do think that there is a case for substituting Kahneman’s systematic interview scores with individual ”good company” factors that go into each Stockrank score and the overall scores themselves. Then to close ones eyes (to engage more System 2 thinking) and to weigh up all the available information before coming to a buy decision. The above does also confirm my view that that a written pre-buy checklist will reduce investing mistakes. For those interested the book link is below. Ian
https://www.amazon.co.uk/Thinking-Fast-Slow-Daniel-Kahneman/dp/0141033576/ref=sr_1_1?s=books&ie=UTF8&qid=1548735331&sr=1-1&keywords=thinking+fast+and+slow
Hi
As a follow up to my previous comment, as someone who trys to buy and hold for a longer period than a year of time and therefore the idea of selecting shares that I know I may have to sell in 365 days is a bit of an anathema, I thought I would look at Ed's NAPS from 2015.
Of the 10 NAPS as of today (16/1/2019) 5 are ahead, 4 are under water and 1 was sold back in Feb 2017 at 49% above the 1st Jan 2015 price. The portfolio as of today would be showing a 38.5% gain (assuming Dee held as cash) over 4 years excluding divis. About 8.5% per annum, which is not too bad (to calculate the divis and calculate the total return would be too time consuming but the current prospective yield of the 9 stocks is 2.36%). So by my calculations well ahead of FTSE100, FTSE All Share and the AIM but well behind Fundsmith.
By my calculations based on the chart above £10,000 invested in 2015 sold at the end of the year and reinvested in the new NAPS and so on would be worth £19,100. I think it is fascinating that this is almost exactly the same as the return Fundsmith has achieved and it is certainly an impressive performance.
Maybe this is just of academic interest but I post anyway.
Thank you for you column and unlike some I much appreciate the time and effort that goes into producing these.
Happy Investing for 2019
Michael
Hi Michael,
Yes that is a good comparison, especially as the Naps is re-balanced annually and Fundsmith is actively managed. Dealing costs would be lower with the fund. For your comparison, did you include divs in the Naps result?
By the way, Nick Train has done better than Terry Smith over the last few years, with lower costs, and is ahead since Dec too.
Hi mmarkkj777
No I did not include divis. I don't have the energy or resources to dig those out and add them in but might guess them being worth another 2.5% per annum?
The other slight problem with the NAPS system is that it assumes that it is held within a tax free wrapper. Obviously it depends on the size of the investment but but take 2017. If you started with £100k. At the end of the year you are at £143k but tax would take a big bite out of this.
Hi Michael,
That’s true about the tax free wrapper for Naps, but applies equally to any fund held.
With dividends I make that the Naps outperforms both Nick Train and Terry Smith. With dividends more than compensating for the Naps higher dealing costs.
I’ve got both now in my passive acct, so will see at year end which I feel is the best approach. Well for 2019 anyway.
Purpleski wrote: "The other slight problem with the NAPS system is that it assumes that it is held within a tax free wrapper. Obviously it depends on the size of the investment but but take 2017. If you started with £100k. At the end of the year you are at £143k but tax would take a big bite out of this."
mmarkkj777 replied: "That’s true about the tax free wrapper for Naps, but applies equally to any fund held."
Actually, that isn't the case mathematically. Let us assume that the NAPS portfolio and the fund have identical growth rates before tax. If one has to pay some Capital Gains Tax on the profits from a rebalanced NAPS portfolio each year, that reduces the effective growth rate of the NAPS portfolio. When that reduced effective growth rate is compounded over a number of years, the overall effective growth is much less than if the original growth rate before CGT were allowed to compound over the same number of years in a fund and CGT is only paid once at the end of those years. The annual CGT allowance complicates this calculation, but it is possible to only sell sufficient units from the fund each year to make use of one's annual CGT allowance and reinvest the proceeds in another fund with the same growth rate (if one exists).
Thanks PKA for that clarification.
appreciate it.
It’s ok in my case, but I can see it could make a difference over multiple years outside of a tax wrapper.
Cheers,
Mark. .
I don't know if anyone is tracking NAPS this year (Gromley, do you know?), but here is a screenshot of my Naps portfolio. Same stock selection as Ed's, but some bought a few days later.
So far its up about 0.5% with a few notable gainers, namely Mondi, Redrow and, you guessed it, Plus500.
Hi tom,
I don't think there is a definitive prescription, nor probably need there be.
There are two factors though that would have given you a different list.
1. The date, StockRanks do change over time as new information (or just share price changes) come in. Therefore even if you a NAPs portfolio on today's SRs it will likely be different (in one or two selections at least) from one run even on yesterday's SRs. Ed constructed his NAPS in late December so it's no surprise that one run later will be different.
2. The point you allude to. How you sub sort stocks that have the same StockRank. As far as I understand there is no decimal point component to the StockRanks, so two stocks both rated 98 are considered exactly the same. This can make a difference as to which stock gets the last berth in a particular diversification bucket.
I don't know if Ed applies a secondary sort on his selections or whether it is luck of the draw as to which pops out of the machine first.
Personally I don't think it really matters and there's no real reason to believe that at that level any one portfolio option over another should be any better.
It's more in my mind about the high level purpose of the methodology.
1. Start with a high probability group of shares (those with high SRs)
2. Pick a diversified subset of them to broaden exposure and limit risk from cyclical factors.
Hi Ed - Thanks for another good article. I've decided to have to try running a NAPS portfolio this year. I tried replicating your selection process myself (i.e. applying the rules you've set out to define a list of stocks) and came up with a different (albeit overlapping) list. I'd be very interested in a guide / video to show how you use Stockopedia to apply the NAPS rules and come up with your list in practice. I have watched the NAPS Portfolio webinar where you demonstrate the "two by two" methodology, but I can see you've modified this approach now. I'd welcome seeing how the approach is applied in practice.
A related query - How is the order of stocks within same Stockrank number determined (i.e. why are some Stockrank 99 stocks higher up the list / more highly ranked than others with the a score of 99)? I noticed that when I copy the top Stockranks across to a portfolio for the purposes of whittling down to a NAPS list, they seem to come up in a different order from how they appear in the Stockranks section, which made me reluctant to trust the new ranking order.
Is writing a couple of articles a year such a burden you poor soul
-
Hi Ed
I hesitated to post this because I wasn’t sure whether it seemed overly critical, so forgive me if it does, it is not meant to be.
What a brilliant column and the list throws up some interesting stocks. Thank you. As you say this one should get more views than last years rather than less. There is a great deal that can be learnt from it.
I still take issue with Stockopedia’s belief in diversification to the extent of owning 20 to 30 stocks (I own 8 to 12) but that is a discussion that can run and run.
However, I don’t think it is the “only (PI) free lunch in investing”. The other major “free lunches” (over the big guys) that Private Investors have are: i. Option to invest in small and micro caps, ii. The ability to take the long-term view (three to five + years). Certainly, if I ever decide to go the NAPS route I would place an upper market cap size on my screen. The other reason I don’t feel it is for me is that it is looking at performance over a one year view, when I think that so much out performance comes from holding for longer periods.
On the subject of bench-marking, yes I wouldn’t use the FTSE100 but anybody who takes issue with this can surely pick their own index and see how NAPS performed against that. I benchmark against an equal wait mix of S&P 500, AIM All Share, Fundsmith and Conbrio Buffettology. As if I found that I was no good at the stock picking melarchy, it is to those funds that I would deploy my money. It certainly wouldn’t be to a FTSE tracker!!
I was surprised at “....but it had done it at a lower volatility/risk.” Surely it is nowadays a given that volatility is not risk?
One question are you disappointed that the NAPS portfolio only “outperformed” the benchmark by 3%?
For the record I don’t run a NAPS and my four year record is 22%, 34%, 54%, -12%
Happy Investing in 2019.
Michael
Hi Gromley,
Thanks for that. I didn't want you to go to any effort, just wondered if the stopped out cash was calculated reinvested or held as cash.
I managed to buy my allotment of D4T4 also today, so now I hold the full Naps compliment.
I think I'll go without stops for a few months and see how it goes. Normally, I use stops for 2 main reasons. 1. it automatically takes me out of a falling market (as in October). 2. I'm not good at selling falling share manually, always thinking it will recover. Setting the stop takes out this psychological element (weakness) and allows me to concentrate on stock selection and timing the buys. It works for me with profit targets at least 2x the stop level (but I guess none of this is required for Naps).
No problem Mark,
Its a piece of work I am intending to anyway (not because I am sold on Stop Losses for a portfolio like this, but wondering if there is a case to do a "manual review" at a given stop level - manual reviews and personal decisions are definitely not NAPS of course.)
It struck me as I was on the way to an appointment this afternoon, that there is a very quick tweak to be made to the model I ran at the half year and here are the results.
Below is the result of a simulation based purely on closing prices and on the basis that : on the day stop loss is triggered you close out the position (at the day's closing price) and a buy a perfect FTAS tracker (again at the day's closing price).
The results then show at the Half Year (HY) and Full Year - the value of the "stop-lossed" portfolio vs the value of the "continue to hold" portfolio and the number of stocks triggered; based on both a "trailing " stop loss and a "starting price" stop loss
Here are the high level results :
So, as I mentioned earlier, at the half year I could not find any stop level that would have been beneficial. As predicted, by the full year the case for stop losses did look slightly more favourable, but even the notional 3% best case "improvement" would probably not cover the dealing and spread costs of the extra sells & buys.
I should stress this doesn't in any sense suggest that stop losses never work, but in all of the cases of "balanced" portfolios that I have personally looked at I haven't found much variance to this (in fact these FY values are about the most positive light I have been able to shine on stop losses.)
Of course in this particular case, if you'd had the "sense" to get stopped out and then sit on the cash you would have been much better off. The problem there though would be when do you start buying back?
Hi Gromley.
Thanks, yes. I'm going to run it completely non-admin. as Ed intended.
I'll be interested to see how it pans out and compare to my usual methods, although finding a balanced comparison method is pretty difficult (impossible).
Thanks again.
Hi Mark,
I've generally run lots of scenarios to seek to find a level of stop (whether trailing or from original price) that would actually give positive results, that it was impractical to consider precisely what would have been bought with the returned cash.
However in Ed's half year review I did post a view based on a 15% trailing stop loss, comparing the subsequent performance of the stopped out shares with the FTAS performance from that point to the end of the period.
You'll find that here.
Five out of the six stocks went on to outperform, with the best being Morgan Sindall which recovered 23.8% compared with a 2.8% gain for the FTAS.
As I mentioned above, it seems likely to me that the second half of 2018 will show stop-losses in a more favourable light (although any reinvested cash would likely have gone down too). I'll try to do a proper review of that in the next few days.
Hi Gromley,
Thanks for your take on this. All very good points.
I’ll take on board what you say about the value of stops, but in your back test did you assume your liquidated capital was not reinvested?
My natural tendency is to ride my winners and cut my losers, but within the scope of my Naps portfolio I don’t need to do this. So I may leave it to run the course.
Cheers,
Mark.
just an add as looking at top 20 redrow after getting arse kicking from telford homes never do for at least 2 years house builders... d4t4 seems loads director dealings and shares not availble now,,go stockopedia no price,, nwf why such low volumn in shares ? i wont go on just hope more experts can answer this,, im sitting on convertec still wondering do i hang on or cut my loss
I have gone with the Naps for 2019. Bought yesterday (well 19 of the 20, because couldn't get a quote on D4T4 with my broker, HL). Will try again Monday.
So far, because of the dealing cost, around half of the 19 are in profit. Still have not decided whether to use stop losses, or stick with selection until end of the term.
Mondi are also doing quite well so far (early days).
Well done - indeed a good day for the markets.
Looking at the top 2 on the Stockranks - EVRAZ & SCS - both went up 6%
Did you buy all 19 today - interesting strategy!!
I tend to drip feed and buy across a range of say 5 days.
Good luck!!
Hi Mohammed,
I bought the 19 stocks on Thursday. Due to personal time constraints of not being able to watch the market for optimal buying times. But the market performance on Fri has probably helped reduce the negative of not timing my purchases.
I want to use stops, but if I do after a while it won’t be naps.
If I choose to use stops I need to decide what to do with the liquidated capital. Two thoughts are either:
choose an alternative stock from a reserve list
Buy more of the Naps stocks that are performing the best.
I’m favouring the second, as it keeps it somewhat still in the Naps fold.
Either way, it then becomes a managed portfolio and moves away from Ed’s intent of a no maintenance portfolio. But it could be an interesting test.
Note: I have not invested a high proportion of my capital to do this, but as I was mainly in cash (and want to start trickling back into the market) I thought I would have a go and it’s an interesting way to start further testing the water.
Thanks to Ed and the team for the research, and the excellent work, as ever.
Cheers. Mark.
Hi Mark,
Just a few thoughts about your stop or not musing.
1. I wouldn't worry too much about how "Naps" like your variations might be. NAPS is in my mind essentially a building block or philosophy (Ed uses the phrase ' a Jazz sheet to riff on'). Everyone has got their own requirements and foibles (quite a few I have noted would not dream of investing before doing some detailed research into the companies in question - this may well have saved them from Indivior (LON:INDV) this year, but also quite possibly £PLUS). At the end of the day if the additions or subtractions from Ed's basic framework make sense to you and you can have some confidence that they add value, then I don't see the problem.
2. That said, my testing on stop losses for NAPS (and similar portfolio approaches) has generally shown that there has not been a level to set the stops at that provides better performance than not having stops. (I haven't worked the numbers yet for 2018 - was planned for tomorrow, but I'm likely to have to defer that - and I suspect this might be different as stop losses would have protected against the worst of the falls for Indivior (LON:INDV) ) I found that stocks that rebound from just below (any) stop level tend to outweigh those that fall further. Nevertheless I do recognise that stops do give some psychological reassurance and the small performance drag that they present may therefore be worthwhile.
3. (And this is the main reason I chose to reply) In terms of where to recycled cash from stops - I don't agree that buying more of the best performing NAPS stock keeps you more "NAPS like at all" > NAPS I would say is not defined by its selections but rather by it's method. If you were to push more cash into the best performing stock, you are increasing your reliance on one single factor (momentum) and more importantly, I think, diluting the second most important element of the approach (2nd to the StockRanks themselves) which is diversification across Sectors, Industries, Size, Volatility/Risk. For my money, that is most un-NAPS like! Your selection also might no longer have a high SR, which doesn't necessarily make it a sell, but the figures do seem to show that historic SRs become less and less predictive as time passes.
The most NAPS-like answer I think is the one that Ed applies when a forced seller (eg a takeover) and that is to take the latest StockRanks and select the first stock that satisfies all of the diversification rules.
By the same token, there is nothing magical about the 1st of January. As you've only reinvested a part of your capital at this time there is no reason, if you wanted to be more exposed to the NAPS method, that you couldn't start a second parallel NAPS type portfolio (still with a 12 month holding time) in for example July (or even April). This may even given an extra layer of diversification - possibly across cyclical factors.
Nothing more than food for thought - as Ed has said, NAPS is not supposed to be a prescription.
Another great article Ed, thank you. Enjoy Australia with the kangaroo steaks, sunshine and scenery.
In the first few days into 2019 the portfolio is up 0.43% with Plus 500 showing the highest return of 7.19% so far. It is also in 2nd position in the bubble chart, with CCT in top position.
Plus 500 is also the most undervalued share with a valuation of 2440p according to Vectorvest, where it is in 4th position in the UK market.
It is thanks to Stockopedia that my portfolio produced a dividend income of over 15k last year (£15,167.84 to be exact ) which is the most income that I have ever received. That is around 11.3% , all inside my tax free ISA in case any tax inspectors are thinking of checking. It is all OK.
Thanks again Ed for Stockopedia.
thank you ed for which is hard work you put in and also great to meet you and other stocko peeps all great to see at stock slam events.. just couple questions, do you put same cash into each share ie 5k,,as portfolio 100k, and is list of 20 from most fancied share or just random,
Thank you for the article - I really enjoyed following last year's NAPS and how the comments keep updating as the year progresses and stocks move up and down. I bought into the idea later on in the year and this was one of the articles I was looking forward to.
In your rule about diversification, you indicated to have no more than 1 in any industry group.
The 2019 portfolio has both Jersey Electric and OPG Power Ventures, very different companies, yet both classified as Electric Utilities & IPPs as industry.
@breyten - yes I should have clarified this point. Telecoms and Utilities are very sparsely populated in terms of industry groups, so the hard industry group rule is not upheld there. As you can see, the system has a fair amount of discretion even if the stocks that qualify don't.
It's fascinating to see the developing tweaks and refinements you are making to diversification Ed (my thinking has slightly diverged on this, but I've not quite got around to collecting my thoughts into a useful narrative on the subject).
I might be misremembering, but wasn't part of the reason for moving from only two stocks in each sector to a maximum of three driven by a view that Telecoms and Utilities were not favourable sectors? (I might have imagined that as I cannot now find the comment I thought you made on the subject).
Now there is a rule tweak that 'favours' them.
I'm curious (assuming that I havn't just misremembered) as to whether this is just tweaking and refinement or whether you are consciously or unconsciously adopting a modest degree of 'sector rotation'?
Great article. I am currently sat on the sideline waiting to see what happens re brexit but I really like what you’ve done here. How do you think performance would be affected if you took these 20 stocks didn’t particulay focus on timing of the buy but put an automatic 12% stop loss on each one?
Ed, what a thoughtful and interesting piece.
During the four years you have been doing these, you have often referred to short periods of recession or backwards movement, as you have lived through them week by week. Until recently, my view has been that we were stuck in a prolonged bullish period, and I would say that as a summary of all the time Stockopedia has been running.
You have yet, with Stockopedia up and running live been near a recession until perhaps this Autumn past, and will have quite different considerations once you do. This is just a different point of perspective of the same markets.
Most of your subscribers do two things with most of their shares; they buy, then they sell. My background is entirely the other side of the coin to you; TA rather than fundamental analysis, although I do understand a bit about both, and they also have a massive overlap. My one request for your stock report layout is that you add a simple Compound Annual Growth Rate of PRICE, over say 5 and 10 years, for the longer term share holder. I produce these for myself, and they are a brilliant guide to actually achieved gains.
They might inform you, for instance that GSK, much discussed lately, has grown by only 1% compound over 10 years which might surprise some.
Thanks again for getting back to thé writing and thinking.
Simon
Great article Ed.
NAPS so far works better in odd years, the even years it has not performed well, so 2019 maybe a good year? I’m not buying much at the moment will wait to see what happens with Brexit.
NAPS so far works better in odd years, the even years it has not performed well, so 2019 maybe a good year?
Do you think that's statistically significant?
timarr
Well it could be. See: https://www.stockopedia.com/content/given-100-years-of-history-what-are-the-odds-of-a-stock-market-rally-in-2019-430293/
Sorry, which part of that article are you directing my attention to? It doesn't appear to mention anywhere that the annual performance of a NAPS portfolio is causally correlated to the parity of the last digit of the year, or explain the underlying mechanism.
In fact the article appears to say the opposite:
But perhaps I'm missing something?
timarr
Also, lots of people think the summer vs winter months is statistically significant.
Not sure about alternate years for Naps though, mainly because the share selection seems quite different year-on-year. Not sure what the correlation would be. Any thoughts Herbie47.
Also, lots of people think the summer vs winter months is statistically significant.
Oddly enough, it is. It's the Halloween Effect. No one quite knows why, but buy in November, sell in March is robust - although there are still a few years where it doesn't work. Lot's of suggestions about the causal mechanism but my preferred one is that sensible people prefer to go out in the spring and summer and enjoy themselves :)
However there's obviously no correlation between NAPS results and the parity of the year - I'd assumed herbie was making a joke, given the fact that the entire article is about statistical correlation ...
timarr
Ed
As always a great article: informative, original, honest and well written.
Great work Ed, but you're on holiday! Put your feet up, crack open a tinnie, put a prawn on the barbie and enjoy the Aussie sun. Despite a wobbly 2018, I suspect most Stockopedia subscribers, like me are still grateful for the insights and research published by you and your team throughout the year.
Ed, Another 10/10 article although I am a little surprised that having made an excellent case for Conservative low volatility stocks that the are only 3 in the portfolio.
I have dummy mirrored the 2019 HATS portfolio and see that in addition to its component companies scoring well for their combined Q+V+M (Stockrank) scores, that most also score well for QV, VM and QM combinations. Of the 3 combinations (and my preferred stock pick style) perhaps QM is the best fit within the green, tend to outperform segment:
2019 HATS Portfolio vs. QM
The current correction and nervous sellers have "Reshuffled the Pack" in terms of sub-optimal company valuations, so do think that there is a good chance of the HATS approach working well again in the coming year.
I have this morning though looked through the financial metrics and outlook of each company in the 2019 HATS portfolio and stock picked the one I like most. It is Character (LON:CCT) which not entirely coincidentally has a QM score of 99. I will buy an initial stake today. I also venture a possible acronym for your new alternative portfolio method: PICS - Picked Investment Criteria System.
With New Year greetings and many thanks again to all of you at Stockopedia for providing such a wonderfully clear resource of financial metrics and informed investment comment. Ian
Super !! Thank you Ed.
NAPS is the best solution (for the moment ??), I look forward to reading the HATS.
I run "my" (biases....) NAPS (international) for 3 years now and results are good ;) (in fact, the quantity of work is really good and it's maybe more important than the yield).
For 2019, I decrease my investments to 12 stocks (20 before) with aprox 90% of your NAPS "laws" 2015-2018 (a bit more of value / Graham biase/like + deletion of some standard as bad Beneish + around 60% of the portfolio invested in 10bn or more Cies - Market Cap...).
I think that the max volatility can not be significantly stronger than with 20 stocks (and I don't care about vol). => less work. More entrepreneur style. The question is will it provide a better result ?
I also will rebalance every six months (too much good studies about it - as the one you mentionned from Ben) and occasionally with rules on the stocks and on the portfolio. Not in order to stop losses but in order to buy cheap.
About 2018, as you write : it is a "normal" year over a long run - still painful :) but a maximum of good opportunities right now !
Thank you again for your job and for your articles.
Thank you also to the Stockopedia's team.
I love to run Stockopedia - only (and unfortunately) few times a year because of NAPS ;)
Bonnes vacances et bonne année !
Hi Ed, I'm seriously considering mirroring the Naps selection with a proportion of my capital (I'm about 85% in cash at the moment, waiting for the market to steady/bargains to appear). However, I've had an interest in factor investing for a while and am comfortable with the risk of getting back in immediately by another 10% or so. The only problem I have is a psychological one. I normally use stop-losses as a safety net (which mainly took me out of the market between early and end October).
I could, I suppose, use the Naps selections with a generic stop set at a certain level and trail them), but the portfolio could then slowly diverge from the Naps regardless of whether I replace the stocks stopped out on, or just have a reduced diversification.
Anyway, I'll have a think. My motive for doing the Naps for 2019 is to establish if the time and effort I spend in selecting shares is actually a productive and worthwhile use of my time (I spend around 15 hours per week on my investing: more if I include reading about investing from the masters. Thanks to Ben H and some subscribers for reading suggestions). I have to admit it does have entertainment value as I enjoy it, but my main reason for risking my capital is to make a profit!
In the last 4 years averaged 17.25% pa (including all costs and including all divs). This was obviously effected by a bad 2018. Even though I did get stopped out of most of my holdings in Oct, the pre-stop fall and the ones I still held, fell enough to give me a poor year. So, I guess I have had a similar performance to the Naps, but with a lot of time spent (however, this could improve now I use Stocko :-) ). I've been a subscriber since April.
If I mirror the Naps but use stop losses, I would have to have a reserve list of stocks to buy in their place to stay with the 20 stock diversification level. Does anyone else do this?
Thanks again for the Naps and this thread. Here's to a great 2019, both for Stockopedia and market returns.
The 2018 NAPS alerted me to Griffin Mining, a miner whose primary product is zinc. The price of zinc rose during the early part of the year and as with all miners that increase mostly goes to the bottom line. The share price did not absorb that information immediately and I was able to make a tidy profit when the price of zinc eventually turned. Many thanks for the tip! I was never a "fire and forget" investor.
Having made around 30% loss in 2018, NAPS provides some comfort. Look forward to your HATS trick when you have it up and running. Maybe stocko will provide live data for its stock reports by that time?
Happy New Year!
NAPS came through a very interesting test last year. In theory, anyone can get a return better than the index in a bull market by simply using leverage. Hence why "risk-adjusted returns" are an important metric.
However in the face of a negatively drifting market in the last six months NAPS has performed the same or better than the index which suggests that it is doing more than just picking more highly leveraged stocks.
It would be very useful if you could create an admin Fantasy Fund to track the 2019 NAPS the way that you track the guru screens.
Bon chance Ed. As ever your rigour is to be admired.
Happy New Year!
Great article. My naps last year were slightly different, but the results were similar. Although it was a loss, I am pleased with the performance and will be sticking with this approach to stock picking for a large part of my investments. To spend just a few hours once or twice a year and then forget about your portfolio is liberating. Many thanks.
Thanks Ed - i find the NAPS strategy very interesting as i don't have the time or experience to research companies but want to be able to operate something that works. Biggest surprise to me is how few companies from last year have made it into this years...............
PS - for those looking for a SNAPS update - I'll add the stats to the charts once I'm back in the office next week.
Hi Ed,
Have monitored your NAPs and SNAPs over the year. Largely agree with your performance analysis though estimate a dividend yield of 4.4% for your NAPs which improve the total return. Looking forward to your SNAPS update which I have as a loss of 11.1% (we probably have slightly different starting prices both in NAPS and SNAPs) though this includes the rebalancing transaction costs and profit/(loss) on positions exited. The real negatives in the 2H were Keller (LON:KLR) and Royal Mail (LON:RMG) (a balanced stock at time of SNAPS selection!) though there were again a high number of negative performers vs. previous years. Again dividends help a little representing a yield on original cost of 3.3%. Happy New Year and enjoy the rest of your holiday!