Regular portfolio housekeeping is essential when it comes to staying in control of your investments. But knowing what to look for can be just as important as looking in the first place. That's why we've been working on making it easier for you to assess your folio through the lens of the 3D Framework, the rules-based approach at the heart of Stockopedia, built on Drivers, Diversity, and Discipline.
Today, we're pleased to introduce a refreshed Analysis tab on your folio pages, designed to help you quickly see how well your portfolio aligns with the first two dimensions of the framework: the quality of your Drivers and the breadth of your Diversification.
Drivers: are you picking high-potential shares?
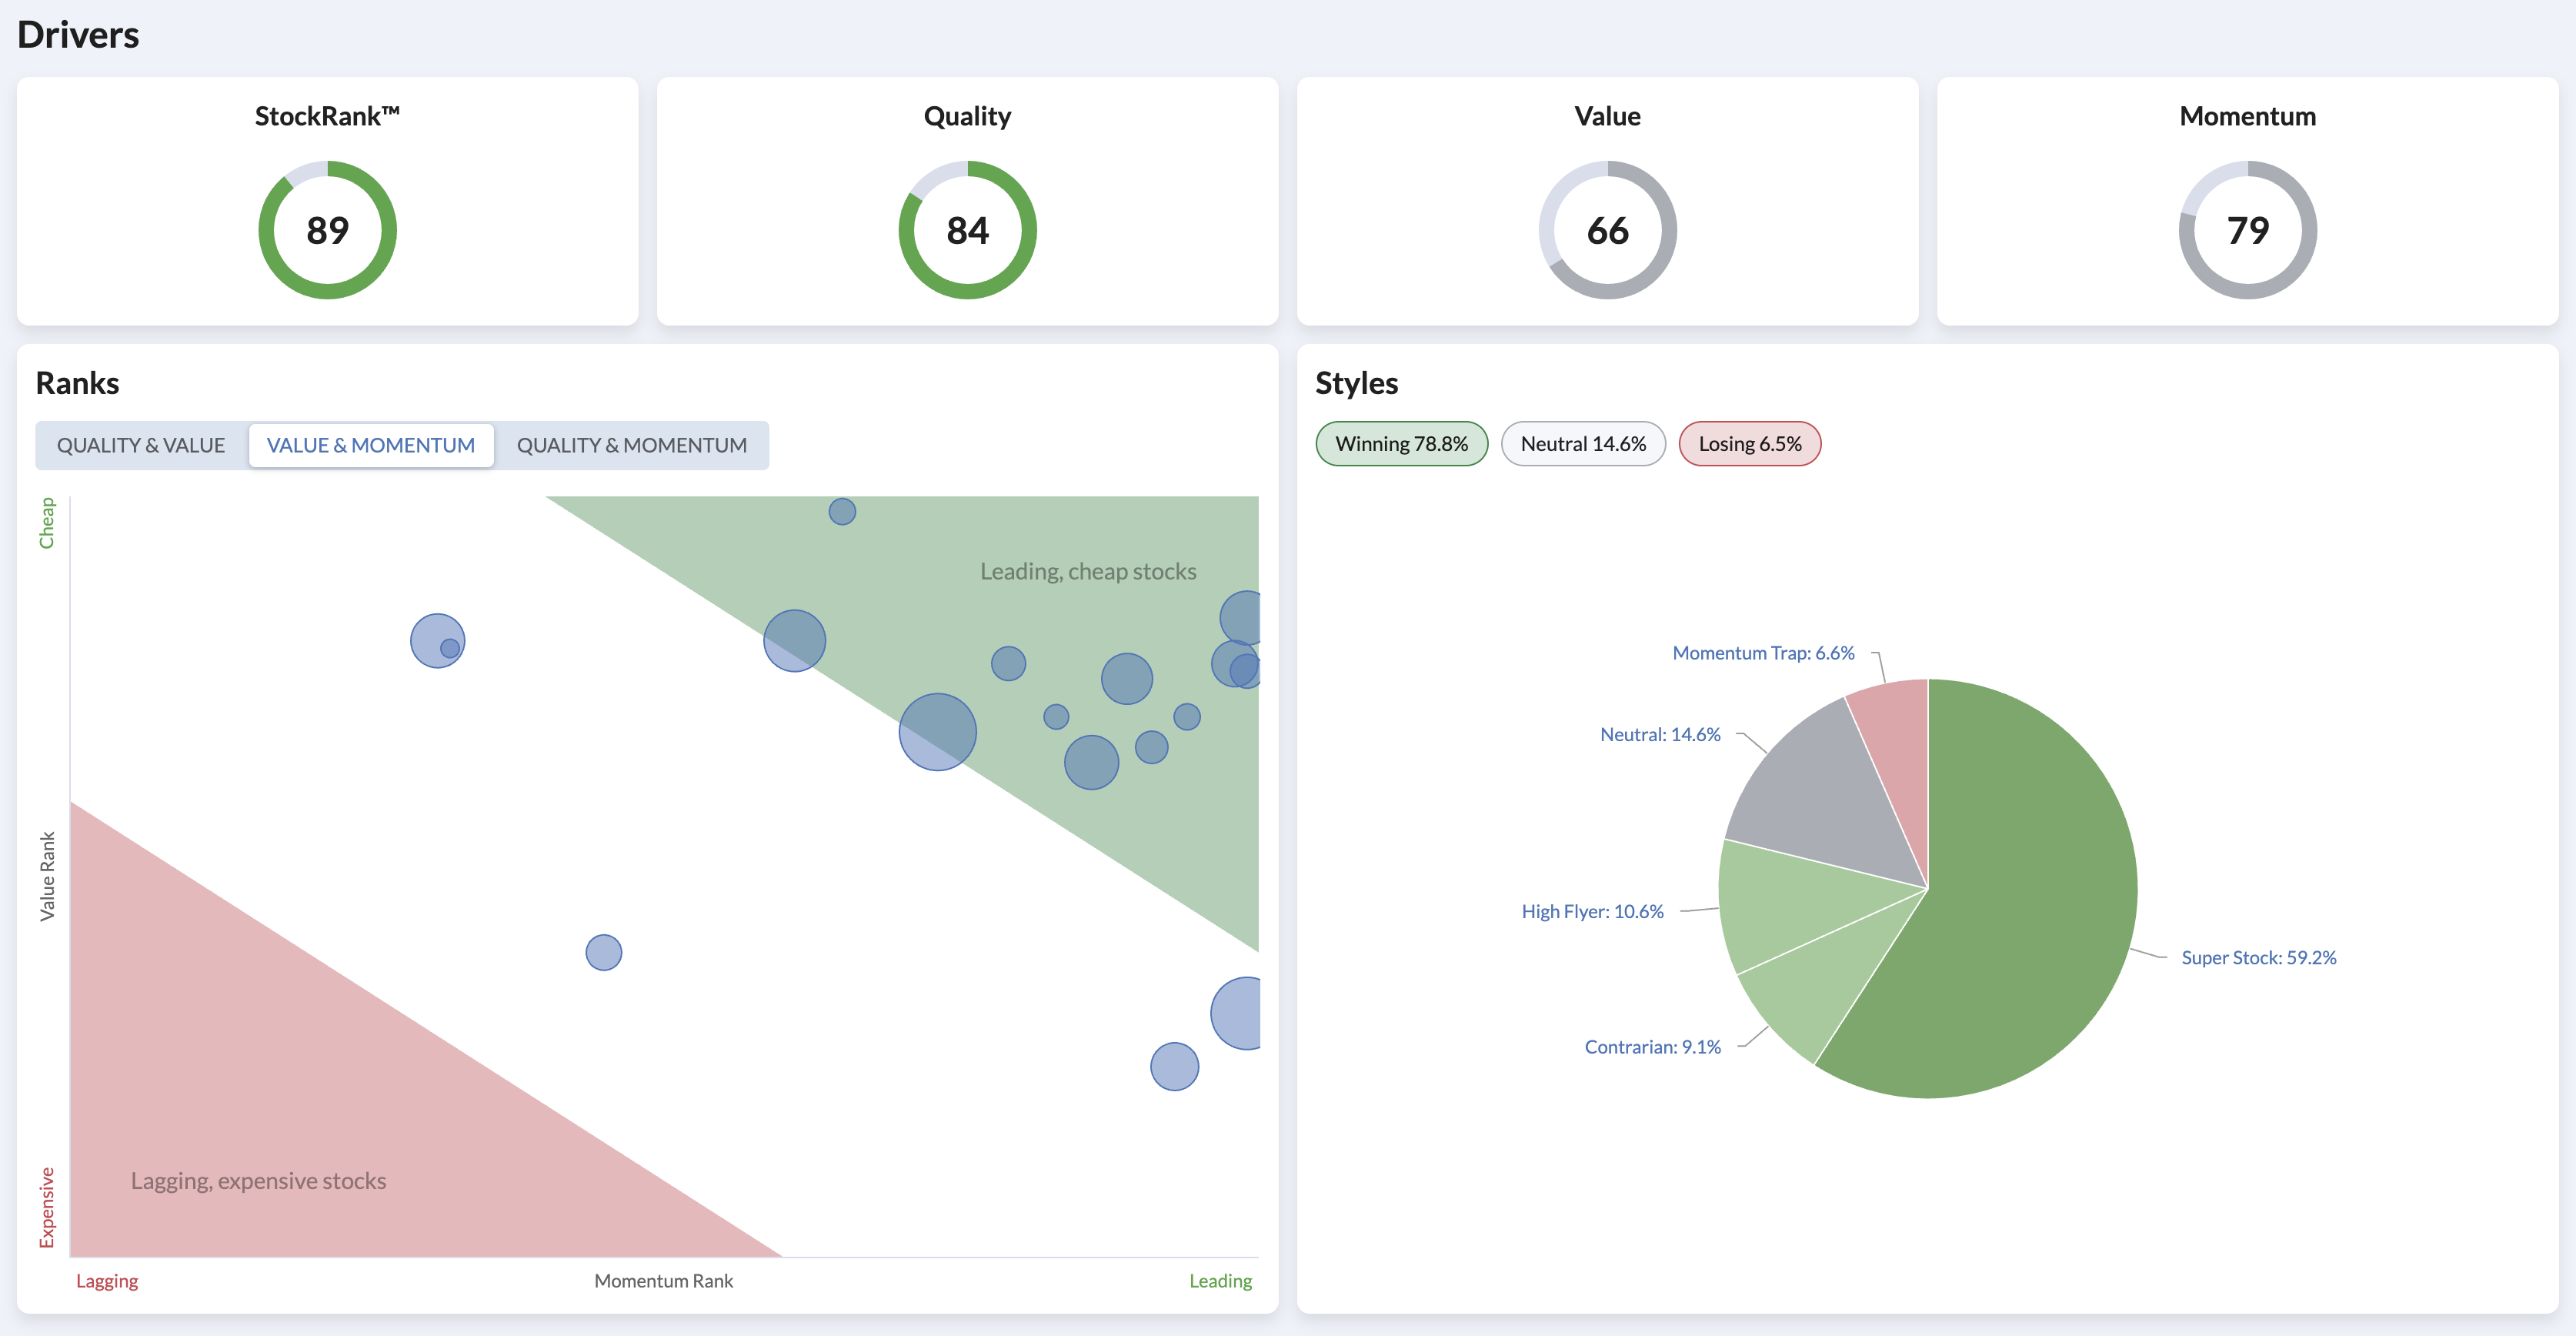
The Drivers dimension is all about selecting shares with strong Quality, Value, and Momentum characteristics - the three factors that make up a company's StockRank. Previously, you could see the style composition of your folio, but there was no easy way to see an aggregate view of the underlying ranks driving those styles.
The new Drivers section now shows you your folio's average StockRank alongside its Quality, Value, and Momentum sub-ranks at a glance. Below that, the bubble chart lets you visualise where your holdings sit across pairs of ranking factors, toggling between Quality & Value, Quality & Momentum, and Value & Momentum (with your last viewed saved as default), making it simple to highlight factor preferences and spot if your portfolio is leaning too heavily on one factor at the expense of another.
Your folio's style composition is still here too, now sitting alongside the ranks that underpin it. Together, these views give you a much clearer picture of what's driving your portfolio's potential.
Diversification: are you spreading risk effectively?
Diversification across economic sectors and risk profiles is one of the most reliable ways to reduce volatility. The updated Diversification section brings together three views to help you assess this.
There are two sector charts views changeable via a toggle, one which shows a pie-chart breakdown of your portfolio and another which compares your folio's sector weightings directly against the benchmark, making it straightforward to see where you may be over or under-exposed. Your preference is saved as the default when you next view the Folio Analysis. Alongside this, a new RiskRatings breakdown shows the balance of Conservative, Balanced, Adventurous, Speculative & Highly Speculative holdings in your portfolio…