In our last release we introduced event icons on tables and hover reports as well as banners on StockReports. We also added the functionality of jumping straight to company analysis within editorial articles, which we hope has been useful for highlighting and analysis the key events on the day. Today, we are introducing two more enhancements on this theme.
Historic events on charts
We have expanded chart events to include key historic events, making it easier to see what influenced market movements on a specific day.
You can now find Trading Updates available to be added in your ‘Events’ within charts.
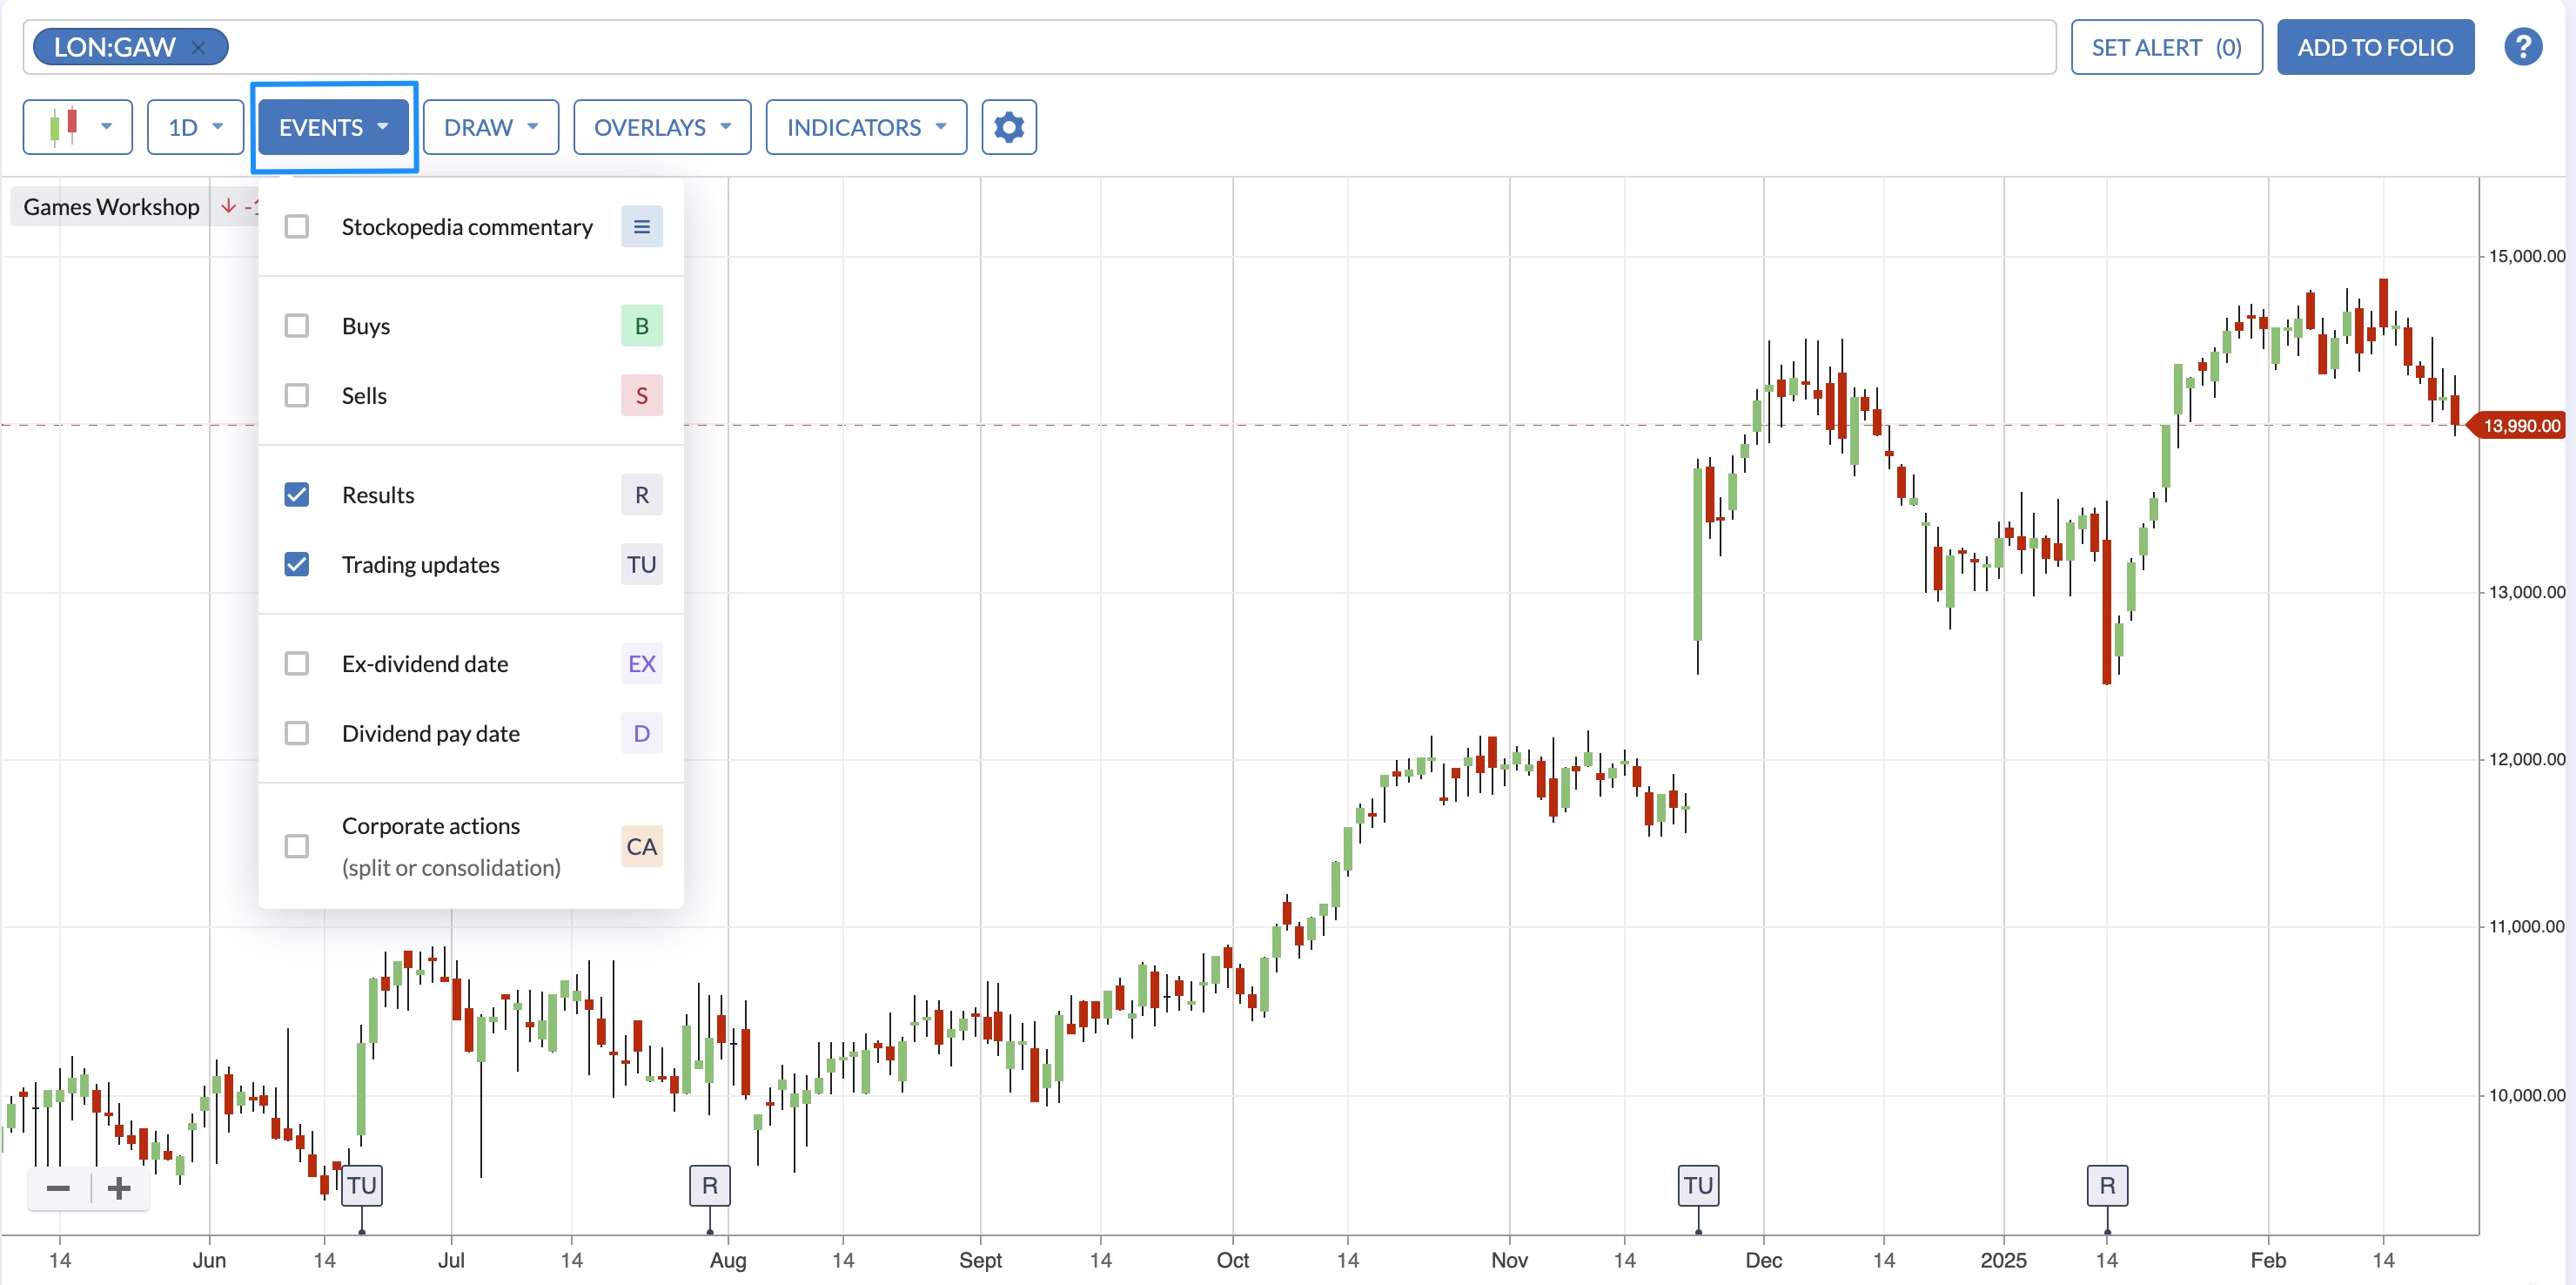
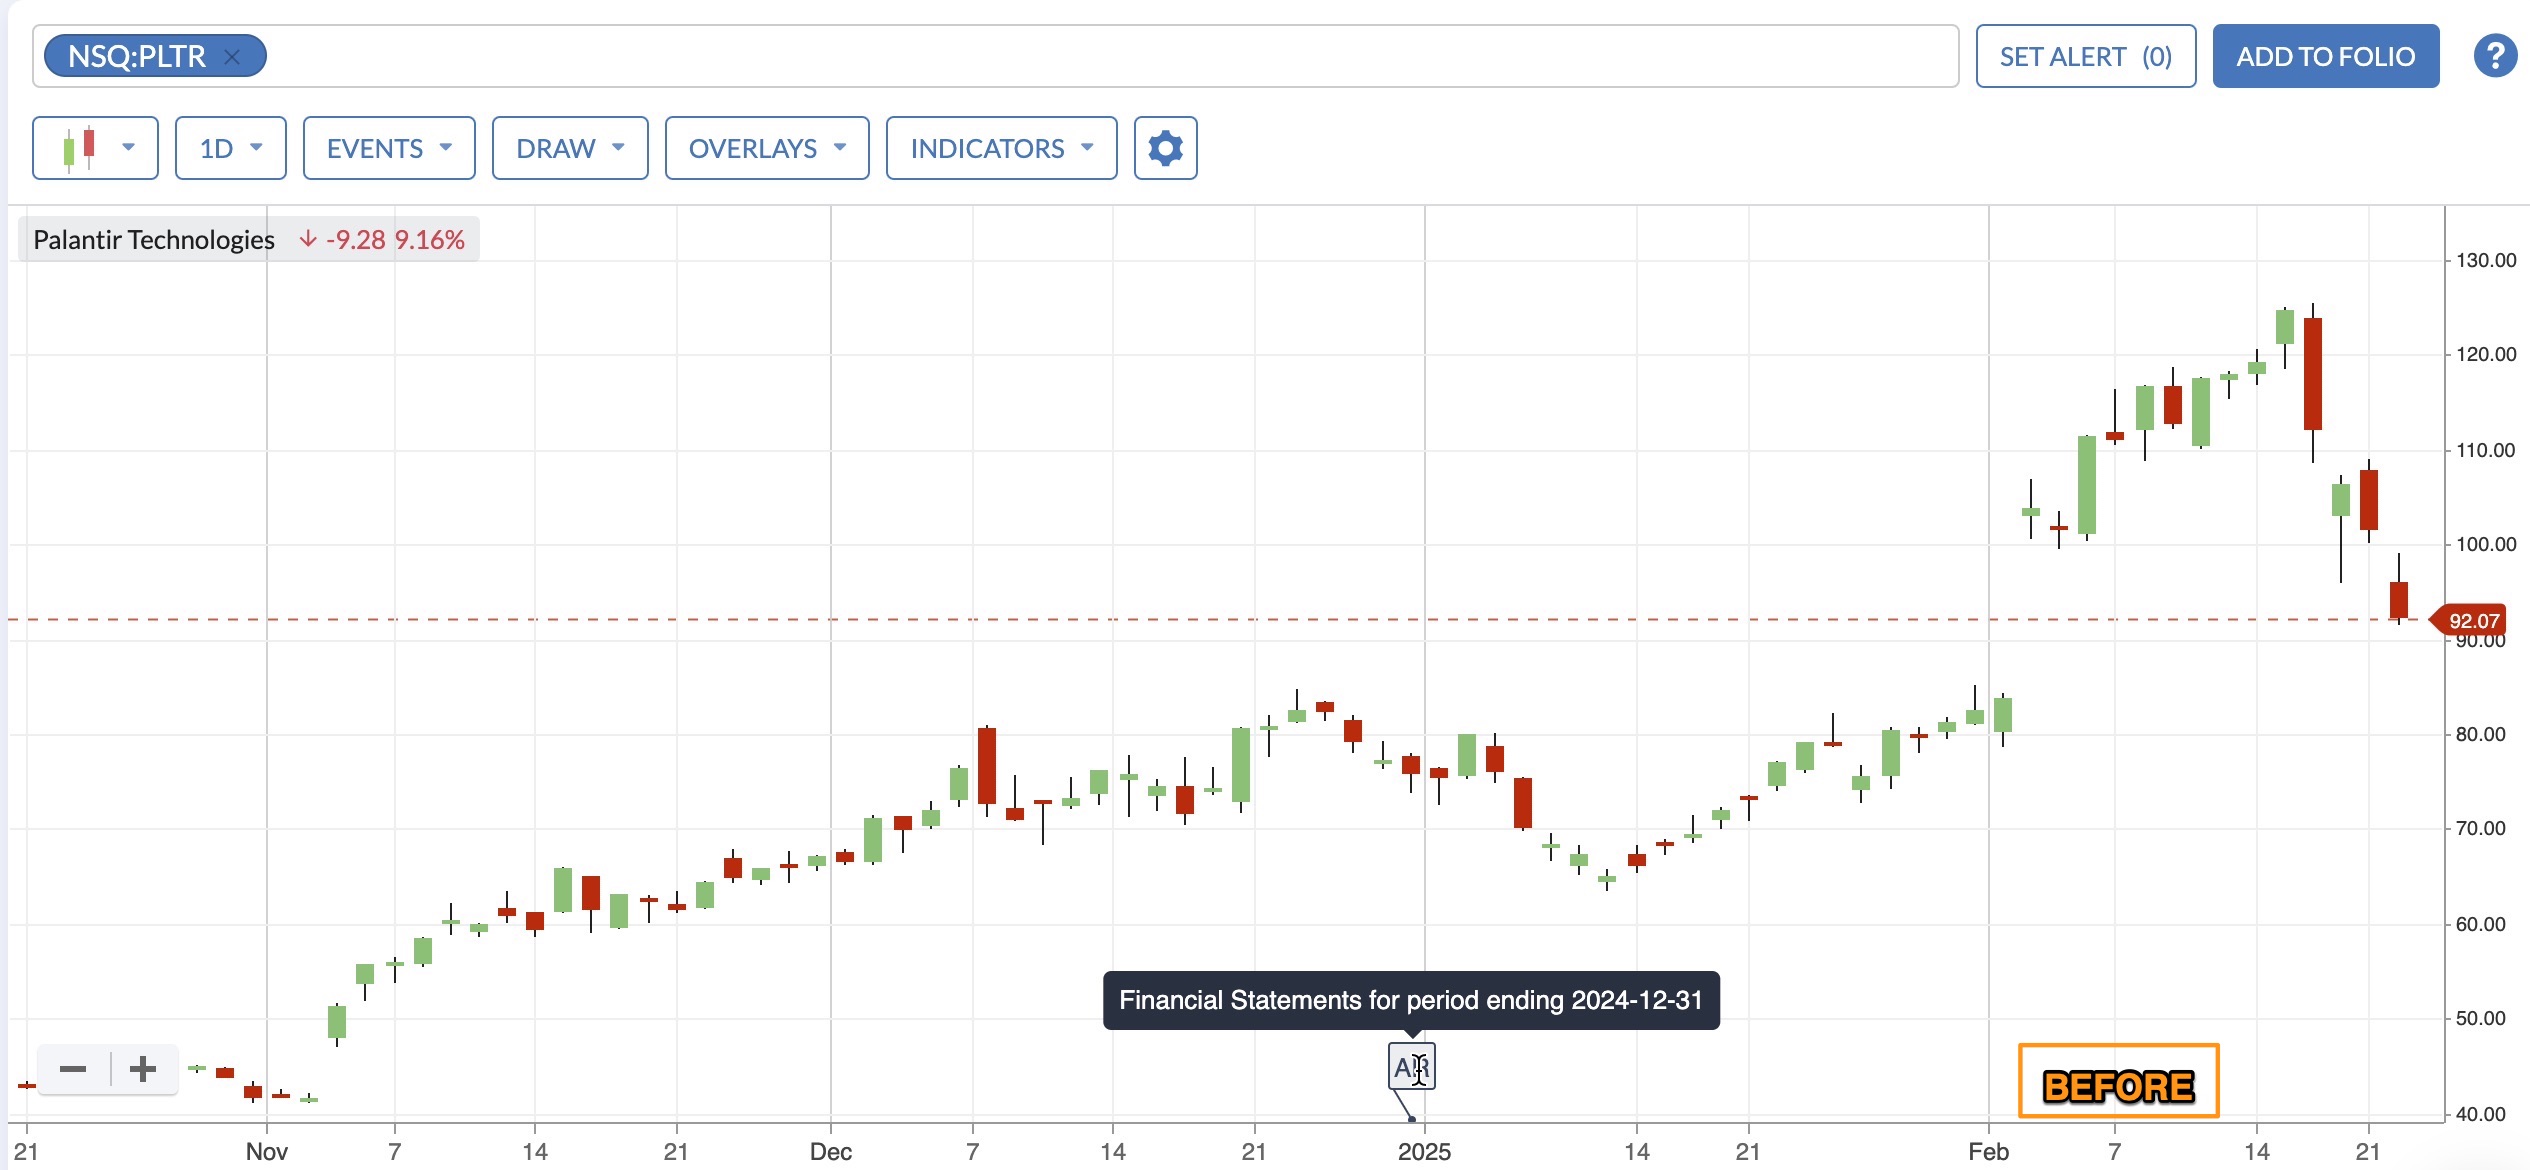
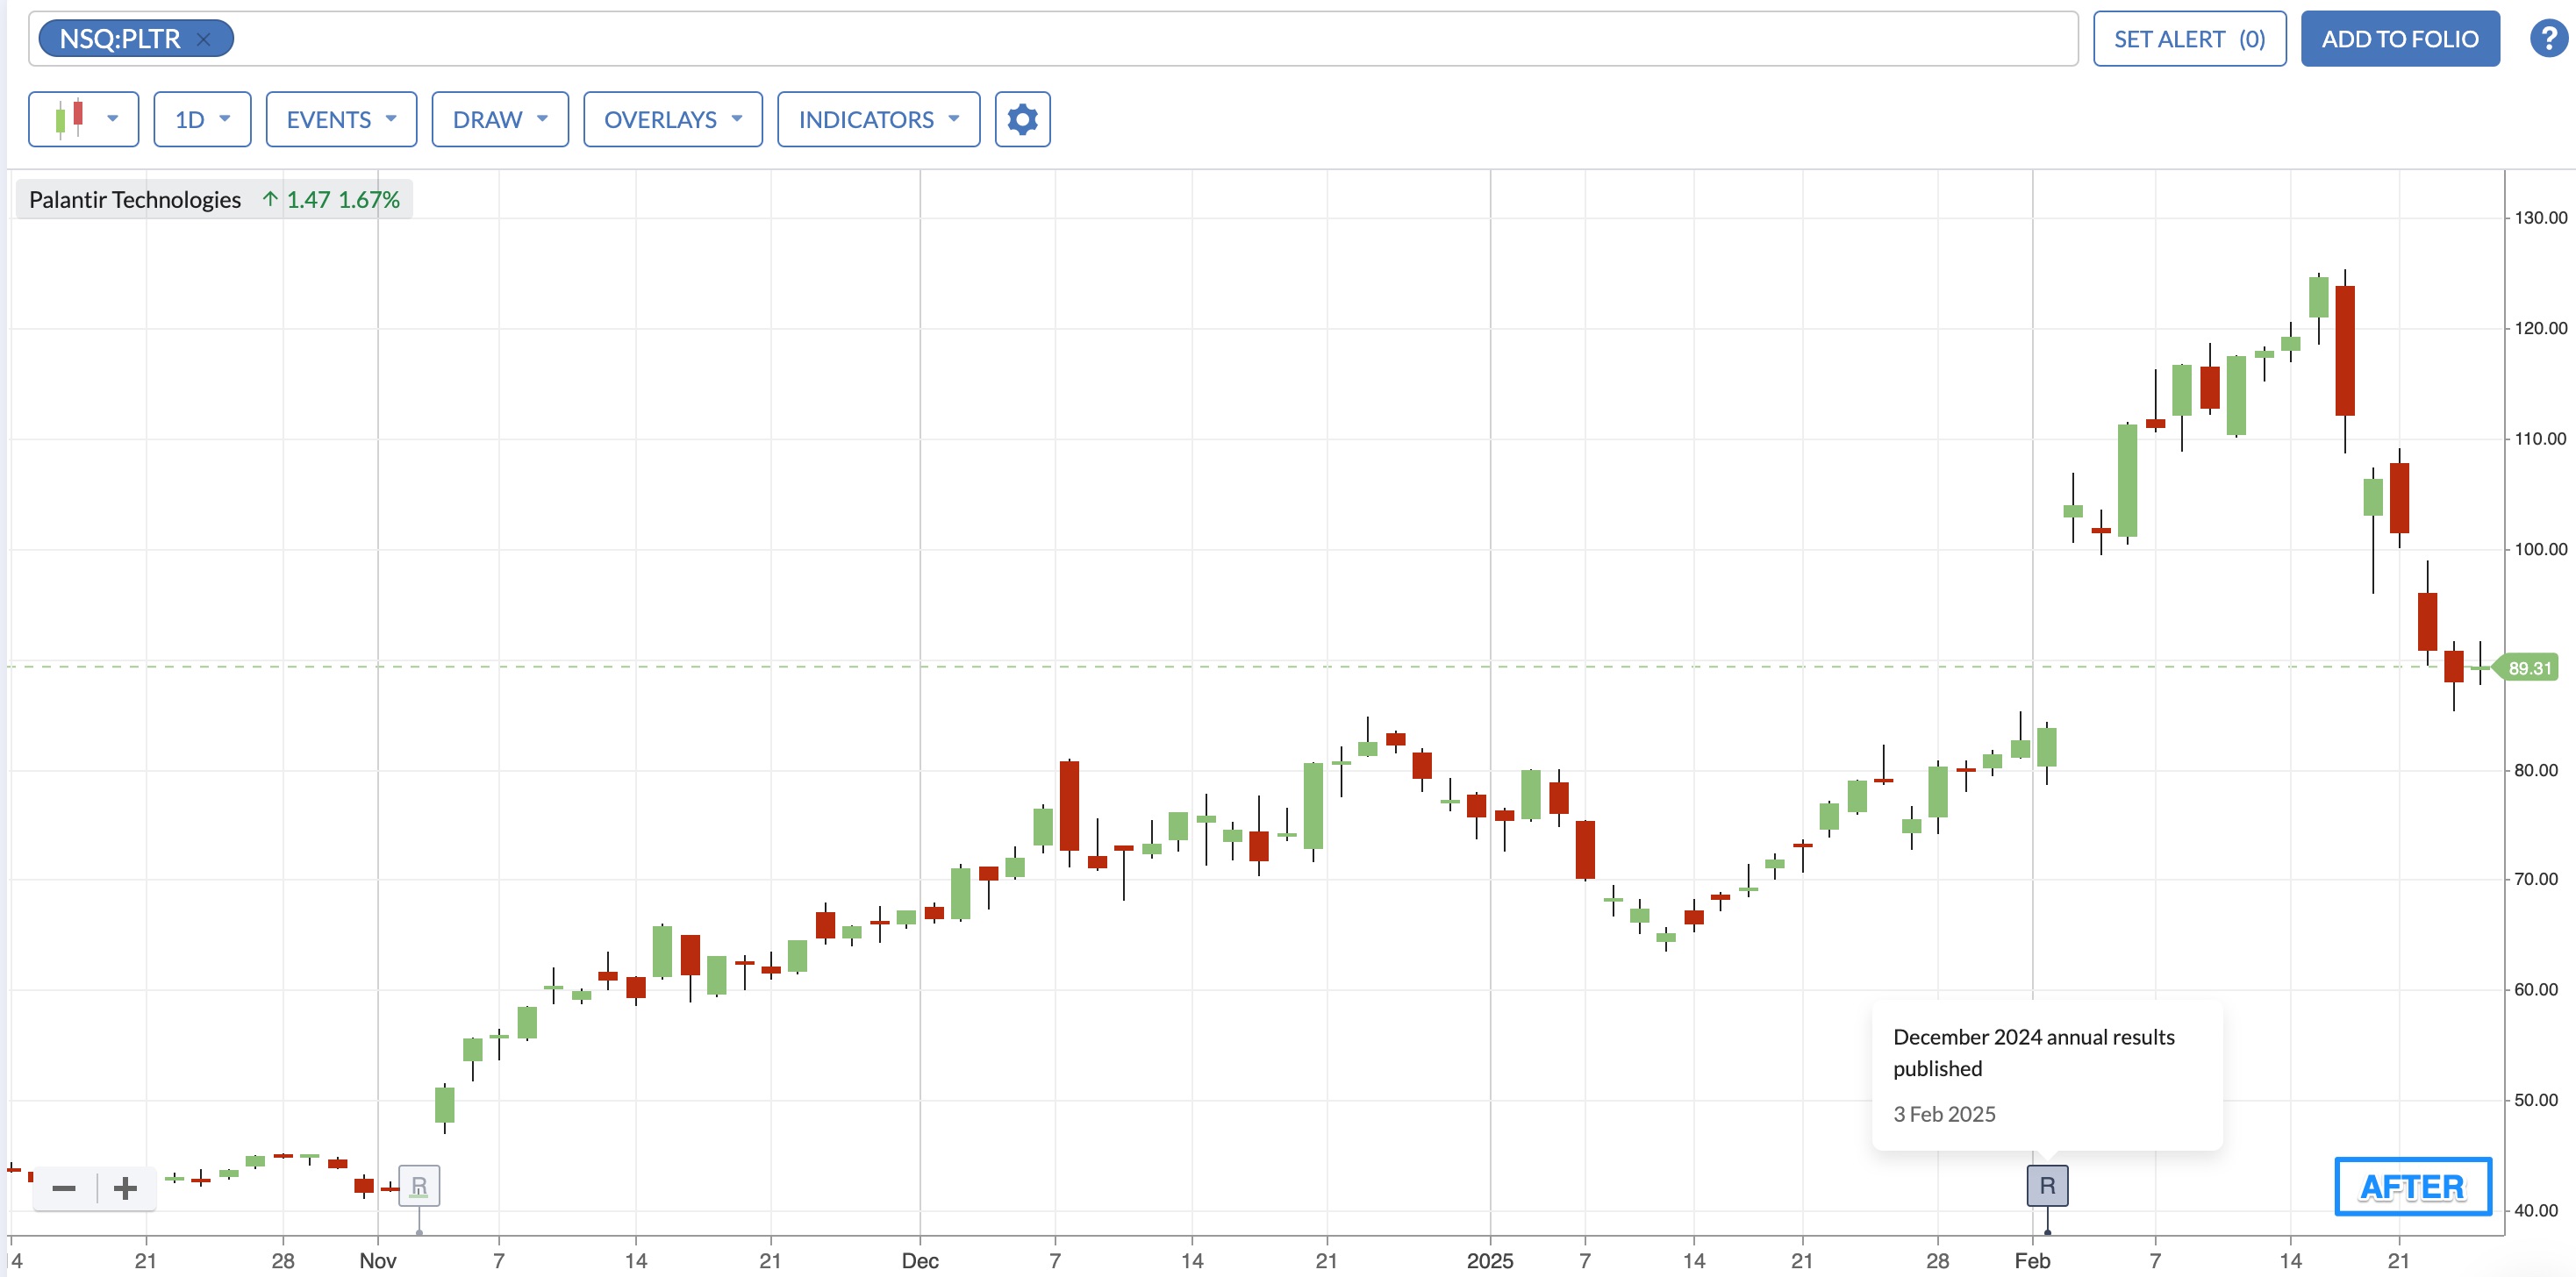
Results events are now displayed based on their release date rather than the financial year date to help identify how the market is reacting to the new information. This can be used to help identify the ‘jump’ as Ed recently wrote about here.
Before: Event shown on 31st December (period end date)
After: Event shown on release date.
For more details on adding events to your charts, visit this guide.
Filtering Comments by Company
Building on our last update, which allowed jumping directly to company analysis within articles, we are now introducing comment filtering by company to help you narrow down the discussion on the company you are most interested in.
- Within an article, you can now filter comments by the stocks tagged in that article.
- This will filter the comments to by those directly tagged with that security and also any linked replies, ensuring you do not miss important conversations.
Looking forward
We are continuing to build on the theme of enhancing ways to keep you informed of the most important events on the day - expect to see some changes to the news portal in the upcoming weeks.