Remembrance of Things Past: Mello 2014

Just over 2½ years ago I attended the Mello investment conference up in Derby; a whirlwind of inspiring lectures, company presentations and face-to-face meetings with management. At the time a number of companies caught my eye, many of which I labelled as being just a little too expensive to invest in, while a few felt like good ideas more suited to private ownership.
A few weeks ago I unearthed the conference brochure with original Stockopedia figures for all 36 companies. About the right size for a diversified portfolio and, more usefully, a great opportunity to see if these at the time figures correlated in any way with future performance. The key question then that I want to address is whether we could have used any piece of data at the time to help us separate the winners and losers. After all this is at the core of what we, as investors, try to do with tools such as Stockopedia.
Editor's note - we have managed to dig out the original conference brochure from the Mello 2014 event. You can download it here.
Obviously this isn't a statistically rigorous analysis, with so few data points, but that's never stopped anyone before. I've tried to keep the statistics to a minimum by fitting only a simple linear regression model (i.e. a straight line) to the data and calculating how closely the points fit this line. In broad terms a higher value of R2 implies a stronger correlation with performance in the graphs that follow.
Oh and it's worth remembering that the last 2½ years are just a slice of the current bull market and hardly representative of any other market condition (such as a proper bear market). So on the basis that all of my analysis might be bunk let's move onto the numbers.
Value Rank
Value investing has a long and glorious history and I started out as very much the value investor; unwilling to pay a high price for shares and concerned with identifying overlooked value. So has value paid off?
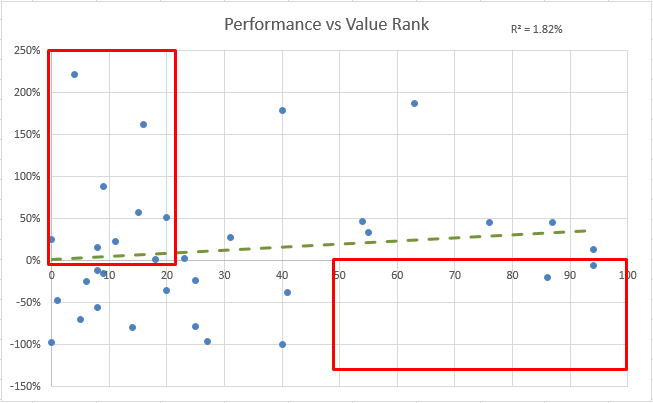
While there is no direct correlation between Value Rank and performance I've highlighted the two areas which seem most interesting. In the top half of the ranks, where only a quarter of the companies sat, there are almost no losing shares and the drawdowns are small. At the other end of the scale there are plenty of losing shares but also a significant number of big winners (returning >50%). It's as if the Value Rank helps protect your portfolio from losses but at the expense of reducing your exposure to out-performance.
Momentum Rank
In the current bull market it does feel like momentum is king as numerous shares seem to double and then double again. Would this have helped identify winners?
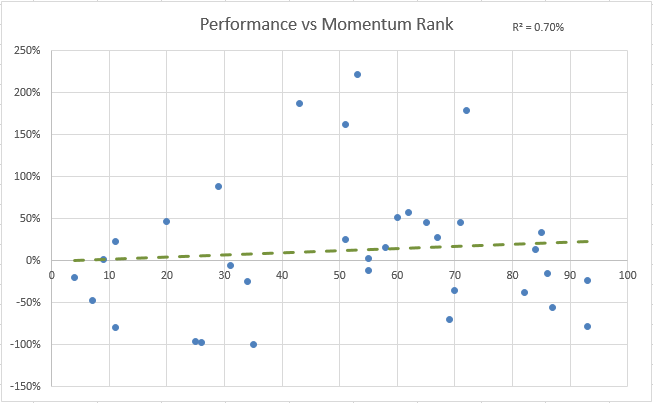
Well this is one of the weakest correlations with share price strength up to November 2014 proving unable to suggest any sort of trend continuation. I'm quite surprised by this result but I wouldn't like to draw any conclusion from this data.
Quality Rank
Quality of earnings is a hot topic at the moment and I increasingly find myself choosing quality over value when making investment choices. Partly this is down to my realisation that quality in all forms (management, economic niche, return on capital) translates into long-term success but also I have a soft-spot for companies that do things well.
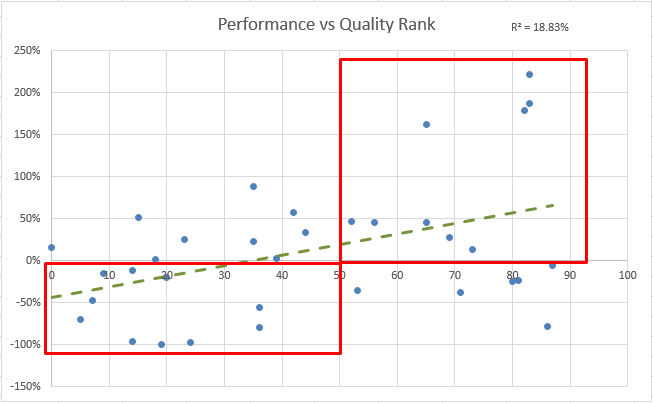
This is the best correlation so far with big winners scoring high on quality while the bulk of losing shares scored low. There are winners and losers at all ranks, with lots of scatter, but low Quality Rank does feel like an impediment to success.
Stock Rank
Now you'd think that the overall Stock Rank, a blend of the other rankings, would be the most discriminatory measure of all. I tend to use the Stock Rank as a shorthand for picking "good" shares and so I'd like to see some correlation with performance.
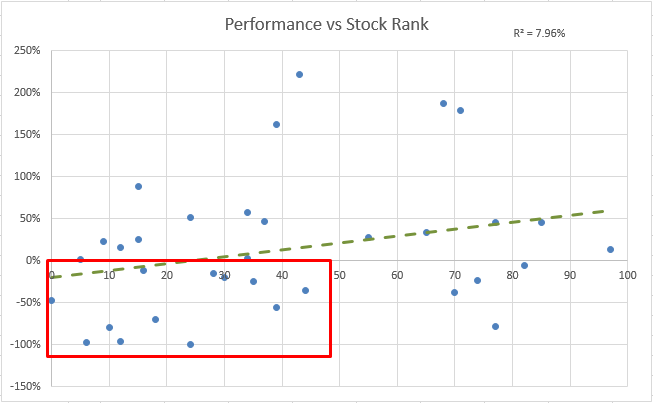
Well a low Stock Rank does tend to imply poor performance; any shares with a rank in the lower third of the portfolio struggled in recent years. However a high initial rank doesn't correlate with return with the big winners starting in, roughly, the 40-70 Stock Rank range.
ADVFN Posts
On a lighter note we all "know" that a very busy bulletin board is often a warning sign of ramping and de-ramping while a quiet board makes us feel part of a special club. Now ADVFN has possibly the widest range of active boards in the UK - certainly the wildest - so does this common knowledge stack up?
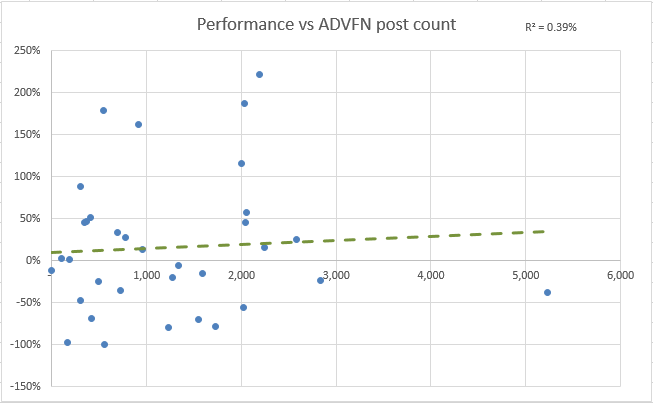
Okay I guess that the answer is a resounding "no". It doesn't seem to matter whether a share has 20 or 2,000 posts to its name, which is reassuring, although it would be great if there was a correlation here to exploit!
Dividend Yield
More sensibly again we all “know” that paying out a dividend suggests that a company is generating real cash and this forces some rigour on the directors. Sadly less than half of the Mello companies paid a dividend back in 2014, at an average yield of just under 2%, but there's no point stopping now.
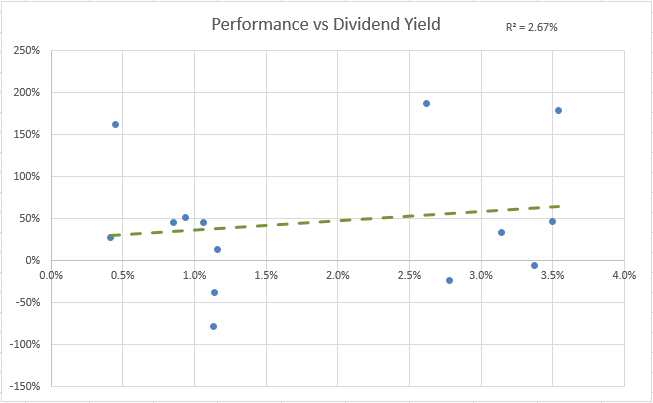
It turns out that any level of dividend does tend to filter out the dross and leave you with shares that are going to do ok at the very least. I don't think that the absolute value of the dividend matters - it's enough to be financially strong enough to pay one in the first place.
Share Dilution
Another idea, which feels sensible to me, is that companies which keep issuing shares and diluting existing shareholders may not be good investments. So I've taken the share count back in 2014 and calculated a CAGR (compound annual growth rate) for each company based upon the number of shares outstanding today. How does this relate to performance?
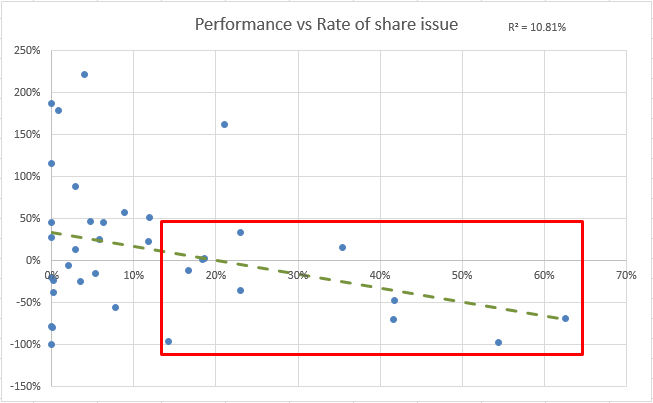
I think that this graph is a story of two halves. There are plenty of shares (the majority, in fact) that have issued anything from zero up to relatively small numbers of shares (<10% CAGR) and performed variably. Then are those companies compounding up their shares at >15% and (apart from outlier Ideagen) there's a strong correlation between dilution and lacklustre performance.
Risk Rating
Recently Stockopedia released the Risk Rating where historic share price volatility is used to classify each share. This wasn't available back in 2014 but I've decided to use the current rankings for each share on the basis that volatility is an enduring characteristic (over 2½ years anyway). Given that Mello didn't feature any of the least volatile shares how does the average return in each of the four remaining buckets look?
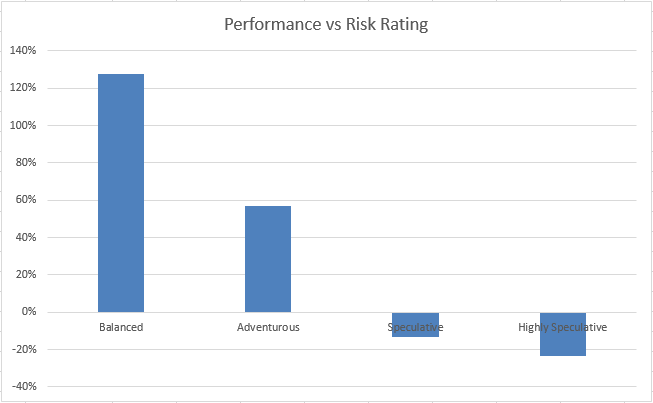
Wow. I am concerned about current risk ratings being driven by performance (and I'd love it if the Stockopedia wizards could tell me the ratings that these shares would of had in late 2014) but if this isn't a factor then the correlation is stunning. On the face of it we'd all be better steering clear of speculative/highly speculative shares altogether.
Conclusion
For all that this a rough and ready piece of analysis I'm quite pleased with the outcome. It's clear that none of the metrics are a silver bullet for guaranteed success (and I checked plenty, such as P/E, ROCE and relative strength, that weren't even interesting enough to include). Instead many of them add value by weeding out the weaker shares and tipping the odds in your favour; here I'm looking at the Quality Rank, some sort of dividend yield and an aversion to issuing new shares.
Most surprising, to me, is just how much the Risk Rating results look faked! I didn't expect such a clear-cut result and I'm wary that using current rating values has biased my results (and the buckets are small with only three shares in the "Balanced" category). Still the result is so striking I find it difficult to believe that it isn't reflective of the underlying danger of high volatility - it damages your wealth.
Disclaimer
This is not financial advice. Our content is intended to be used and must be used for information and education purposes only. Please read our disclaimer and terms and conditions to understand our obligations.
26 comments
Hi this is my first comment here. I am a very new investor. I was curious to note Ed Croft that your table above does not include those stocks that are labelled as neutral although they are quite high ranking! Any thoughts on how to think about the performance of neutral labelled shares.
@bestshare9 - thanks for posting and please do more. You'll find the community very responsive. We've found that the neutral set of shares (on average) performed right in the middle between 'winning' styles and 'losing' styles. I'm trying to get round to writing an ebook on the Styles, but in the meantime watch the webinar & read this help article (which needs some hard editing!)
It's important to note that while the Unclassified/Neutral stocks performed on average very moderately, there is a third of the market in this bucket. There are all kinds of varied results within the neutral style set, and you can find plenty of 90+ StockRank shares in this set.
If you imagine a cube with the Q, V and M Ranks on each axis in 3 dimensions. The 8 style archetypes are at each corner of the cube. We classify them in this way. The neutral stocks are those that aren't near any corner, but that doesn't mean they can't be quite highly ranked. If the community forgets to dig around in these Neutral shares they may miss quite a lot of opportunity!
"On the face of it we'd all be better steering clear of speculative/highly speculative shares altogether."
Actually some speculative shares have done very well, for example Boohoo.Com (LON:BOO), £G4M, Best Of The Best (LON:BOTB), MySale (LON:MYSL), Purplebricks (LON:PURP), all of which featured in Paul's BMUS portfolio, without those out it would not have done nearly so well.
Maybe you should beware of speculative shares that are presented at Mello.
It's speculative low ranking shares that you really want to avoid. Speculative high ranking shares have done pretty well since we launched the rankings, but you do find quite variable results. See the webinar slides I did recently - check the back of this deck - http://img.stockopedia.com.s3....
Here's the Risk Rating + Style slide.
Ed, thanks for the figures, that is more in line with my view. However some low ranked speculative shares have performed pretty well such as Purplebricks (LON:PURP), £G4M and MySale (LON:MYSL).
Of course we have been in a bull market since Brexit vote, I'm sure the results would be far different in a bear market.
Amazing. Thank you Damian
Thank you Damian, an extremely helpful article/analysis - which reinforces the direction that factor investing has for the private investor. I have done a bit of work on which ranges of Stocko's QVM I prefer & tend to ignore SR.
It depends on what stage of it's cycle & that of the UK Mkt but for those in 'Early Days' I look for :- Q>65 ; V< 56 ; M > 65 & as they mature Q & M increase by at least +10.
I do not aim for the very top performers but attempt to find those that could make it to SR 80-90 as in a Bull mkt they rise about the same % as the highest decile from mkt lows.
Clearly for me as a more cautious investor Quality is the Key factor with M & V a little further down these scales.
Thanks also to Ed for the Stock Classifications & his referral to the book' Higher rtns from Lwr Risk' ( recently finished) along with his excellent revue. Stockopedia has provided me with a completely different perspective on Equity Investment ; been a long time coming from early start with Investment trusts 50 years ago...but truly worth the wait. Thanks again.
Hey Damian, Stockopedia 'wizard' (you said it not me!) here. I've computed some RiskRatings for those stocks on the 4th of November 2014, though we don't have data for all of them anymore due to a couple of delistings etc. Anyway, here's a little spreadsheet you can have a play with:
https://docs.google.com/spread...
This is the chart for performance vs RiskRating as of that date:
Quite a result for the low volatility stocks but take note of the counts by RiskRating in the aggregate stats. There were not many conservative or balanced stocks in the set so I don't think the results are typical. We do expect low volatility stocks to do better but that spread really is enormous for this little set!
Anyway, great post, thanks a lot for sharing.
Great work Tom and what a result (although I take your point about the low number of stocks with low volatility). I'll pull your data into my spreadsheet later as I'm quite interested in seeing how the risk ratings have changed for these shares.
Cheers!
Very good article well done Damian. It has open my eyes to Quality and Yield.
Kofiaddo - regarding the impact of quality - have a look at the Profit Warning Survival Guide - a research project that we carried out last year into about 250 profit warnings. There are some good insights into the Quality Rank there - http://www.stockopedia.com/books/profit-warnings/
Is it possible to look at the Growth Rank too as I'm wondering if value investing is not correlating particularly whether the Growth Rank, at least for a short period of time, was correlating better with performance?
Unfortunately not as the Growth Ranks weren't included in the guide at the time. Bit of a shame.
Very interesting ED - well done. Is it possible to get the share price for these 36 companies at the time of the Mello Conference or have you done that and I missed it?
I wonder if three is weighting factor that could be applied to the three components of the stock rank that would produce a better correlation?
Panmure Gordon is no longer listed. I see Crawshaw is there -as most will know it soared up and then down.
Quite a few story stocks there which have not really done much yet eg Ilika and Surface Transforms.
Surely Panmure is Panmure Gordon & Co (LON:PMR) ?
Totally agree on the story stock angle. All of these companies had something worth considering back in 2014 though and I find the divergence in outcome quite remarkable. Perhaps some of these stories will come good even now but how long is it worth waiting for?
@all I found the original brochure - now linked in the article and available for download here. It took a bit of work at the time I remember ! https://assets.stockopedia.com/events/Mello14.pdf
That's outstanding work Ed - puts this analysis nicely into context.
Also the two that don't appear in the Rank graphs are Paragon Entertainment and Cambria Africa as they were only £3-4m in size and Stockopedia didn't calculate any values for them (at the time).
Thanks Damian - very useful.
Damian - what an absolutely superb analysis. I'm glad the correlations go in at least a favourable direction for the methods - albeit not the highest R-squared.
The Risk Rating analysis is fascinating... go-go Low Vol investing !
Thanks very much Ed. I'm in the middle of reading "High Returns from Low Risk" and the arguments are pretty compelling. I wouldn't mind a bit more analysis across different markets and time periods but you guys have done some excellent work here.
Still I'm pretty convinced by the low-vol approach. Intuitively it makes sense if share price volatility is really a reflection of underlying uncertainty in how consistently/reliably a company makes profits.
Oh yes no problem - here they are:
NB Rightster changed name to Brave Bison while Synety changed to CloudCall.
I would echo that -be very useful to have the 36 companies named. No doubt some have done spectacularly well and others drifted away.
Could I ask what were the 36 companies and which two of these you missed out of your analysis?