This is what happens when you’re working from home and your attention begins to wander come Friday afternoon…
So my thought process when looking at my holding in Spirent Communications (LON:SPT) today, when it was trading around 298p, went something like this: 'I like it when stocks hover just below a round number, they often pop higher when they break through….......... well if that’s true, it should mean fewer stocks will sit just above a round number......... I could probably check that.’ Hence I decided to download all the pricing data from the FTSE All-Share index into Excel, and have a play around!
If share prices are relatively random (note: share prices, not company valuations), then we should expect to see roughly 10% of share prices land within each decile between the big round numbers, such as say 300p and 400p: i.e. 10% of stocks having a share price of 300p – 309.99p, 10% with a share price of 310p – 319.99p, and so on.
Over time share prices move around a lot, therefore if we do discover any patterns, this could probably be attributed to behavioural reasons, rooted in investor psychology.
The theory I’m testing is that once a share price breaks its round-number resistance (e.g. moving from 298p to 300p or 29p to 30p), selling pressure reduces / buying pressure increases, and it’s off to the races. Therefore it shouldn’t linger at say 300p – 310p for very long, but race higher.
What does the data tell us?
The exact opposite!
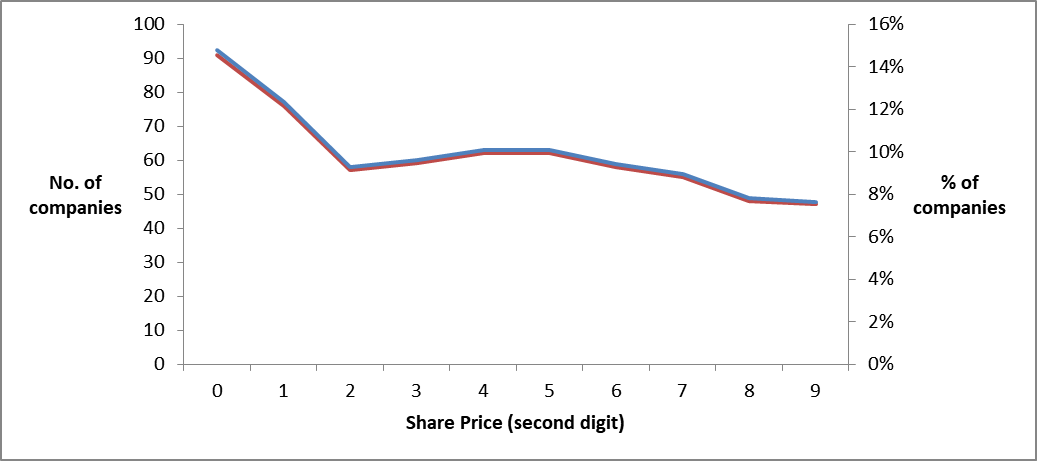
Lots of stocks are sitting just above their round-number resistance, at the equivalent of 300p – 309.99p. So I need to turn my theory on its head – stocks often sit just above their round-number support levels, and once they breach this support a further collapse may be likely – they’re possibly more inclined to move from say 300p to 250p in short order.
Of course, this is one snapshot in time on a random Friday in October. A proper time-series analysis would need to be conducted, to get meaningful results and uncover any true patterns. But it does suggest that something statistically significant may be going on, with 15% of stocks just above their whole number resistance, and only 7.5% sitting just below it with a 9 as their second digit. There are roughly double the number…