Last week, Ed wrote an excellent article called The Hump and the Bowl - understanding the patterns of Momentum. I am naturally sceptical about simple chart patterns and anyone who suggests that the future share price can be predicted by the shape of the graph of the historical one. However, I am a believer in Momentum. As Ed described, the academic evidence is clear:
- Over extended periods, stock prices tend to mean-revert.
- Over the medium term, winners tend to keep on winning, and losers keep losing.
- Over the very short term, mean reversion rules again.
While debates about how exploitable these characteristics are (short-term trading strategies naturally incur much higher transaction costs), there is strong evidence that these effects are persistent across time and geography.
I was challenged by Ed’s article; perhaps some chart patterns reflect underlying Momentum characteristics and market inefficiencies driven by psychological biases. “Bowls” may be one of these. Although Ed’s article focused on Momentum, I think this may be particularly relevant to Value Investors, such as myself. We tend to be drawn to the cheap, high-quality stocks; those that were once highly rated but are going through a difficult patch. My expectation is that these conditions are temporary, and mean reversion in corporate performance will lead to investors falling in love with the stocks again. However, my kryptonite is buying into stocks too soon, when weakness in corporate performance tends to beget further weakness.
My first thought is perhaps Ed is on to something with his description of a bowl-shaped graph representing Momentum-based opportunities. My second thought is, how do I find these? Ed gave a couple of examples that he has come across, and, of course, we can go through all 1350 stocks listed on the UK market and look at the graphs. However, it would be a lot easier if we could screen for potential bowls. As a big fan of screening to generate new ideas, I gladly accepted the challenge.
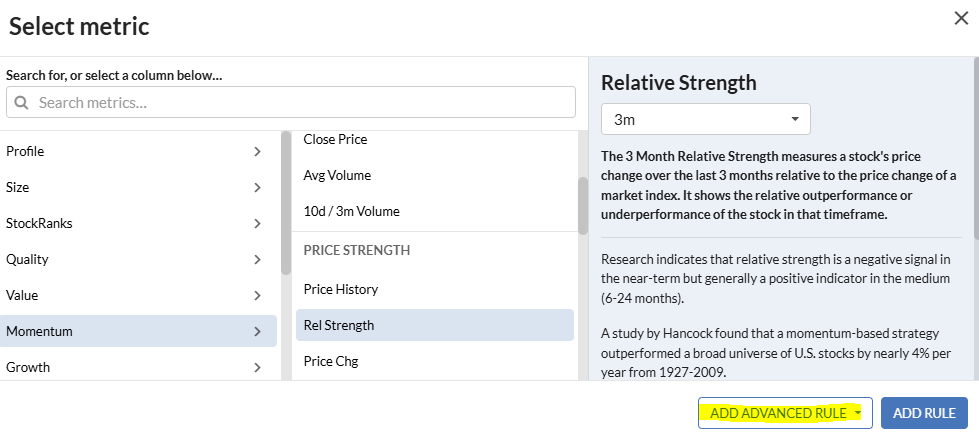
Screen Criteria
Large upside
The first thing we are looking for is to take advantage of the long-term mean reversion in corporate performance and stock prices. This is the other side of the bowl. Here, I am looking for stocks where the share price has fallen by at least 50% over the last three years compared to the wider market. This suggests that the stock should at least double if it returns to its…