Can someone explain to me the EPS growth percentages in green for SFR as i don't think they correlate with stockos figures ? Check them out for yourselves : the EPS only goes up slightly but stocko says it has increased by 60 % etc ???? I'm very confused ?


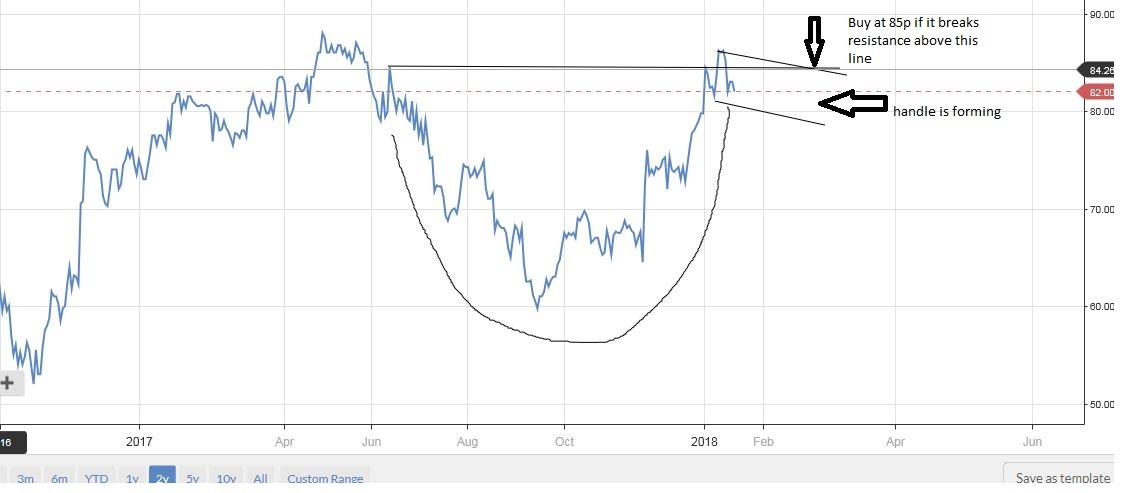
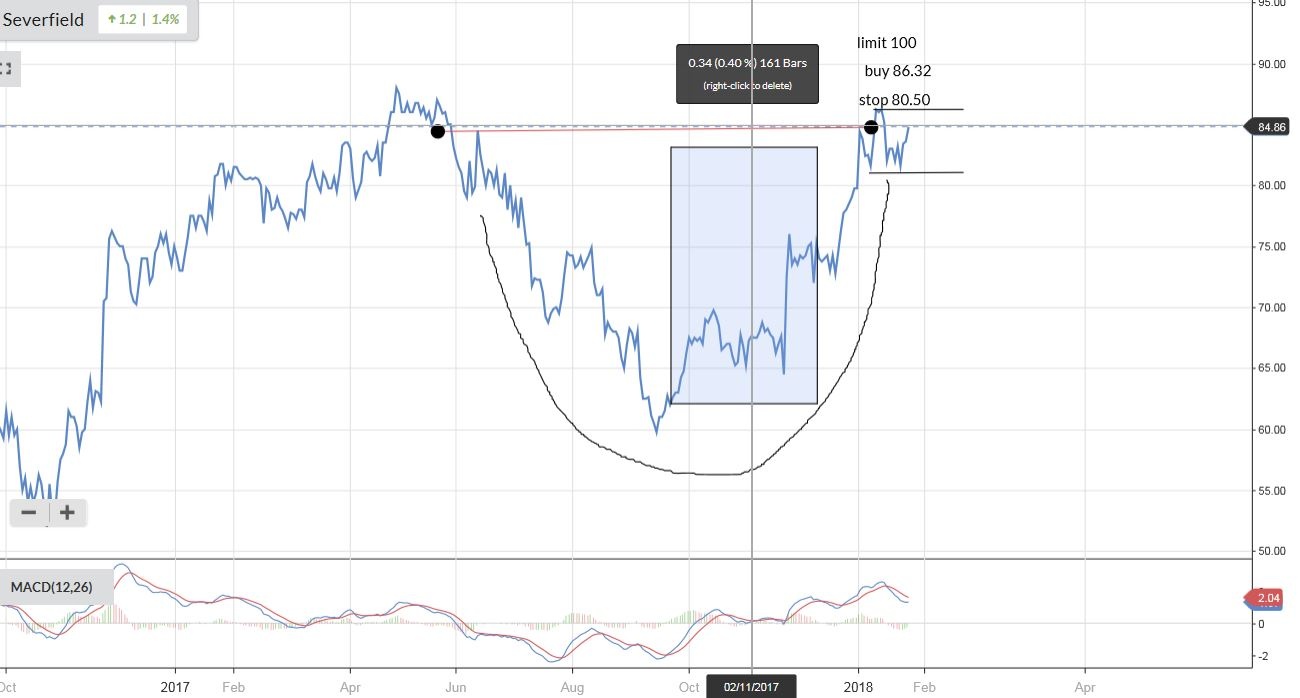
looks this could be breaking out soon. its forming a classic cup and handle chart which if it breaks above the handle at 85p will indicate further momentum. if it drops below the handle could be sign of a reversal.
heres a chart I quickly knocked up. its also moved past the 50mda
NAHL (LON:NAH) is another example of a cup and handle chart that broke out