Should you really buy and hold? Lessons from a decade of NAPS multibaggers

We’ve all been there. You buy a stock, the story looks good, but the numbers look better. You are delighted when the share price heads in the right direction quickly.
Even better, a year later you are sitting on a huge profit. 100% or more up.
Along the way, you’ve learnt more and more about the business. And of course, you’ve heard you ought to run your winners.
So you keep holding.
The numbers turn south. But you believe in the story.
Another year later. You wish you hadn’t.
All stocks are speculative
All investment is speculation. The only difference is that some people admit it and some don’t. Gerald Loeb
The truth is, many of the best returns available in stock markets are due to temporary mispricings as a result of extreme investor behaviour.
- Mr Market gets depressed about a share, creating a value opportunity.
- Positive results generate a bandwagon effect, and a momentum opportunity.
But value and momentum are time-bound phenomena. When a share is priced too cheaply, it eventually returns to a fair valuation. When a share price trends, it eventually overextends.
You can only capture these excess returns with an exit strategy. You have to know when to sell.
So buying and holding value and momentum stocks is not an optimal strategy. In fact, it normally leads to market average returns. Their share prices often revert to the mean, or (as we’ll see below) worse.
Yes, there is an exception to the rule.
If you can identify a “quality compounder”, the kind of stock that can reinvest over very many years at high rates of return, then buying and holding makes sense.
But these stocks are rare.
Let’s illustrate some of these ideas from the ten biggest NAPS winners over a decade.
Lessons from the top 10 NAPS winners
The NAPS Portfolio has a terrific track record. At a 13% annualised capital growth rate, the portfolio has almost quadrupled in value over a decade. It’s a portfolio that has beaten every fund manager in the UK over a decade, by applying just a few simple rules.
And along the way, it’s picked its fair share of big winners - even picking a couple that almost quadrupled in a single year.
But it’s what happened after these multibaggers were sold that really tells a story.
Did they continue to rise? Did they fall?
Let’s have a look.
The ones we’re glad we sold…
Gravity is a powerful force. It’s been unkind to four of the ten biggest NAPS winners since they exited the portfolio. Three have fallen more than 90%.
Think about these stocks. They all had a great story at the time.
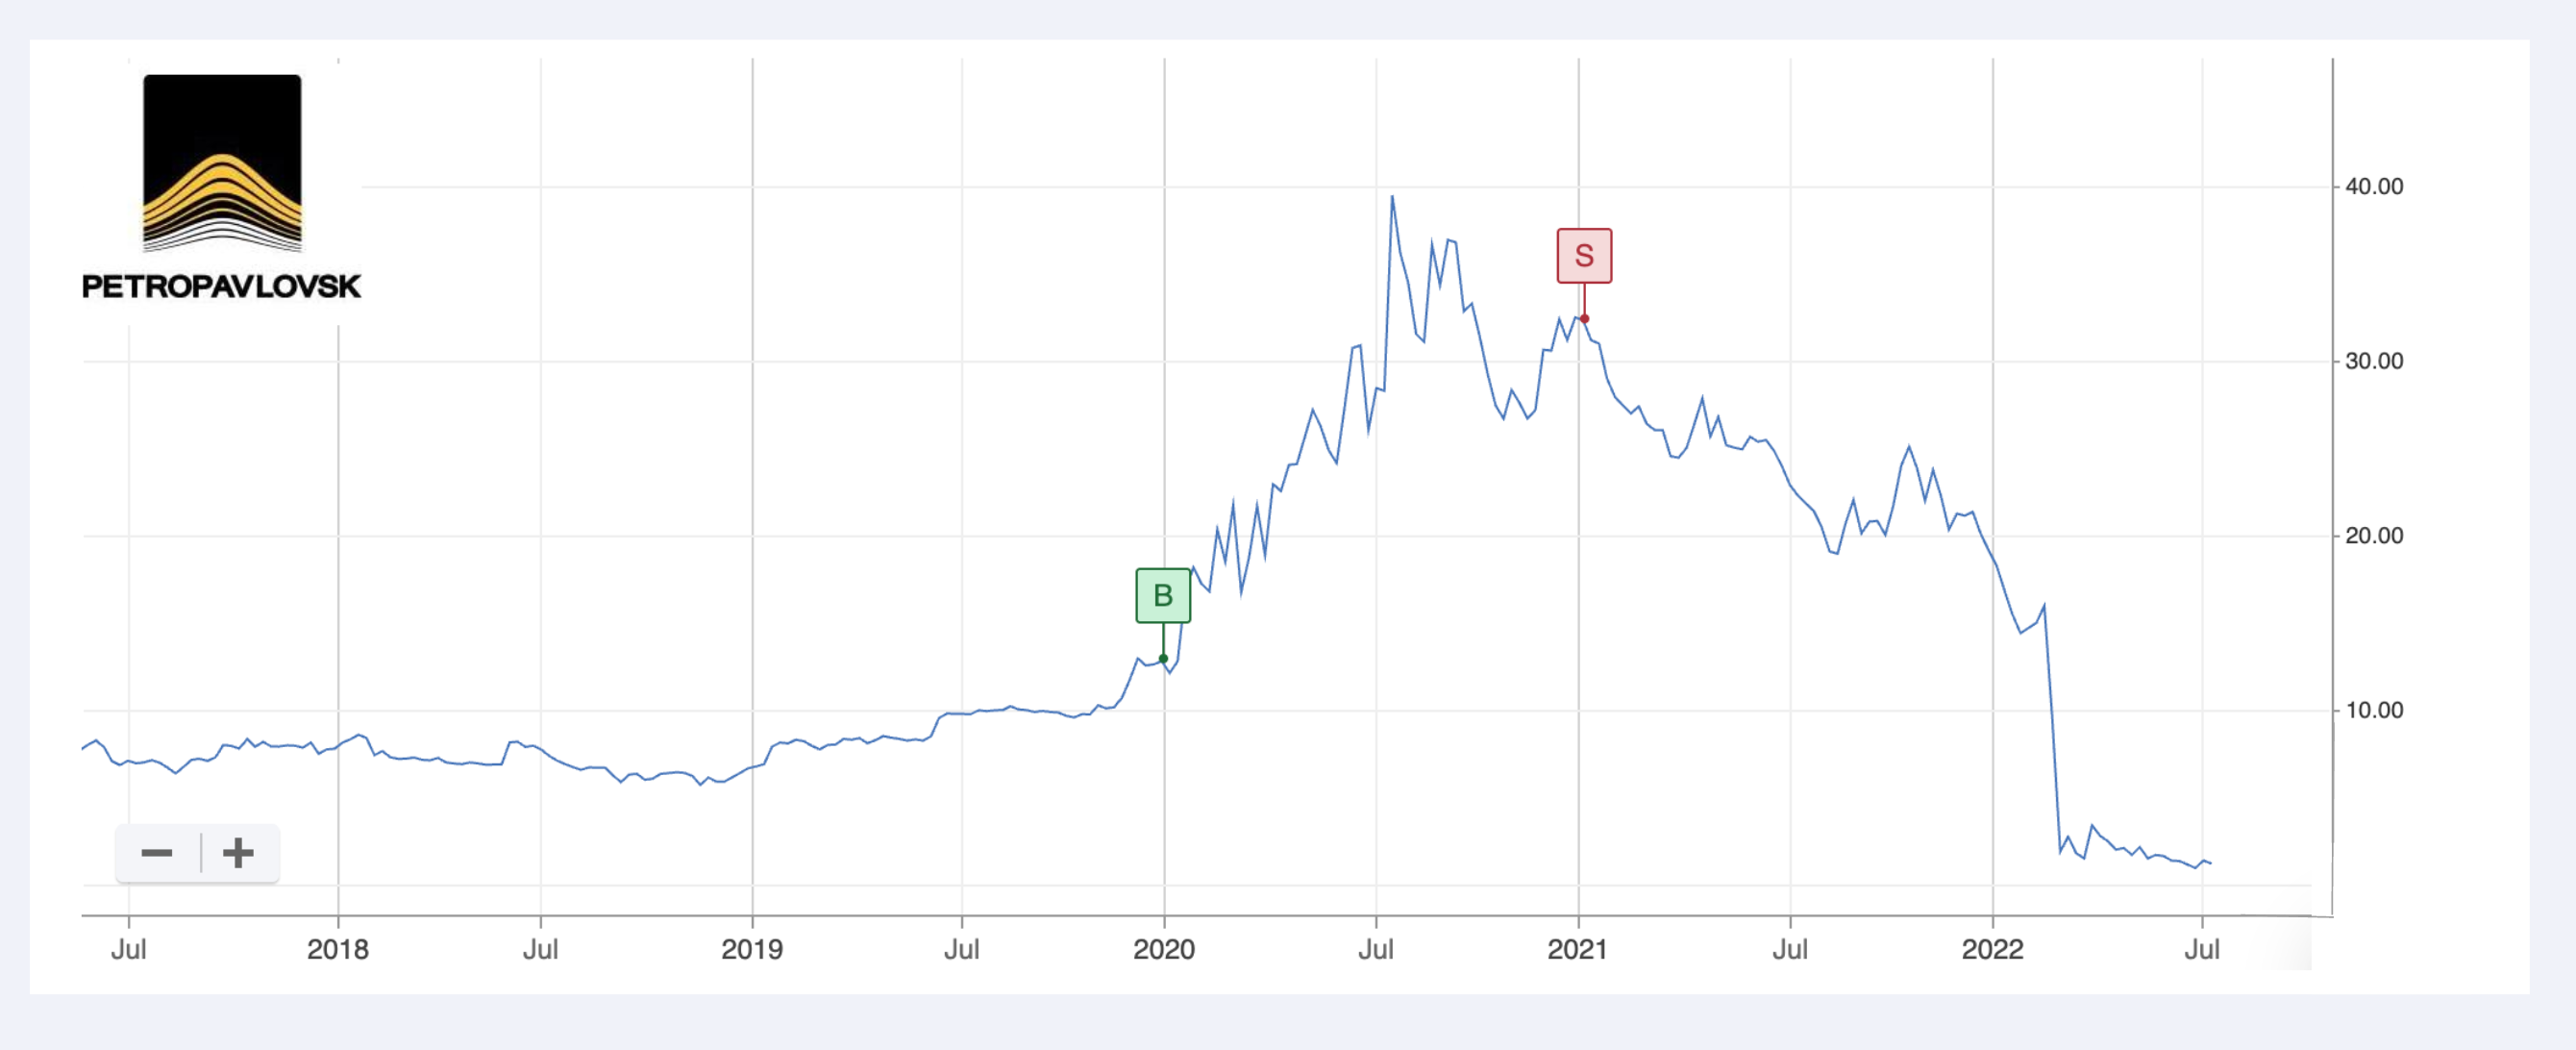
Petropavlovsk (was Peter Hambro Mining)
155% gain. (96% loss since sale)
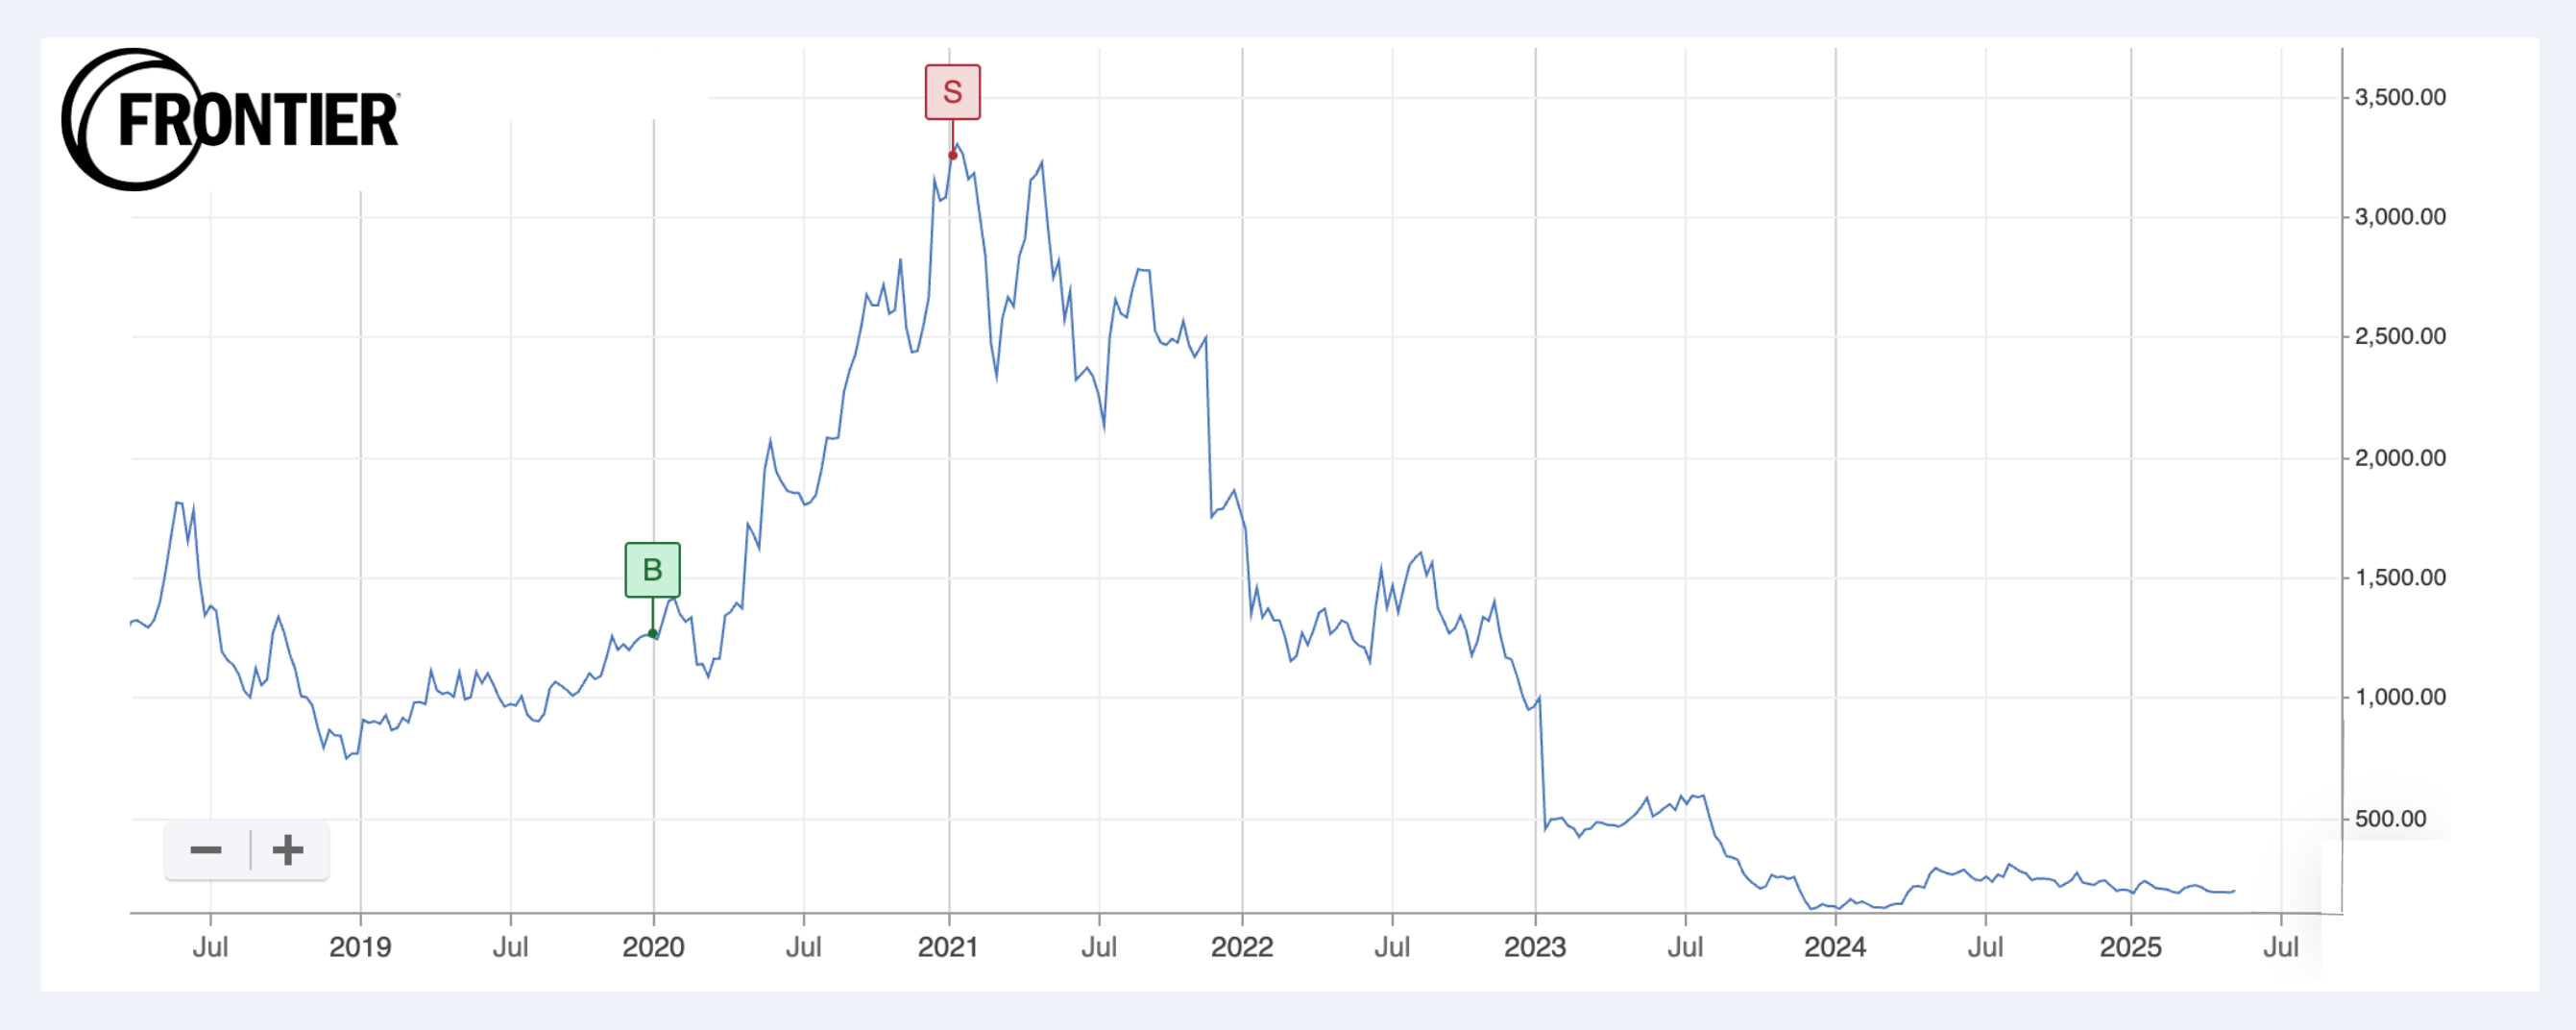
Frontier Developments
152% gain. (94% drop since sale)
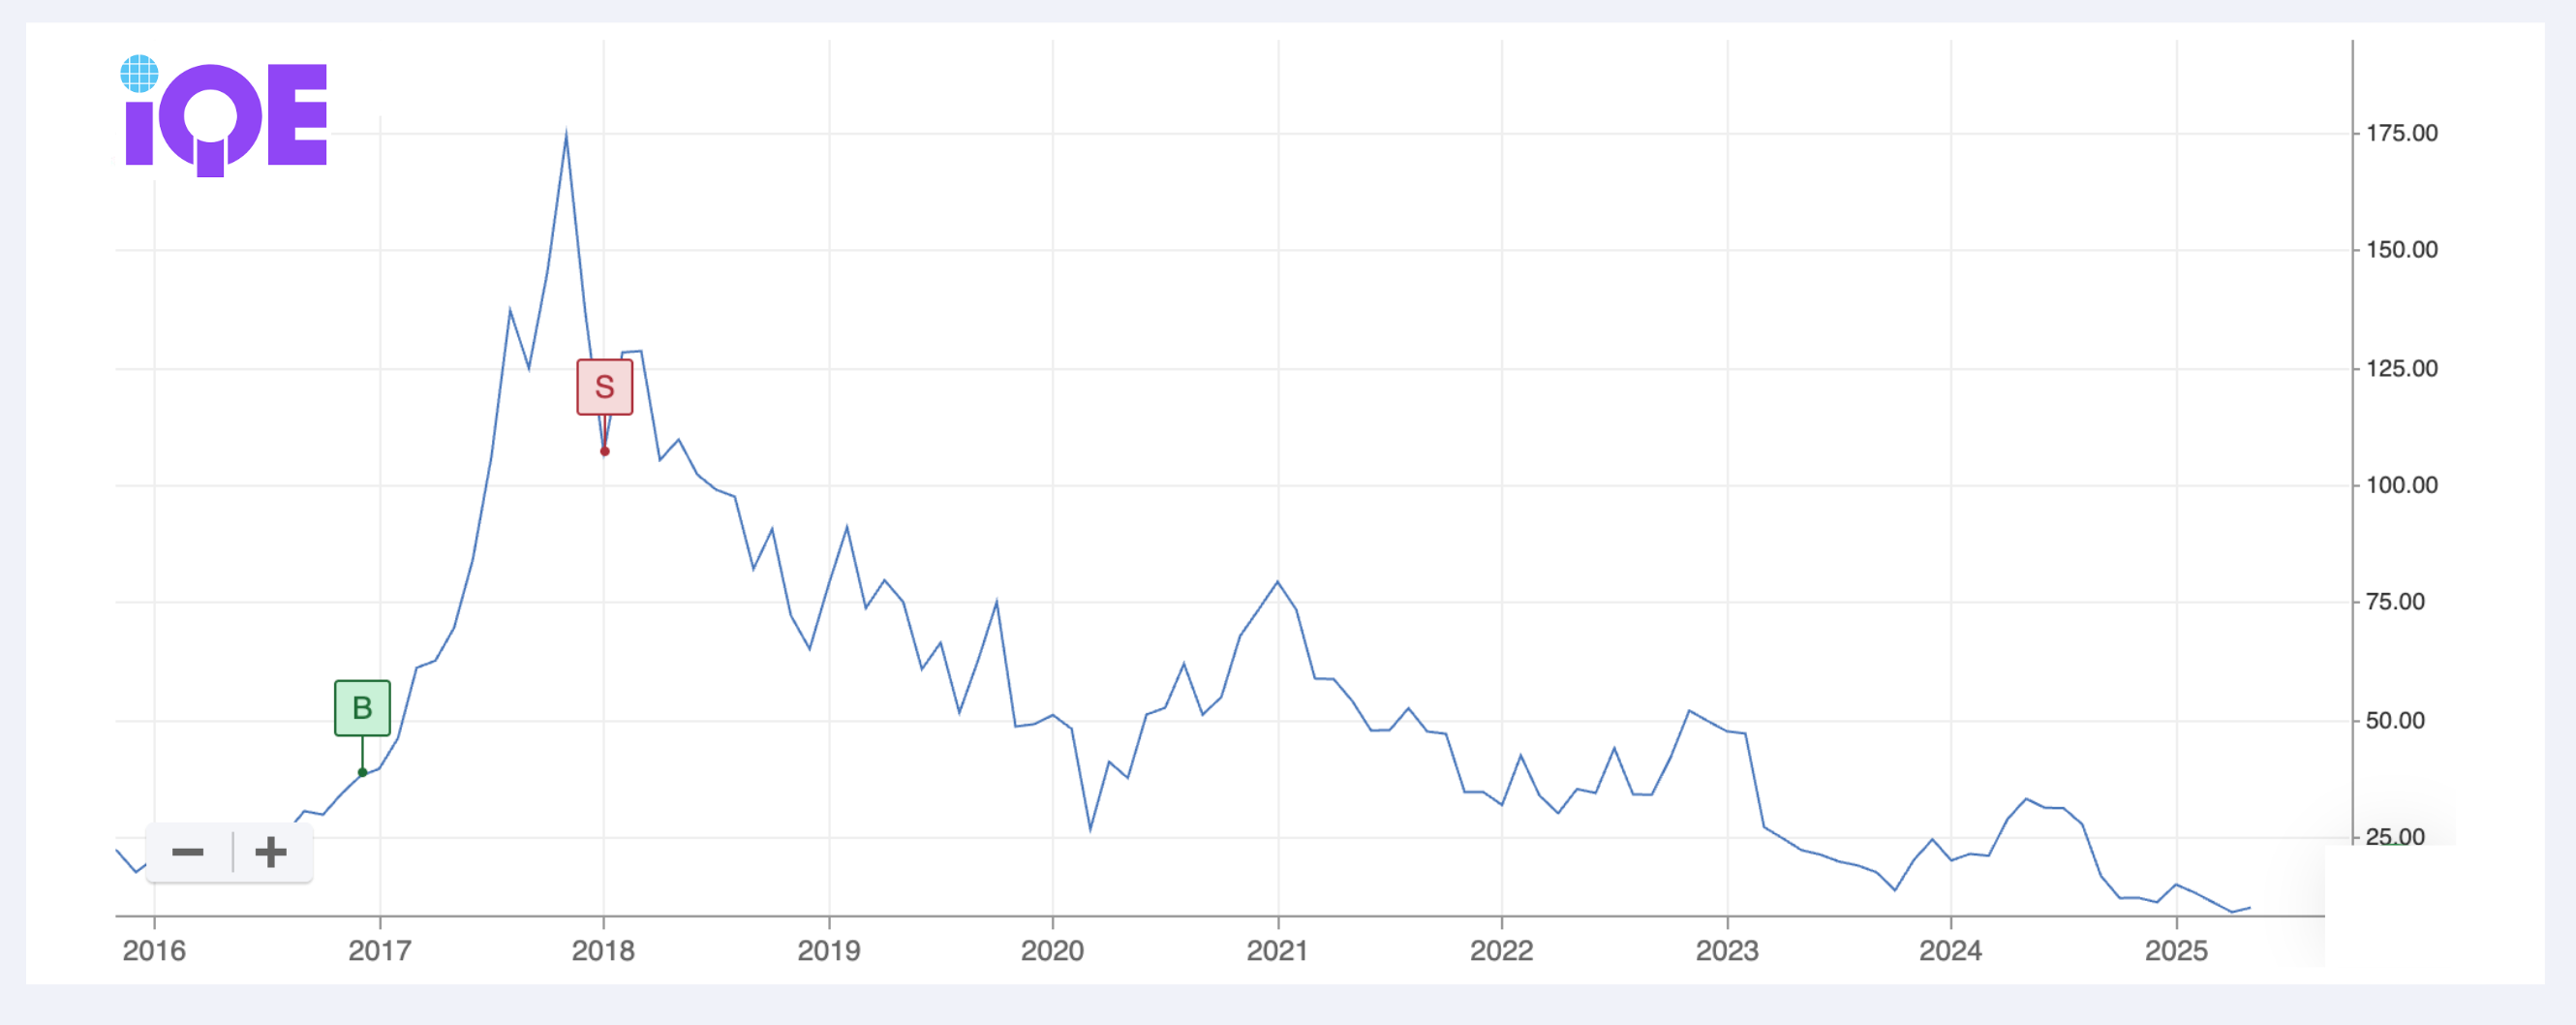
IQE
261% gain. (93% drop since sale).
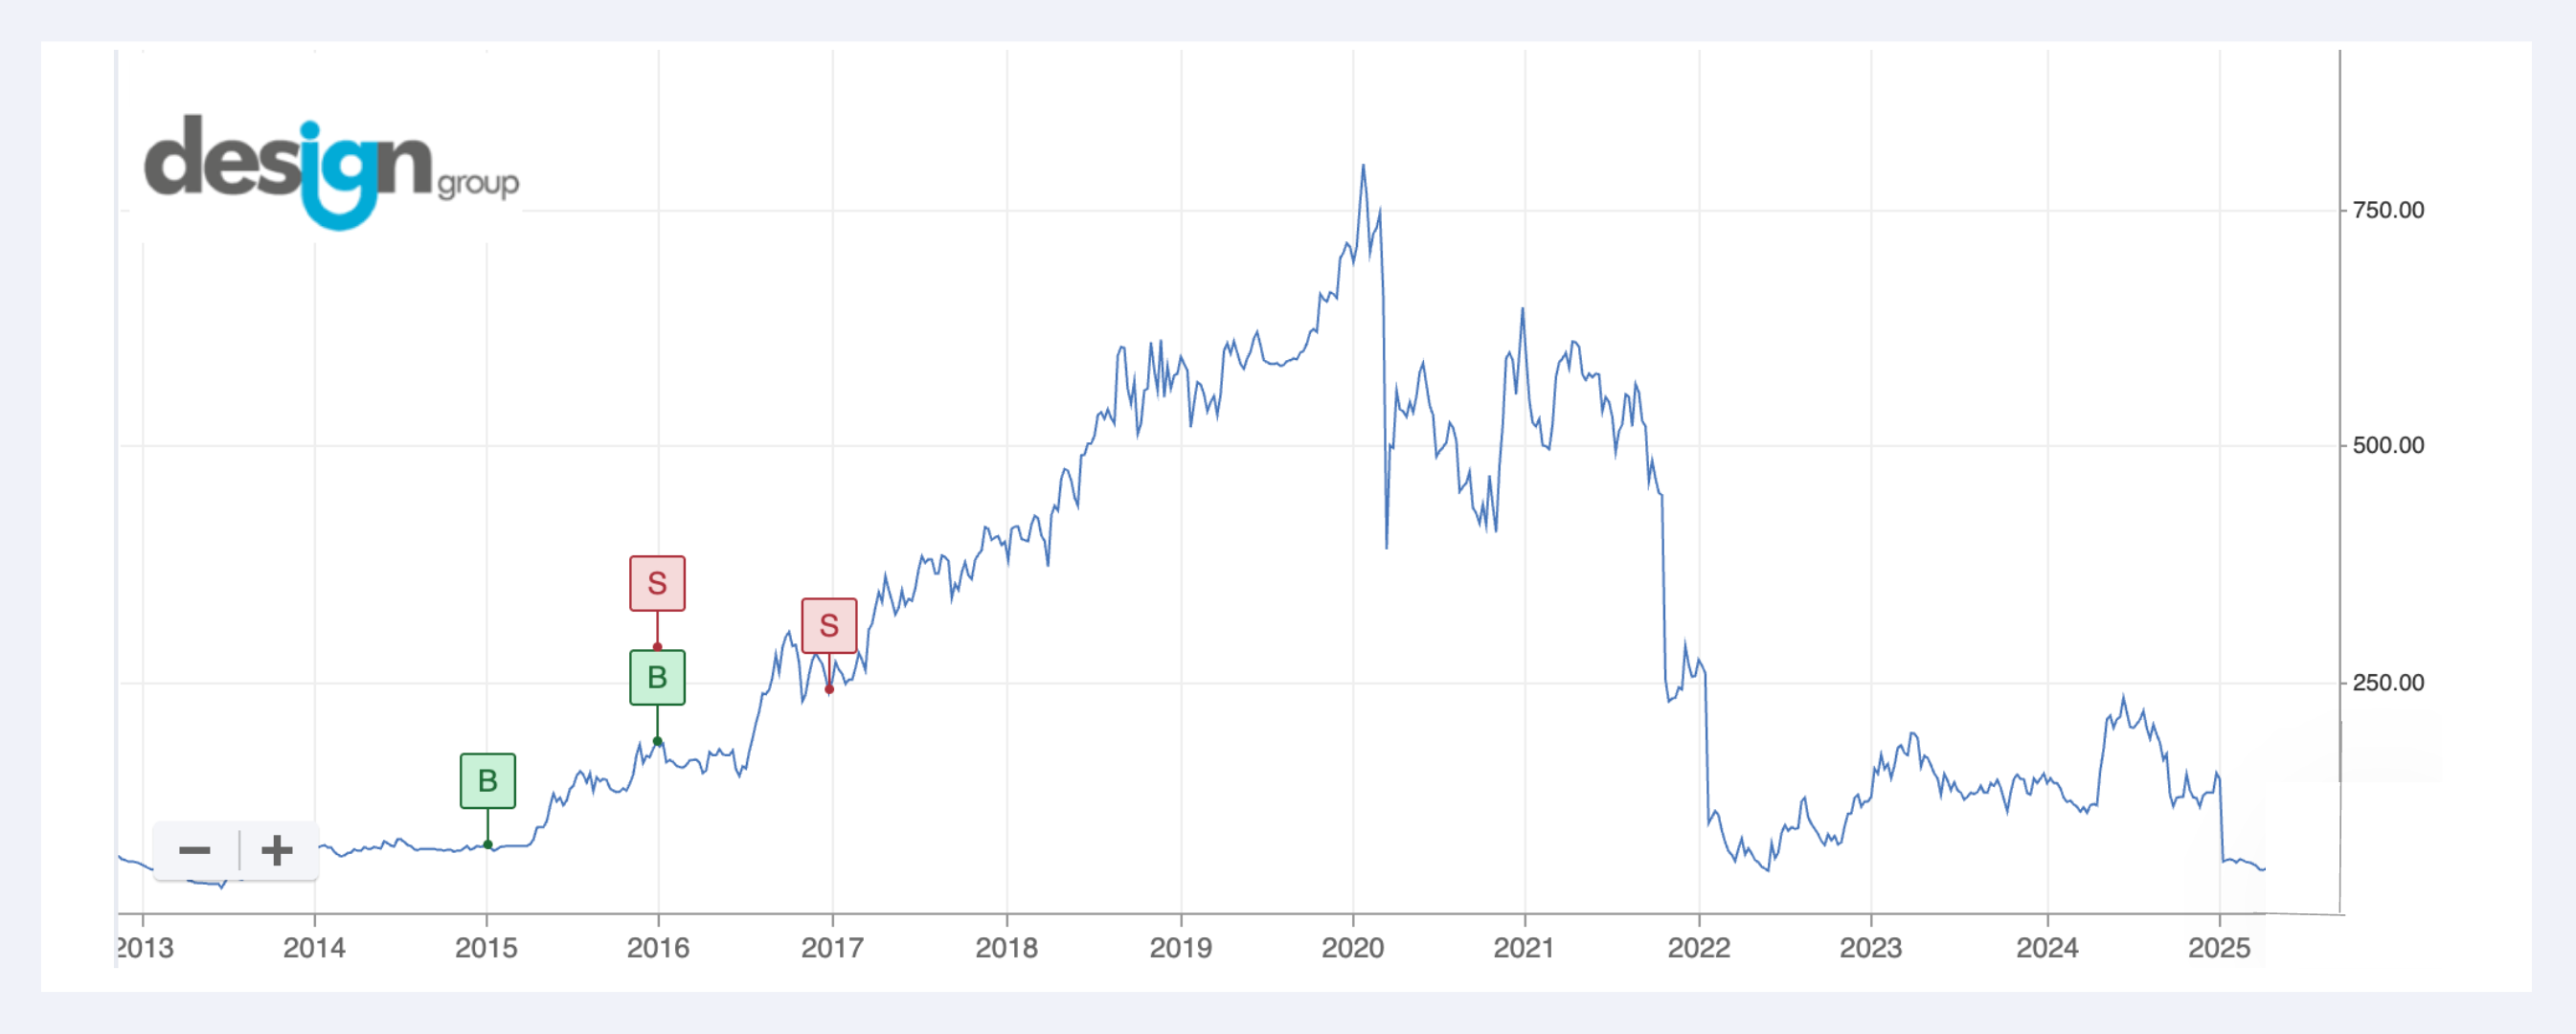
IG Design
147% gain, and 29% gain. (73% drop since sale).
The ones that went sideways
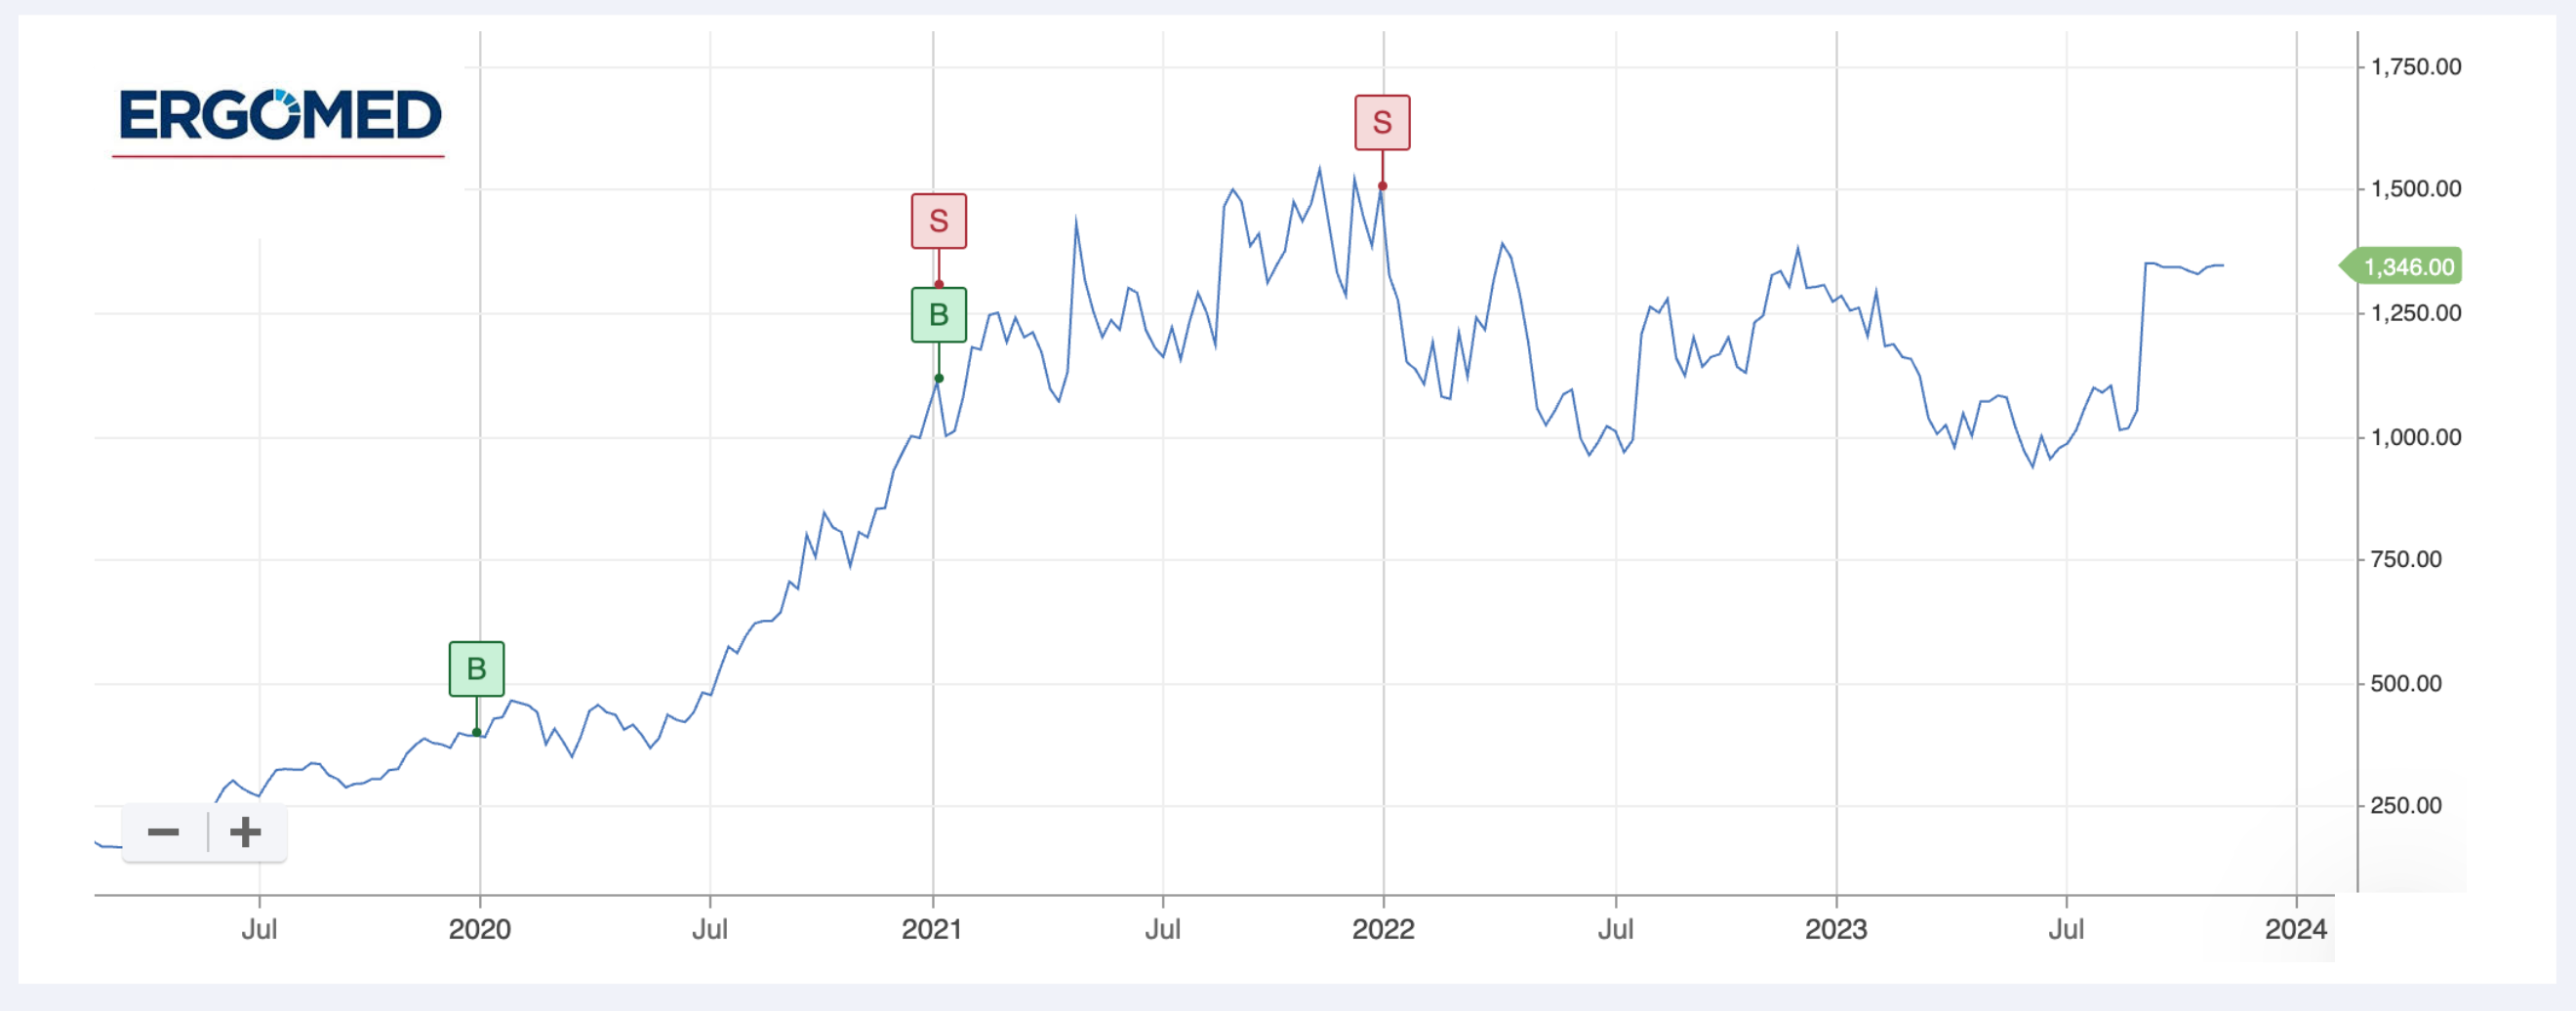
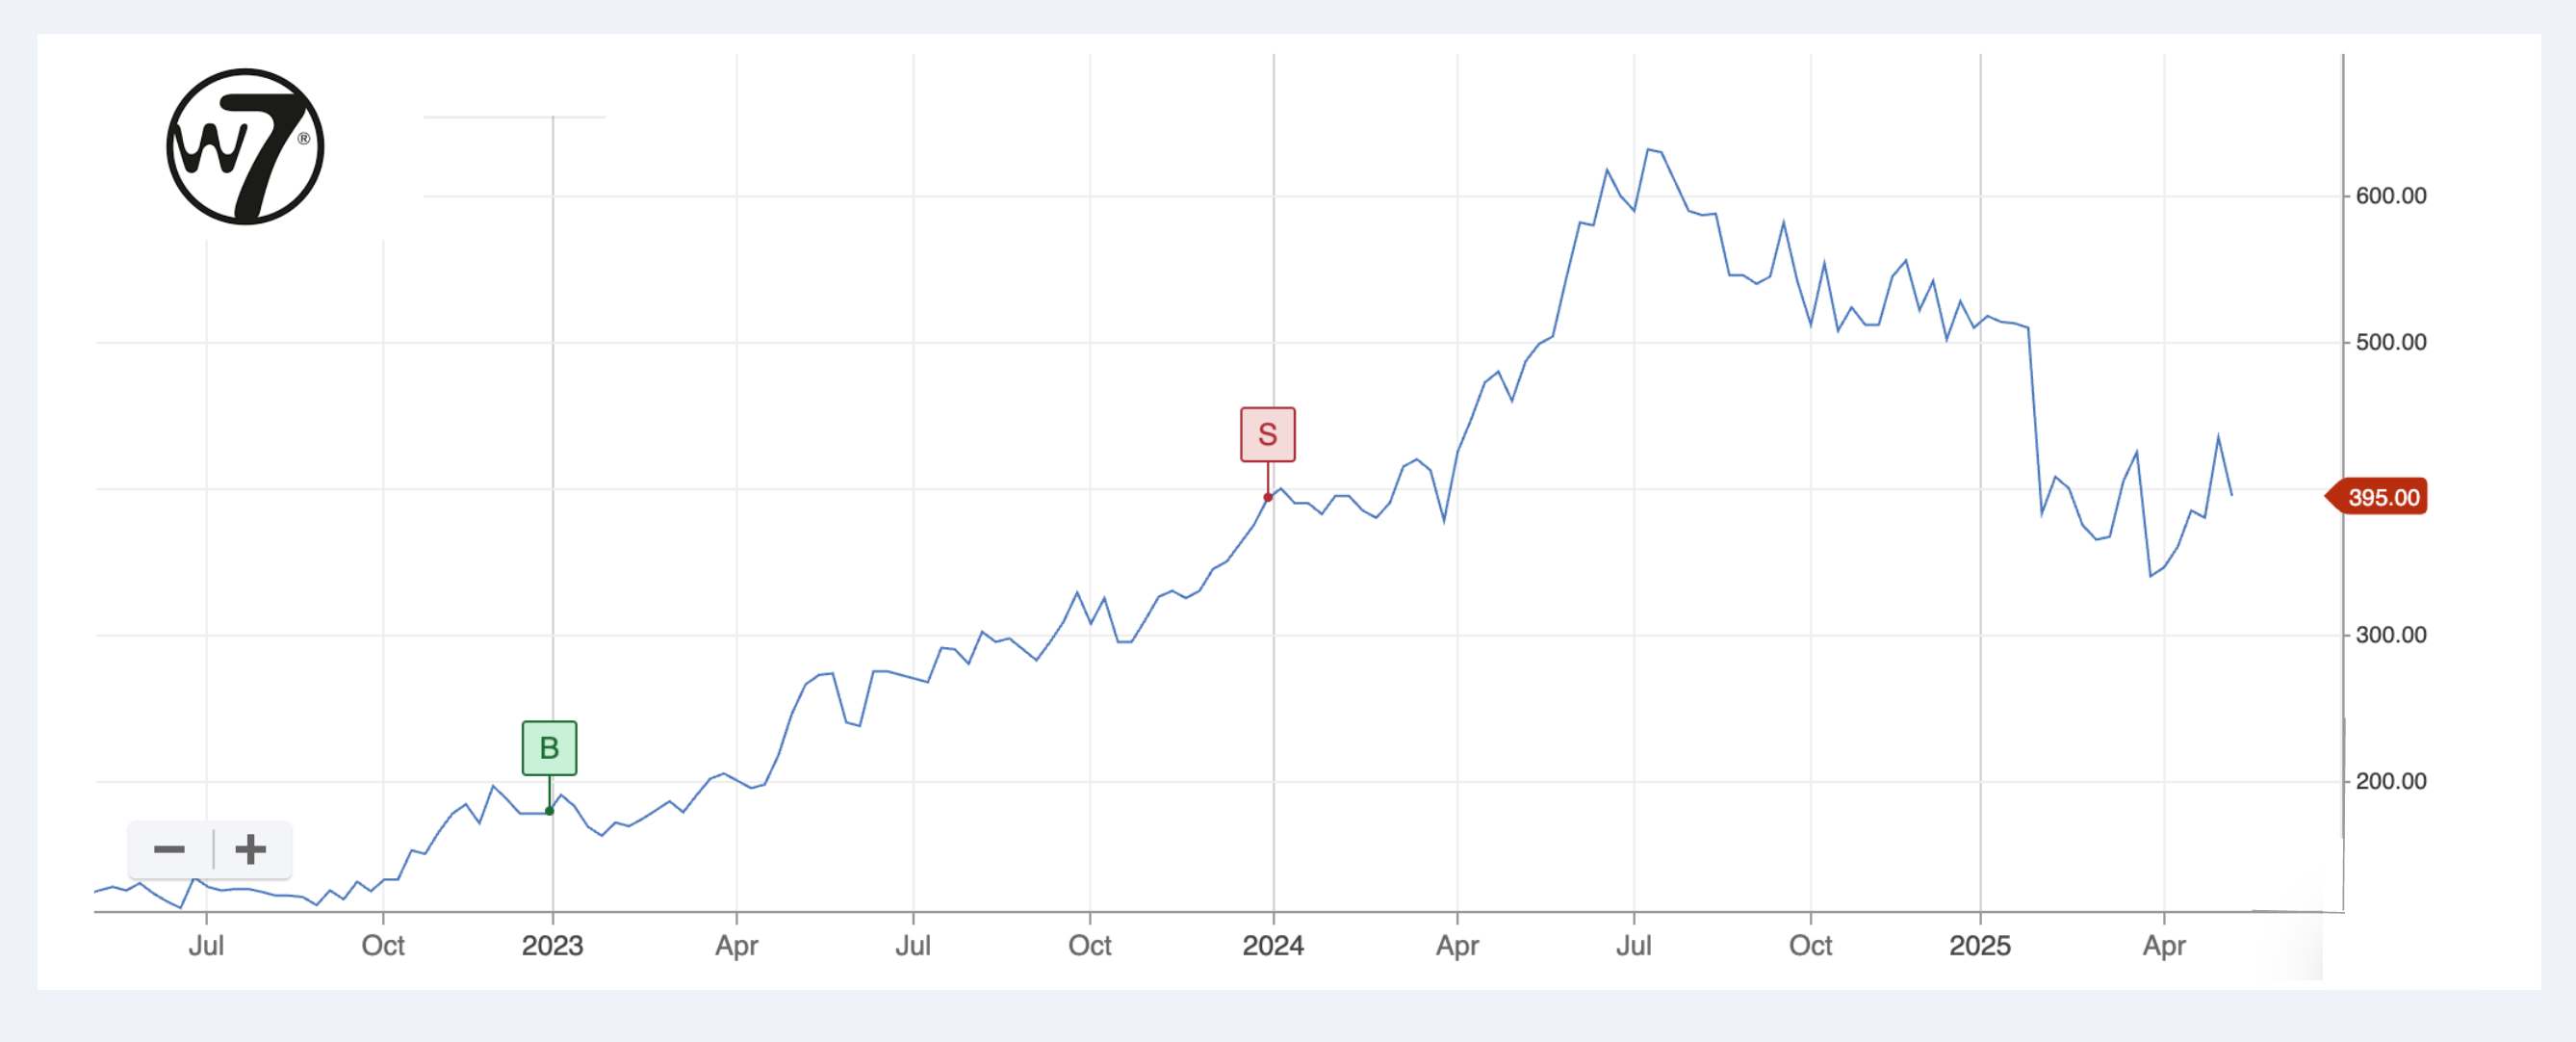
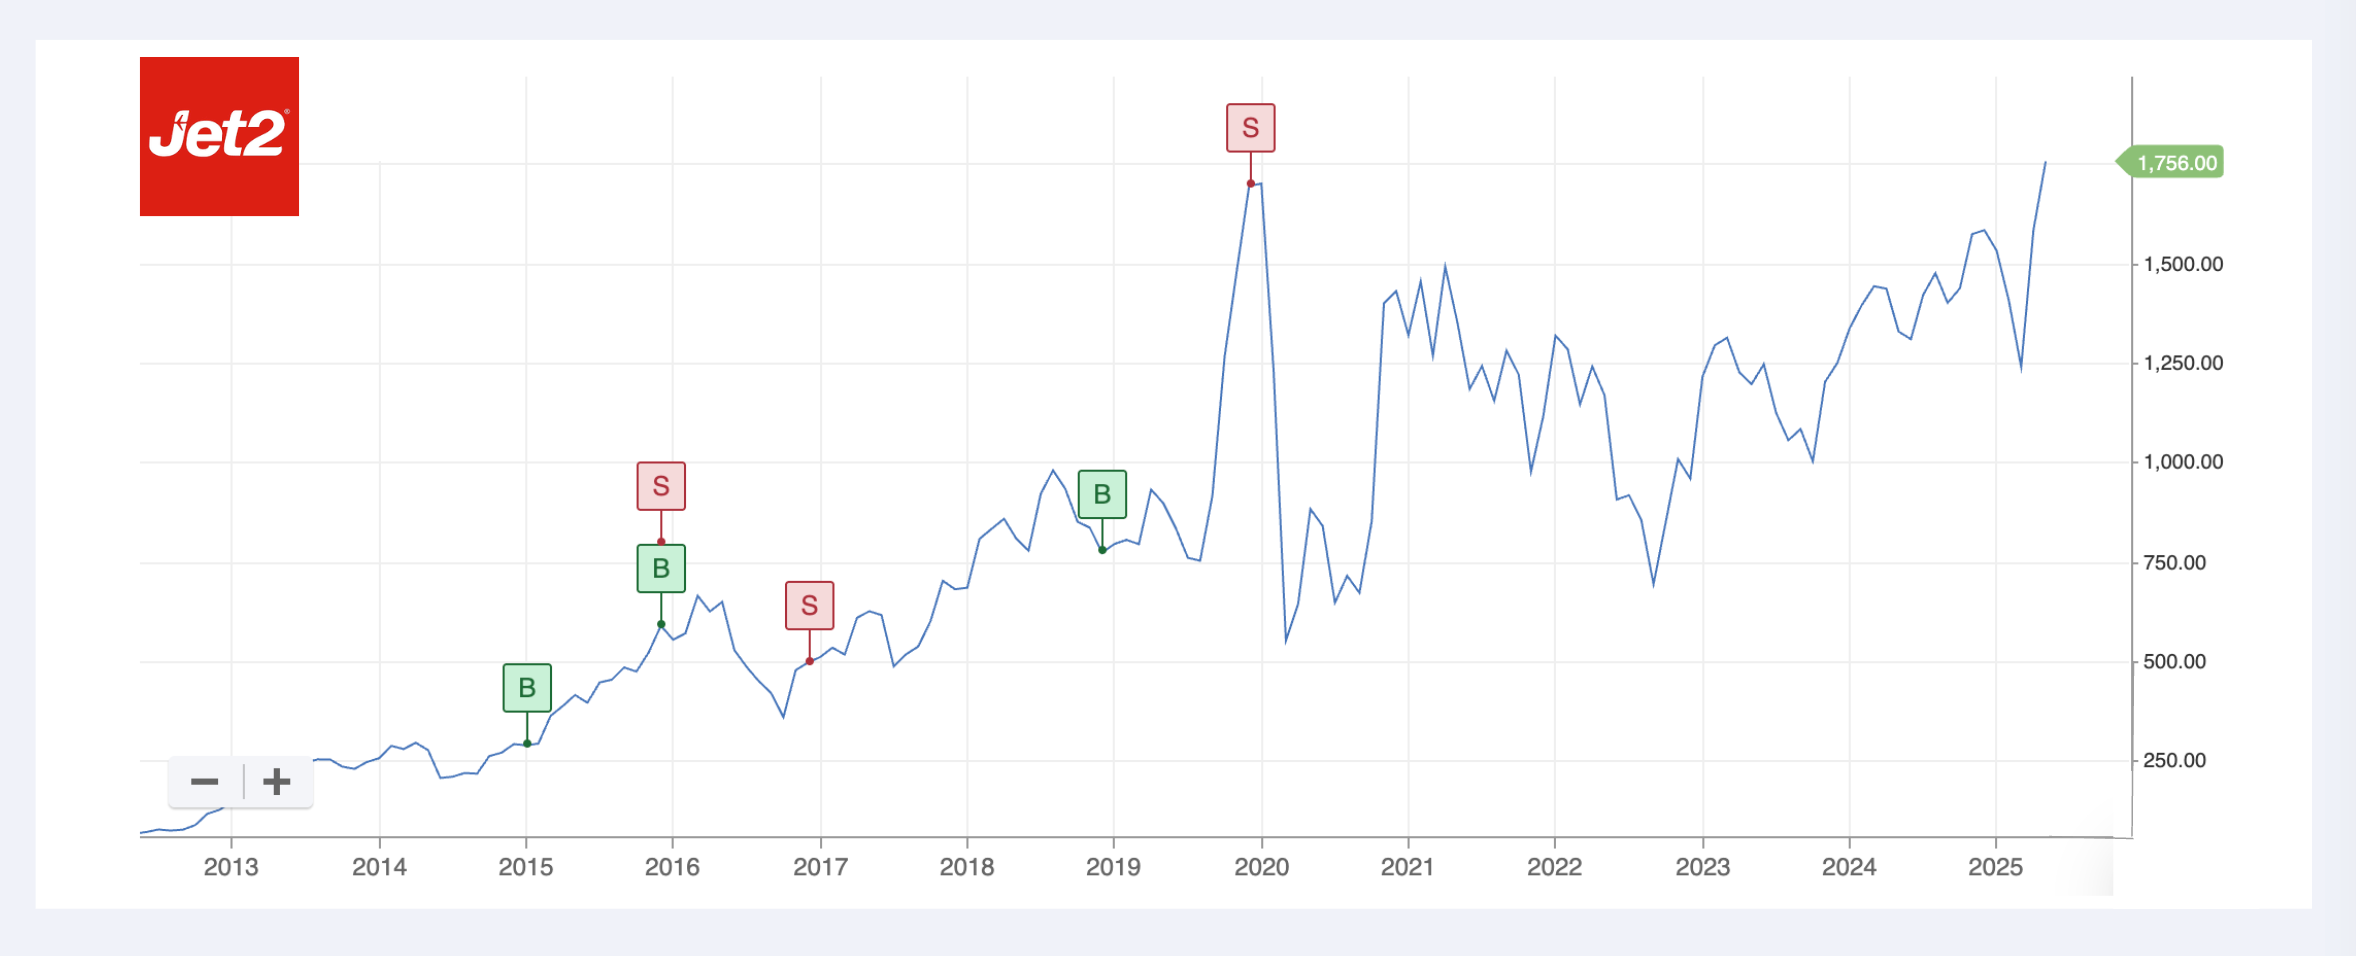
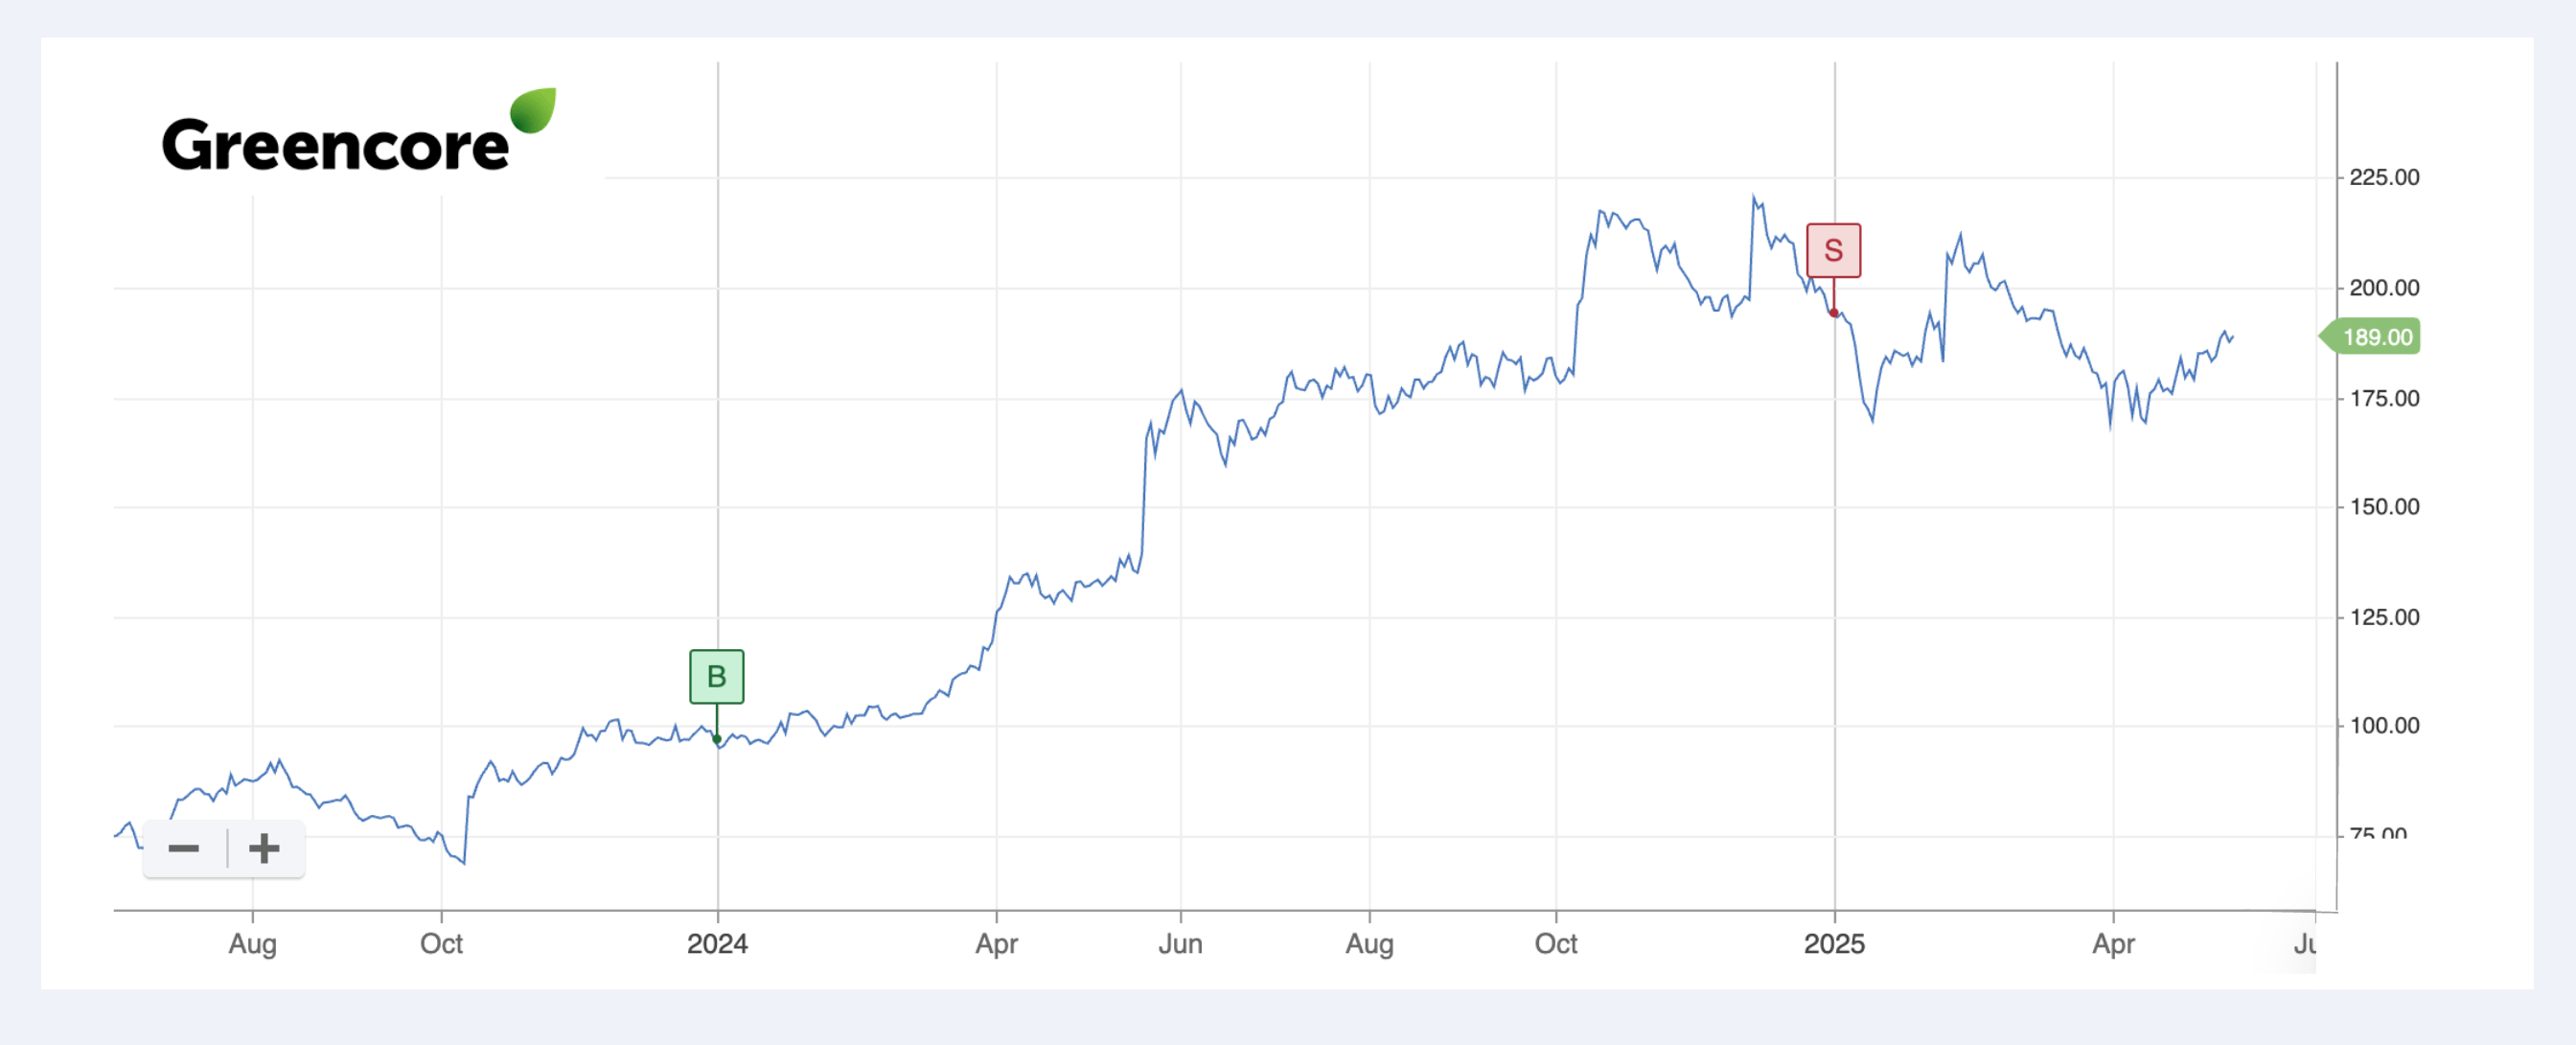
Four of the top ten winners in the NAPS were sold at opportune moments. The share prices really did nothing since being sold. If you’d continued to hold, you’d have had a significant opportunity cost. Jet2 was exited at the peak more than five years ago. It’s a long time to wait for a new high.
Ergomed
168% gain, and 42% gain. (10% drop since sale)
Warpaint London
111% gain. (5% gain since sale)
Jet 2
102% gain, then 16% loss, then a 119% gain. (3.6% gain since last sale).
Greencore
100% gain. (-2.4% loss since sale)
And the two that got away
And there are only two of these top winners that continued to rise in any significant fashion.
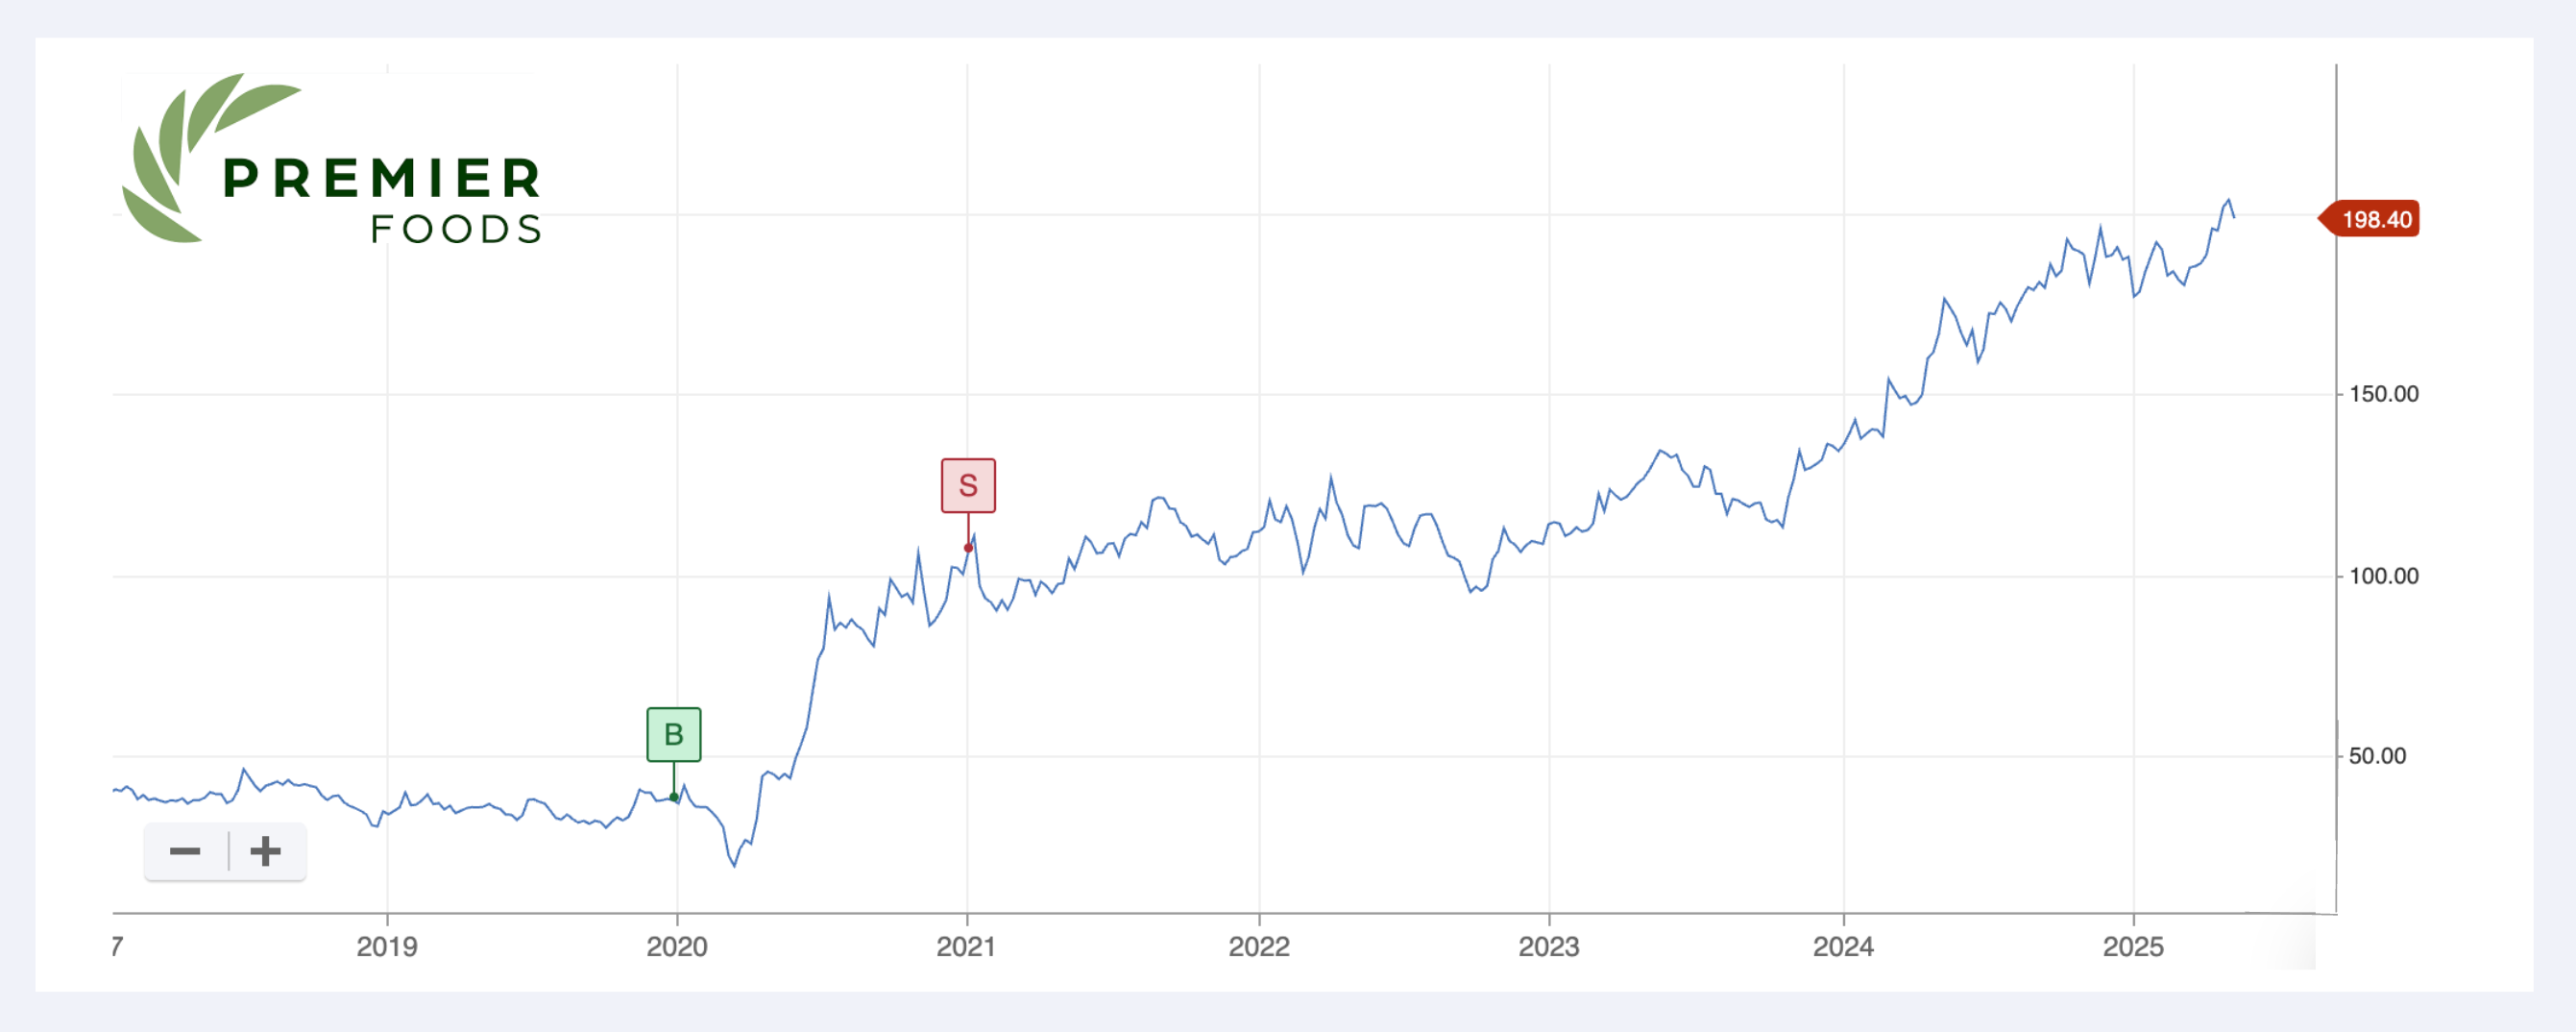
Premier Foods has doubled since, over about 4.5 years at about a 17% annualised rate. That’s better than the compounded rate of the NAPS portfolio, but not significantly so.
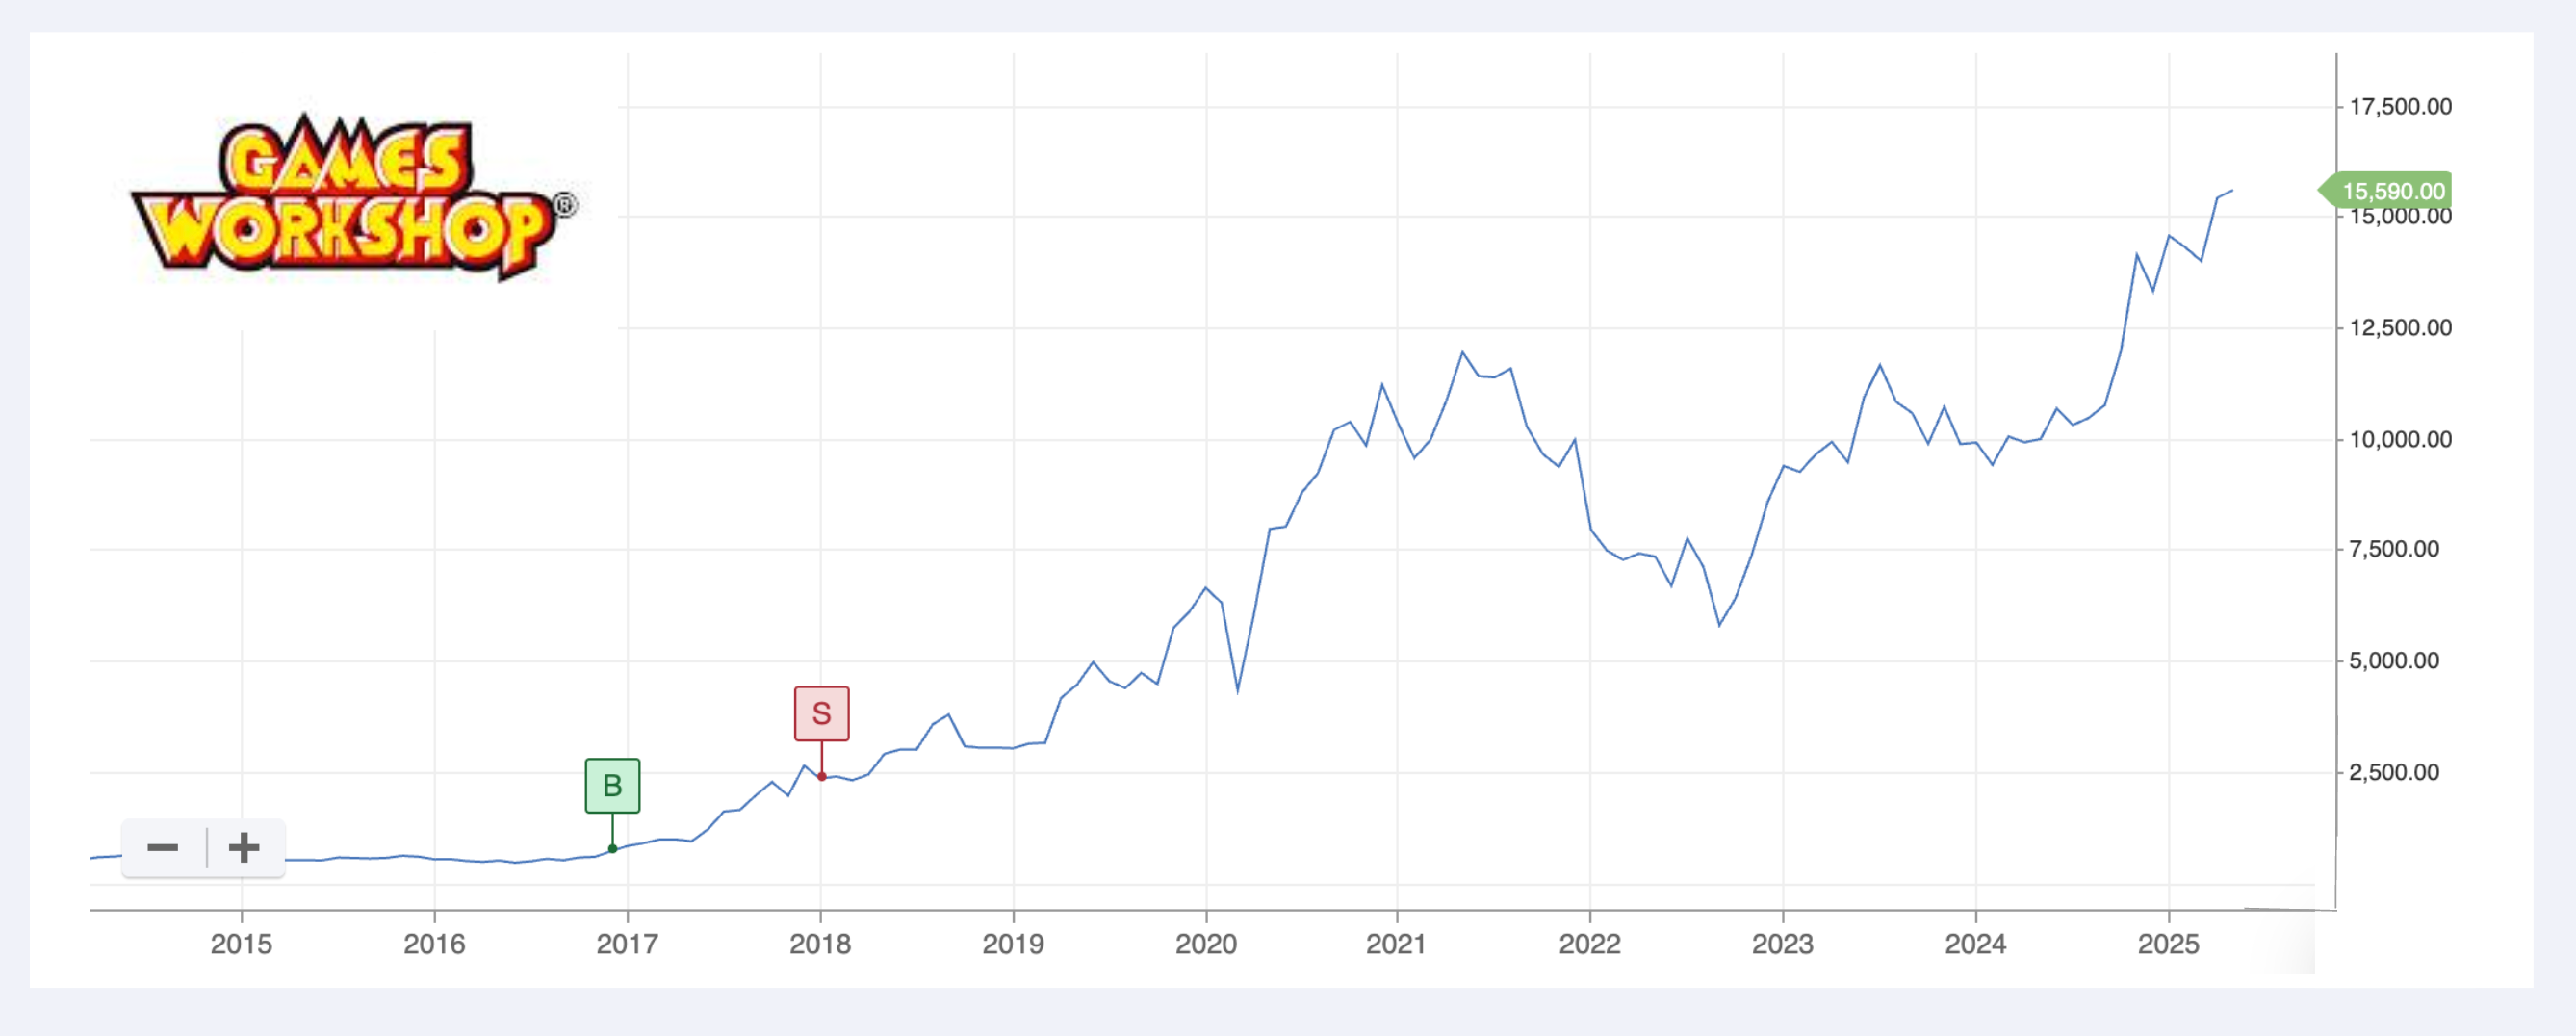
Games Workshop though is the regretful sale. After a 269% gain, it’s almost up another 500% since.
Games Workshop
269% gain. (492% gain since!)
Premier Foods
165% gain. (98% gain since sale)
Taking stock
So let’s take a tally.
Of the top ten biggest NAPS winners - if you’d “bought and held” those names… you’d have ended up with:
- 4 huge losers.
- 4 sideways drifters.
- 2 excellent gainers.
If we equal weight the gains since, the average across these ten names is about 23%, over an average 4-year period. That’s only a 5% annualised return. But without Games Workshop - there would have been a loss.
This is why a buy and hold strategy can end up with a market average return - or worse.
So the key lesson is this - if you are trying to build wealth in UK stock markets - which is a very value oriented market… it pays to have an exit strategy!
I'll leave you with this quote from Honey Badger's wonderful 5 year review of his own NAPS experiment:
"The 12-month horizon is about right. Many of those flying shares do ultimately slow down/stumble/crash as the years pass by.... a system, a set of rules, boundaries and guardrails is massively helpful for me."
Disclaimer
This is not financial advice. Our content is intended to be used and must be used for information and education purposes only. Please read our disclaimer and terms and conditions to understand our obligations.
32 comments
According to my quick calculations based on the companies in the graphs, the "Buy and Hold" strategy would have generated significantly more profit than selling at the time indicated by the NAPS Portfolio method. Of course, there would also be no capital gains tax to pay with Buy and Hold (at least not yet). However, I think statistical analysis would show that the sample size might be too small to allow any definitive conclusion, with outliers in both directions having a big impact on the results. When I have time I will work out the exact figures.
Fantastic article, and helpful to my own tendency to hold too long. Well, some stocks anyway; I managed to buy Judges Scientific (LON:JDG) at £6 an watch it rise to £24, then sold at £13, only to watch it rise again to £100! Beautifully run company but I was worried about its ability to maintain momentum of acquisitions.
There are rather more that I have held way too long!
And they there is Warpaint London (LON:W7L) which may still have plenty of growth potential if it gets seriously into Walmart.
An interesting article, I always understood that a NAPs portfolio was a portfolio constructed with the objective of regular rebalancing. The idea of NAPS was never a buy and hold strategy so its perhaps not that surprising that it performs poorly as such. Or put another way, if you want to construct a buy and hold portfolio, then you would not buy a NAPs selection of stocks.
It would be interesting to compare NAPs portfolio with a more typical buy and hold portfolio which might have combination of fixed interest, Investment Trusts and solid dividend stocks in addition to some exposure to the US - possibly BRK.B
Two completely different investing styles at work here . Both should comfortably outperform 5% annualised if executed correctly with buy and hold probably a lot closer to active management than the article suggests.
The approach used by David Paul. If I buy 1000 shares at £10 a share which subsequently rises by 20% to £12 I would sell 500 units and retain 500 and place a stop loss at £11. is this correct? If you follow this approach surely the number of portfolio holdings would increase significantly.
Of course, there are many ways to look after your portfolio as the market dances with your P&L .
I quite like the approach David Paul used - that of selling 1/2 my holding when (say) 20% in profit and moving my stop to a level where I keep 50% of the profits. 4imprint (LON:FOUR) is a recent example. I bought in at £32.09 - then the company went ex-dividend (a hefty £3.17 special) and even so, is approx 10% up on my entry point. In order to manage my account, I sold 1/2 at £35.38. More cash for new opportunities is the hope.
This means my current holding in 4imprint (LON:FOUR) breaks even at £32.09 - £3.17 = £28.92.
Keeping 1/2 the profits would involve a stop 1/2 way between £35 and £29 (ish) = £32.00 which leaves room for a pull back, whilst keeping me in for the longer term.
Now, if you had done that with Games Workshop (LON:GAW) - it would still be in what might be called a NAPS 'long runners' portfolio (shares that did well and are still running at 1/2 size). Other selections would have triggered stops - but as these have generated >100% profit, keeping 50% is still very good account management.
The key as David Paul used to say is 'No Big Losers' and, as you mention in the excellent article - run your winners. Making sure you keep 1/2 along the way.
Best Trading to everyone.
Strictly speaking this is not David Paul`s approach. David Paul`s Trading approach was to buy a stock and then take half profits when the stock has made as much as you`ve risked ie if a stock is at 100p and your stop loss is 90p, you would take half the profits at 110p. The stop loss would then be moved to break even and he would then move the stop up on a trailing basis based on the Vector Vest stop price which was a set distance below the 65 day moving average. Keeping half the profits was an American Vector Vest idea which is an alternative way of managing the stocks, but they didnt sell half their holdings when they made 20%. The David Paul Trading approach was mainly used to spreadbet US stocks- they were on margin, so they needed to be managed with caution. David Paul did not manage worry free shares like this, which are more similar to the NAPS approach. Here he just used the Vector Vest stop loss. The approach you describe is a reasonable one for reducing risk, but it isnt the David Paul approach.
Excellent article as always. Have you considered setting up a quarterly Naps portfolio on a rolling 12 months basis ? 2 potential benefits, you may find the performance is better if you started your portfolio on the 1st April or 1st October each year instead of the 1st January or 1st July ( Appreciate it will have to be the 1st trading date possible). Individuals may find the beginning of the year a difficult time to execute this trading model.
I used to do a NAPs every month. No clear evidence that other months are better than January. It varies every year and depends on the market. January you have some benefit of the Santa rally, at the start. This year had a good start.
I suggest that a start on 1st October is best because this is the start of the best half of the year based on stock market seasonlity going back many decades.
Was that not the month of 2 of the biggest stock market crashes, in the last 100 years? Maybe November would be better? Anyway you will still get these months, if it is held for 12 months, so does it really matter?
This article itself probably worth the subscription .
You just have to love the honesty here - one thing I really like about Stockopedia. This felt as though we were building through the article to a recap of the sensible reasons to sell and what to look out for - I guess that's in the other article I've just seen has been posted. Sell rules are much less clear to me than buy rules. I would love a NAPS discussion on best NAPS sell strategy.
I think reading through the NAPS (extensive) posts that the purist NAPS philosophy is to select your 20 shares, and one year on imagine you owned nothing and select 20 shares the same way you did last year. Now get to a point that you own those twenty by selling anything you bought last year that isn't in this year's basket. That means some quite high ranked stocks being sold to make way for even better ranked stocks. I'm assuming that is how you would get the performance of >300% compound return on the basic description of stock ranks in learn.
However, elsewhere there are discussions on when to sell that site academic research referring to selling at a rank of around 75 was it? This is not StockRank as on this site, but something very similar. This would mean that at the end of year 1 you'd put your portfolio in rank order and chop off the sub 75 stockrank shares.
Of course there is a lot more detail scattered over the site in podcasts, discussion about equal weighting, about watching for the change in stockrank rather than the absolute numbers as a leading indicator. I'd be truly grateful for the views of experienced investors, or Ed himself. Could we have a summary of the many selling strategies with pros and cons? Could we have a clear restatement of the NAPS selling rule? Could we discuss how that ought to be refined in 2025 to optimise returns?
I've used various methods for my own modestly performing NAPSesque portfolio. Last year I did a complete cull of everything and rebought (well, OK, culled everything not in a "if I was starting from here" portfolio) and of course paid my stamp duty for the privilege. It seems OK. Was I right to do that?
Thank you anyone who had the patience to read this and the wisdom to know how to reply.
There's a good webinar on the "when to sell" topic here - that I recommend ! https://www.stockopedia.com/ac.... and you can download the slides from the same page.
I recollect watching this through when first posted, and indeed it was very helpful. I have just rewatched your (very brief) NAPS labelled bit in which you imply that you do indeed sell the whole portfolio with the exception of the stocks that you'd have bought for the new one. The issue I have is the very large amount of other information - sell on profit warning, sell when momentum goes down (today's post on high-flyers), importance of rebalancing the size of individual holdings, don't sell or even look at your shares for a year, nope, resize every 6 months half the portfolio (but how do you decide which half?) - sell at a value of 70 or 74 or 75 in the QVM rank - so do you do that as the year goes by or run stocks dropping fast in rank? Surely not. You should trust QM or VM more than QV, the importance of attempting to time the market, don't try to time the market.
This most definitely isn't a criticism. Indeed the quantity and quality of the editorial here is wonderful, it is just quite a lot to synthesise, rank, sift and choose the policy that works for me. I think (because trying to be a story investor most certainly didn't work) that rules are where it is at for me. I'm not Megan Boxall, unfortunately, and don't think I'd pick well looking for high quality undervalued stocks.
Contrary to any impression I'm giving, I'm very happy with where I am compared to where I was with a "financial advisor" taking a cut for paying others my money to pick stocks he should have picked, and choosing ETFs and other investment vessels that evened out risk to the point of beige boredom - and still conspiring to lose me money. I'm beating inflation and having fun, even if I do glance at the portfolio value far too often.
Great article Ed. Contrary to the value/buffet buy and hold for ever strategies which look so great in hindsight. I like the charts with the 'B' and 'S' tags for buy sell. Is this a feature or did you add manually? FYI when I sell a share ; I immediately add it to a 'Sold' folio (with the price/quantity) and keep track of whether they continued to rise or fall. I'm pleased to say I have a 63% hit rate of selling at the right time. But an automated 'B' "S' on a chart would be a great visual.... Add it to the no doubt long wish list of features!
It's a feature in the charts package-click the Events button in the top bar-and you can add a variety of flags to your chart.
Excellent feature that I wasn't aware of. Bought some Elixirr today with the B flag on the chart showing the price and number of shares.
Hi Fire Juggler,
I have been doing much the same analysis on my sales since start of 2020. My hit rate is 50/50 as to whether they rise or fall post sale. Biggest error in cash terms was selling Pan African Resources (LON:PAF) at 9.6p in April 2020 after holding for nearly 15 years. Buy price was 10p in 2006 though did top slice at 19p in 2013. Of course the price now is 43.88p so should have held for the 20 years but as someone else said it is very difficult to continue to hold when a share takes a plunge during your holding period.
Hah! If it makes you feel better - I bought a load of Ethereum crypto at $7 (for a project - not as speculation. Think of needing 'laundrette tokens' to run like a blockchain laundrette. We were building laundrettes so needed tokens.... Anyway we sold half at $100 , all out at $200. Of course then it went on to $4500. TBH I think it's actually worth about $7... !!
Thanks Ed for another of your extremely well-written articles. They just keep coming (I’m glad to say).
I recently got back into equity investing when I became spooked by 10% inflation and, since I got back, I’ve found myself buying and selling more often than I expected. I like nothing better than to find a share I like and then topping up when it’s “low” and later selling a few when it’s “high”. (International Personal Finance (LON:IPF) is an example of one that currently fits the bill for me.) At the end of last year, I took stock and found that the shares I had sold were, on average, 11% up and the shares I was holding were 12% up. However, my return for the year (including dividends) was 27%. For a few seconds, I was puzzled and wondered how that could be. Then it dawned on me. The answer was “turnover”. It won’t happen every year but if you could make 10% every four months you’d end up with >30% for the year. You don’t have to multibag by finding the perfect share and holding it through thick and thin.
It sounds as though you thoroughly enjoy the stockpicking and selling and have the time for it. Many of us just do have the time and probably not the trader mentality.
I meant “don’t “ have the time.
Quite right! I buy and/or sell something almost every day but I realise that some people have a life to lead!
I wonder what would happen to the NAPS portfolio if instead of equal weighting, there was a small gradient of weighting of stocks based on the average stockrank (or maybe momentum rank) within each sector? Thus catching the rise of 'in-favour' sectors more.
This is the trouble with the UK market.
Even Games Workshop (LON:GAW) had a big fall a few years ago. You could easily have mistimed that and suffered a large loss.
Yu (LON:YU.) was a big winner but now struggling to make any gains.
Really useful article, and certainly correlates with my own behaviours and performance of stocks 'I like' rather than being very rigid around my own rules.
Did the stockranks give any advance indication if subsequent behaviour?
I'd have to review the specifics - but what I do know is that these stocks no longer qualified for the portfolio rules at the review date - which implies at least that the ranks had fallen.
Given the work we've done on "ahead of expectations" announcements - I'm also v. interested to see whether earnings surprises had run out in some of these shares.
A share like Games Workshop just kept surprising on the upside. Holding onto shares that have positive trading statements and continued trading momentum is one way to hang onto those that the ability to run and run.
Ed, Games Workshop (LON:GAW) fell 50% in 21/22, so it was not all upside.
Summary below of the Stock ranks when they were sold:
Petro: No longer showing
Frontier: Stock Rank of c.60 when it was sold
IQE: SR c.42
IG Design: SR c.76
Ergomed: No longer showing
Warpaint: SR c.81
Jet 2: SR c.95
Greencore: SR c.93
Games Workshop: SR c.88
Premier Foods: SR c.99
In this case the stock ranks are a reasonably good indicator of the performance, with Frontier and IQE the fall in the stock ranks was a good indicator to bail out. Warpaint also had a good run through 2024 (above it was sold at the beginning of 24) with a stock rank of 81, the stock rank decreasing towards the end when performance started to dip. The high ranks on Games Workshop and Premier Food indicate they shouldnt have been sold.
Conversely Jet 2 was showing 95 and fell by 66% although there was covid in that period.
Greencore is the exception, having a high rank but poor performance in the next 12 months after the sale.
Petropavlovsk had dropped to 53.
And Ergomed 54
Thanks Ed.
So yes it does appear that the stock ranks are a good indicator. Personally as a "stock rank surfer" I use them to help me with both the buy and sell decisions. Although saying that I kept GAW through the fall and subsequent increase although that was more research/faith in the product and management.
And I forgot to add previously thanks for another good article