SIF Folio: +40% in three years - what should I change?

The SIF (Stock in Focus) fantasy fund reached its third birthday on 19 April 2019, so this week it’s time to take a closer look at the fund’s performance over the last year.
I’ll also reveal the changes I’m going to make to my screen for the year ahead. As always, any modifications will be evolutionary, not revolutionary. As I invest my own money in these stocks too, I’m not inclined to make too many speculative changes.
I started this review process last week, with a look at the portfolio’s biggest losses of the last three years. This generated some very interesting and thoughtful discussion in the comment thread. If you haven’t seen it yet, it’s well worth a look.
Performance: Flat in a tough year
My benchmark, the FTSE All-Share Index, fell by 11.5% during the second half of 2018. The SIF fund fell by 11.9%, broadly matching the wider market decline.
Happily, the strong rebound we’ve seen since the start of 2019 means that the fund has recovered much of this lost ground. But I have to admit that my run of market-beating performance has now come to an end. SIF gained 0.8% last year, compared to 1% for the All-Share:
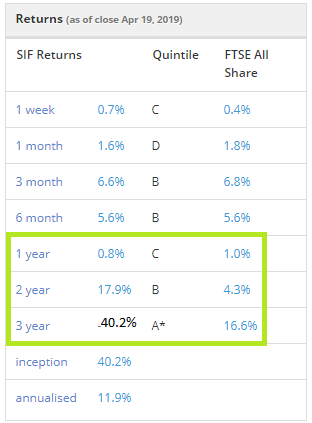
Happily, the fund has retained the gains made in previous years. On 19 April 2018, the fund’s gain since inception was 40.3%. One year later, it’s 40.2%. This means the fund has basically flatlined after costs, despite the relatively high level of trading required by this strategy.
A closet market tracker? One criticism made of many active funds is that they are effectively market trackers. SIF’s performance over the last one, three, six and 12 months indicates that I too have basically tracked the market over the last year. This can be seen more easily with a chart-based view:
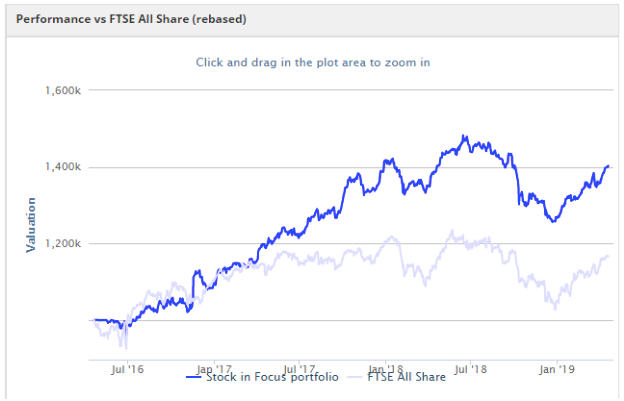
I’m not too concerned about the risk of SIF becoming a closet tracker fund. If we consider the makeup of the portfolio, it’s clear that there are significant differences to the wider market:
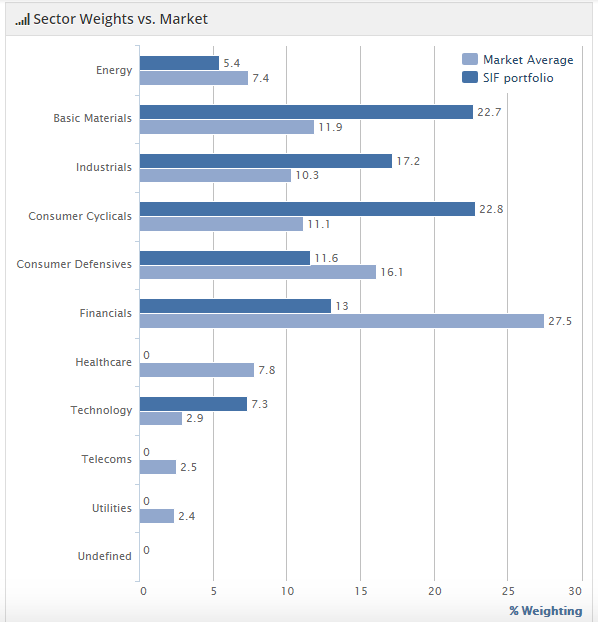
I think the chances of SIF becoming a closet market tracker are minimal, especially given the fund’s weighting towards small and mid cap stocks. For better or for worse, I’m confident my performance will diverge from the wider market again at some point in the future.
Before I move on to look at the changes I’m planning for the year ahead, I want to share a couple of other data sets that might of interest.
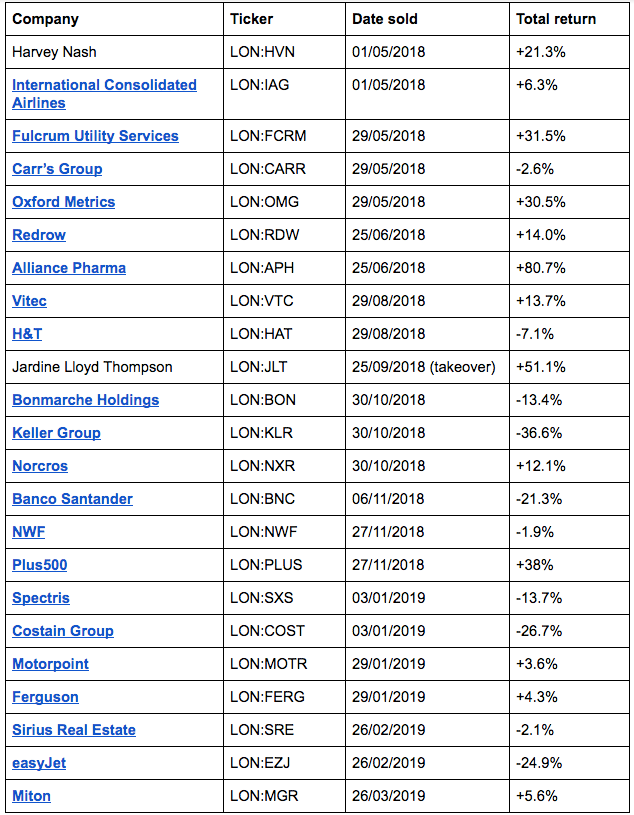
2018/19 stock-by-stock performance: First of all, here’s a snapshot of how all the stocks sold from the portfolio last year performed. These numbers are from my own records and include dividends and costs (the Fantasy Fund system doesn’t include dividend data). Highlights include an 80% gain from Alliance Pharma and a bid for Jardine Lloyd Thompson that delivered a 51% profit:
Finally… what if I didn’t sell? Timing the market is notoriously difficult. Am I really doing better than a buy-and-hold investor?
There are many ways you might model this, but what I’ve done this year is to put all the SIF stocks that have been sold since the portfolio’s inception into a Google spreadsheet. I’ve then compared my selling price with the current live price.
I have to admit to a sigh of relief here - I have dodged some bullets. At the time of writing (22 April 2019) my picks showed an average price gain of 12.2% versus a 6.3% return if each position had been left open.

The buy-and-hold result will continue to change as it’s supplied live from Google Finance. You can see the spreadsheet for yourself here. It’s a bit crude - I hope to make some improvements, time permitting.
Changes: refining risk management
I’m not going to make any changes to the core structure of the SIF screen for this year. Performance over the three years it’s been in use has been satisfactory, in my view. I don’t believe that the fund’s performance to date has highlighted any major weaknesses.
As we continue to move through the market cycle, I hope to learn more about what works and what doesn’t. In the meantime, I’m going to make some tweaks to my rules to try and improve risk management and avoid big losses.
Minimum P/E ratio: My existing screening rules specify a minimum rolling forecast P/E ratio of 5 and a maximum forecast P/E of 30. My aim with this rule is to exclude stocks with extremely high or low valuations.
However, subscriber Nick Ray made an excellent comment on my piece last week (here). Nick pointed out that my P/E range ruled out a greater percentage of expensive stocks than cheap ones. On reflection, I think a P/E of 5 is probably too low for a ‘normal’ valuation.
I’m going to increase my minimum rolling forecast P/E to 7.
Profit warnings: There was a lot of discussion about stop losses and selling on profit warnings in the comments on my piece last week. I’ve made my decision.
Although the SIF portfolio’s minimum holding period of nine months means that it’s a fairly short-term strategy, stocks aren’t traded based on price action alone. For me, that would be the only scenario where the arbitrary nature of a stop-loss made sense to me. So I won’t be adding stop-losses to the portfolio.
However, I have decided to add a new rule: I will sell stocks following a profit warning.
This presents some administrative complications.
I have a policy of not front-running my SIF fund trades (which I make with my own cash too). So I don’t make any trades until the article detailing the trade has been published. To maintain this policy, when a profit warning happens I will flag it up in my next article. I will sell the stock after the article has been published.
Interesting times ahead?
The outlook for the year ahead seems as uncertain as ever, but I hope to be able to continue coming up with new stocks and watching this strategy evolve.
One of the highlights of running the SIF fund over the last three years has been the quality of contributions from the Stockopedia community. So thank you for your support for this project. As always, any comments or views on my decisions will be very gratefully received!
Disclosure: Roland owns shares of Carr’s Group.
Disclaimer
This is not financial advice. Our content is intended to be used and must be used for information and education purposes only. Please read our disclaimer and terms and conditions to understand our obligations.

15 comments
Hi Roland,
I really appreciate the transparency in your writing about the SIF portfolio - I have a question about performance measurement: Are all your returns net of cost and taxes(capital gains, stamp duties or others, etc)? At what point net of these costs would you consider becoming/moving money to a market tracker, low cost, low tax, ETF?
I'm simply asking because I want to put a certain chunk of my personal money into ETFs over the next 2 years, (my current benchmark is 20%), put 20% into income generating bonds that mature between 5-7 years in solid companies generating 3.5-5% per annum(beating inflation and securing capital), and the rest into growth and value stocks....but I'm debating how much I need to beat the ETFs/market indices by to make it a worthwhile effort.
Hi SMinvest,
The returns shown on the SIF Fantasy Fund page (https://www.stockopedia.com/fantasy-funds/stock-in-focus-portfolio-6449/) are net of notional dealing costs but don't include dividends.
The "total return" figures I use, such as the list of stocks in this article, are net of costs and include dividends.
For the purposes of these pieces, I ignore capital gains/income tax as everyone's circumstances are different.
At what point would I give up stock picking and put money into a tracker fund? I can't offer any advice on this. But speaking personally, I suppose there are two circumstances.
The first would be if my stock picking efforts were continually going badly wrong and I couldn't understand why.
The second might be if my life circumstances changed and I couldn't/didn't want to take the time needed to invest actively anymore.
As I say, this is only my personal opinion, not advice - everyone's circumstances are different.
Good luck with your plans.
Regards,
Roland
Interesting topic does anyone know if there's any index reinvested divi etf's one can purchase ?
Hi clarea,
Most index tracker funds and ETFs offer two types of units, allowing you to choose whether to have dividends paid out to you or automatically reinvested.
If you want dividends reinvested, then choose Acc or Accumulation units.
If you'd like to receive the cash income, choose "Dist" or "Inc" units (Distribution/Income).
Hope this helps - please remember this is only a general guide. Please DYOR and check the specifics of any fund you're considering buying to understand how dividends are handled.
Regards,
Roland
Thanks Roland keep up the excellent work really value your reports
Hi Roland.
On the 3yr return you have ftse allshare up 16%,im'e looking at FTAL which is up around 40% in that time period.
Hi coniston,
Thanks for your comment. I think you've inadvertently highlighted the power of dividend reinvestment!
From what I understand, SPDR FTSE UK ALL SHARE ETF (LON:FTAL) is a FTSE All-Share tracker ETF. However, the FTAL ticker seems to be for accumulation units - i.e. with dividends reinvested.
https://uk.spdrs.com/en/professional/etf/spdr-ftse-uk-all-share-ucits-etf-acc-SPYF-GY
The 16% gain reported by Stockopedia's data provider is for the index only, without dividends.
This is a great example of the power of compound interest/dividend reinvestment -- a c.40% gain vs. a 16% return without dividend reinvestment.
SIF is up by 40% excluding dividends, as the Stocko Fantasy Fund doesn't record dividend payments.
Cheers,
Roland
Well spotted Roland,explains the difference from ASX,you could probably add another 20% to the Sif portfolio over 3yrs with divis reinvested.
To cut down on admin time, I only record the dividends for SIF stocks when they're sold, so that I can calculate total return.
This means that my current records don't include dividends for any of the stocks still in the portfolio. Even so, my figures suggest that dividends have added about 10% to SIF returns so far.
Unlike with the tracker fund, these dividends aren't reinvested. This is why this figure is so much lower than for the tracker fund, where dividends have been used to buy fund units that have subsequently risen in value.
I'm not getting the benefit of compounding. But the extra is still worth having - I'm a big fan of dividends!
Cheers,
Roland
Roland and coniston,
Thank you this is an interesting discussion. As you both say the returns of indices with dividends reinvested are much higher. When comparing my own performance, dividend reinvested indices are the most relevant.
I am unclear if any of the "major indices" in the Stockopedia directory include dividend reinvestment. Does anyone know? If not, what is the best way to find the comparable dividend reinvested indices?
Armorduck,
Stock indices are normally listed based on capital return only, excluding dividends. I'm pretty certain this is how Stockopedia lists index prices.
However, official FTSE Total Return indices, which include dividends, do exist. The only place I've found that has reliable information on these is the official FTSE website:
https://www.ftse.com/products/indices/uk
If you scroll down to the main table, you can choose between "Capital" and "Total Return" using the tabs on the right.
Hope this helps,
Roland
Thanks Roland. It helps a lot. Much appreciated.
wow.. is there something with IT consultants and stock investing. That makes the 3 of us, but I guess thats where the similarity ends :)
I think you need to develop more prejudices against certain sectors. See my comments on your previous article on the SIF portfolio here: https://roliscon.blog/2019/04/23/construction-companies-fixed-price-contracts-and-galliford-try/
Roger,
Thank you for your comment. I've also worked in IT and share your experience that large, complex projects will normally cost more than expected. I certainly agree that there's a lot of downside risk on low-margin, fixed-price construction contracts. So perhaps I should rule out this sector entirely.
However, the SIF fund has also enjoyed healthy gains from construction sector companies in the past. For example Somero Enterprises Inc (LON:SOM) (+49% in 2016), Morgan Sindall (LON:MGNS) (+58% in 2017) and Fulcrum Utility Services (LON:FCRM) (+31% in 2018). So the picture is mixed.
I would be unlikely to buy construction stocks for a long-term portfolio. But for the SIF approach I'm still willing to consider them, albeit with more care and scepticism than before.
Regards,
Roland