SIF Folio: A new strategy for selling shares (part 2 - the rules)

My SIF screen is not providing any new stocks for me to consider buying at the moment. Historically, this has sometimes been an indicator that the market looks fully priced on a short-term view. I’m not sure if that applies in the unusual circumstances we’re living through today, but in any case there’s nothing to buy.
With no new shares to consider and a month-end review due next week, this week seems like the right time to continue the development of my new selling rules. Last week’s piece generated plenty of high-quality discussion in the comments - thank you for sharing so generously. I look forward to seeing what you make of my solution this week.
I won’t deny that I’m a little nervous at making these changes. At the time of writing, the SIF folio is up by about 30% since inception (April 2016), excluding dividends. The FTSE All Share index is up by less than 5% over the same period. I’ve got plenty to lose if I get it wrong.
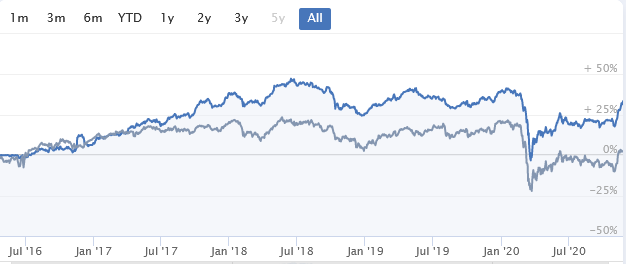
SIF Folio (blue) vs FTSE All Share (grey)
However, there’s always room for improvement - at least I hope so. So as promised last week, I have devised a new set of rules for selecting which stocks I should sell. My aim is to allow successful picks to run until they show signs of deteriorating performance.
That’s not easy to quantify. But in broad terms I’m using the same metrics as in my buying screen, but with different values. I’ve also made a few additions.
The new selling rules
I don’t want to repeat last week’s article here, so I’ll refer subscribers back to that piece for a more detailed overview of the thinking behind this change.
My new selling screen includes rules covering all three of the main factors - Quality, Value and Momentum. I’ve listed each rule below, along with a brief comment on the thinking behind each choice.
For the sake of clarity, this screen is intended to highlight shares I can continue to hold. In other words, if a share doesn’t show up in the results of this screen, I’ll have to sell it.
Rule | Comment |
StockRank Style excludes Momentum Trap and Sucker Stock | As I explained last week, I don’t use the StockRanks to select stocks for SIF. But I’ve never met a Momentum Trap (low QV, high M) or a Sucker Stock (low QVM) that I didn’t want to sell… More seriously, in my experience these two styles are a useful shorthand for stocks that carry more downside risk than upside potential. I don’t generally want to own them. You can read more about the StockRank Styles here. |
Piotroski F-Score >4 | I’m a big fan of this nine-point fundamental health check as a snapshot tool for monitoring a company’s financial health. It covers a range of important quality metrics in one score, but it also allows some flexibility. The F-Score is heavily-weighted in the QualityRank algorithm. I currently use the F-Score in my buy screen in place of more specific metrics such as operating margin or return on equity. I do this to allow more flexibility on how quality is measured, to accommodate different types of business. My buy screen requires a minimum F-Score of six (out of a possible nine). I’ve opted to reduce this to five in these selling rules to allow a measure of flexibility for companies in transition. But I’ll be watching closely in case this is too lax. |
Earnings yield >2% (TTM EBIT/EV) | Reducing the earnings yield threshold from 8% in my buying screen to 2% allows for companies that are priced for growth. Inverted, this ratio is equivalent to valuing a business (including debt) at 50 times operating profit. That sounds pretty steep, but if you look at the FTSE 350 you’ll see a surprising number of midcap growth businesses priced at this level. I think it’s acceptable for good quality, profitable growth stocks. |
Price to earnings ratio (rolling f/cast) < 35 | This is a forward-looking measure to complement the historic earnings yield rule. In today’s low-yield world, I think this is still a realistic upper limit for profitable growth businesses. Examples of companies trading on this kind of valuation currently include Experian, Rightmove and Croda. I wouldn’t buy these today, but I wouldn’t sell them if I held, either. |
Dividend yield (rolling 1y forecast) >0% | I’ve always insisted on dividend payments and I won’t change this. But when a stock re-rates to a higher valuation, the yield tends to fall, at least in the short term. I’m happy to accept this as long as dividend payouts continue and are not cut (see next item) |
Dividend per share growth (f/cast 1y) ≧ 0% | As above. |
Sales growth (rolling 1y) >0% | In my experience, falling revenue rarely leads directly to sustainable higher profits. |
Rolling PEG ratio (f/cast) < 1.8 | I’ve not included an explicit requirement for earnings per share growth in order to allow some flexibility on current-year performance. Instead, I’ve included the PEG ratio on a rolling 12-month forecast basis. My hope is that this will exclude companies where analysts are forecasting flat or declining earnings. |
FY1 EPS estimate upgrade (3m) ≧ 0 | This is a new and experimental addition. My hope is that it will work in partnership with the rolling PEG ratio to screen out stocks that have a worsening outlook for earnings. In itself, this rule should exclude stocks where broker earnings estimates for the current year have been cut in the last three months. |
No. of broker covering ≧ 1 | I want companies with at least a minimal level of broker coverage. The reasons for this are to aid liquidity and general investor awareness. I don’t want to end up holding obscure special situations or firms with a dominant shareholder and only a tiny free float. They may be good investments but they fall too far outside the mainstream of the market for the SIF strategy. |
Relative Strength 1y > 0 | This is one of my longest running momentum measures. It indicates whether a stock has outperformed the wider market over the last year. Adhering to this measure has caused some frustration over the years, but I think it helps me to avoid value traps and slow-moving turnaround situations. |
Price vs 50d moving average > -5% | The 50-day moving average is commonly used as a momentum indicator. If the share price is above the average, then it’s more likely to be in an upward trend. To allow some wiggle room for volatility, my rule specifies that the share price can fall no more than 5% below the 50-day moving average. |
Price vs 200d moving average >-5% | As above, on a 200-day timeframe. |
You can view the results of this Sell screen here.
What could go wrong?
One risk is that these new rules will have the result of making the portfolio too lax. I may end up keeping shares that could and should have been sold sooner, at higher prices.
Another risk, perhaps more serious, is that I’ve fallen victim to confirmation bias. In other words, I may have tailored these rules to justify my existing stock picks.
As I have no way to backtest these rules against a volume of stocks, the only thing I can do to test them is to apply them to companies that I’m familiar with. Inevitably, this includes many of the current holdings in the SIF folio.
Next steps...
I’ll give these new selling rules their first run out next week, in my usual month-end review.
Although I reserve the right to make manual adjustments, my plan at the moment is to use the new selling screen for a few months, probably until the portfolio’s next birthday in April. I’ll then review this new system. With such a big change, some iterative adjustments may be needed.
As always, I very much look forward to your comments on this new element of my SIF strategy. Constructive criticism is especially welcome!
Please DYOR: The SIF folio is an experimental portfolio that represents my ongoing efforts to beat the market with a rules-based strategy. My hope is that it will be informative and entertaining, perhaps even educational. But my decisions and the changes I make are never advice or recommendations. Please always do your own research before making any investment decisions.
Disclaimer
This is not financial advice. Our content is intended to be used and must be used for information and education purposes only. Please read our disclaimer and terms and conditions to understand our obligations.

17 comments
I really like reading Roland and I fully agree selling is much harder than buying. But I think this new approach will result in too many sales.
When I look back over 30 years investing I realise (with dismay) that actually if I had never sold anything I had bought, I would have done better than I have!! I’m sure this is true of many investors, though it is painful to admit!!
I’m happy to hang on to the stragglers and let the prime movers keep moving.
Great write up Roland.
I've also got a rules-based (with judgement) approach and have run into some of the challenges you've uncovered - especially battling with my rules for buying vs rules for selling, they definitely have to be different otherwise you end up with a yo-yo portfolio and enormous trading costs! (done that.)
I think due to the fact you have lots of sell thresholds a stock could 'fail' on, there is a risk of short term dips on a specific metric which in the scheme of things might not be a strong signal.
I wonder (at the risk of making this too complicated) if applying a time and multi-variate rule would combat this e.g. a stock would need to fail on 3 or more metrics, for a period of x weeks/months to trigger a sell.
Taking it a little further (sorry I love the maths) you could consider giving each 'hold' metric a weighting of 1-5 e.g. StockRank might be a 5, no of brokers might be a 1 and then you have an aggregate score cut-off for hold/sell.
Good luck!
Hi Matthew,
Thanks for your comment. Cutting my trading costs is indeed one of the secondary reasons for this change.
As you say, there is the potential for individual metrics to hover around a threshold level, causing stocks to yo-yo in and out of screens. I've seen this sometimes over the years, but I tend to allow some (judgement-based) tolerance for this in terms of trading.
I think it would be interesting to explore a score-based system - an approach like this might solve some problems, although devising a weighting/threshold system might be quite an involved process.
Thanks,
Roland
More generally I will be very interested to see how this pans out.
I do agree with Kelvin that there is likely to be a degree of overlap between some of the measures and they may well prove to be trailing measures.
For example for a stock that was originally selected for SIF to become a Momentum Trap or more particularly a Sucker Stock would probably involve a prior profit warning which would have resulted in the stock been sold already.
I do though think that these are interesting times for an approach like SIF - a lot of the measures that SIF relies (and perhaps particularly the F-Score) are going to wildly flap around like (erm) a wildly flapping thing as covid impacted results periods cycle in and eventually out of the measures.
This reminds me that after the recent SIF sell of Finsbury Food (LON:FIF) I very nearly wrote a cheeky article which would have been titled SIF-FIF-DIFferent conclusions because Roland's article prompted me to look at Finsbury for the first time in a while and I liked what I saw.
I think FIF was discarded from the SIF stable for failing four tests :
1. It was too cheap (warning sign of distress) on an a forward P/E basis.
2. It was too expensive on a historic earnings yield basis (this was the result of a goodwill write down in the latest results). A systems based approach cannot easily eliminate exceptionals as judgement is needed as to whether they are really exceptional)
3. The dividend had been suspended as a result of the pandemic.
4. The Relative Strength was less than zero.
This sparked my interest as I could easily dismiss the first three and as far as price momentum goes, in the current market there was a shorter term measure that I found more germane.
At the risk of sounding like I know what I am talking about regarding TA (I don't) : there was a trend reversal on volume, although I cautiously waited a few days later for what I took to be a breakout on reasonable volume.
In the vernacular, the market had stopped hating on FIF.
In defence of SIF, I should say that the whole point about a rules based method is not to get every decision right but to get a sufficient proportion correct and SIF's outperformance of the All-Share says that it does just that.
Out of interest I just had a look at how the new selling criteria would judge FIF now.
Finsbury would now fail two tests. Firstly on the dividend and secondly that the consensus forecast for the current year has been reduced in the last 3 months.
I dismiss the dividend point and in my view the "downgrade" is a false positive.
In many cases analysts forecasts were suspended back in March (essentially analysts just did not know how bad to make the numbers). Once they resume forecasting it looks as though they have reduced the forecast - in reality I am pretty sure that they are more optimistic now than they were three months ago.
So for me Finsbury Food (LON:FIF) was a pretty clear buy based on human analysis.
Over the long run, rules may well outperform the human-mind but in the current market I would back the humans (or perhaps some more responsive AI).
Getting back onto topic; this was not meant to be a criticism of SIF or of the new Sell/Hold rules but rather a reflection that in my opinion both need to be judged over a longer period that the next few months. (My personal gut feel is that we are about 2 years away from rules based portfolios performing in any near 'normal' way)
Hi Tony,
Selling Finsbury Food (LON:FIF) was one of the last pieces in the jigsaw that convinced me I needed to try changing my process. I wasn't really happy about it and my personal view was that it made sense as a buy/hold. The valuation appeared (IMO) to price in plenty of bad news, but the results did not flag up any new concerns.
I'd also agree with your comments about a false positive for selling Finsbury in recent weeks.
In terms of the points you make about the impact of volatility on the behaviour of rules-based systems, I'd agree up to a point. In theory, I think you should be right! But what I've found over the years is that the rules seem to work quite well for buying in market sell offs and avoiding peaks.For example, the screen didn't highlight any buys in February, but in March I bought four stocks. I do allow myself some discretion in exceptional circumstances, though. In this year's crash I chose to postpone sales until the market had stabilised somewhat.
Finally, I certainly agree that any changes to the SIF rules will have to be judged over years. That's one reason why I try not to make too many - it's very hard to monitor their impact or to work out if they've been successful.
Cheers,
Roland
Wow Gromely That looks like quite a chart pattern! Have you followed it before? How did it work out for you? Is it possible to screen for it on Stocko?
Hi WS,
I don't want to distract to much from Roland's theme here, so perhaps we can pick up further on this elsewhere. But just to pick up briefly on the chart aspect.
My watchlist currently has me feeling like a kid in a sweetshop (probably a function of the kind of stocks I have been tracking during pandemic gloom).
I'm by no means an expert or even "true believer" on the charts, but I have read with interest both Michael T & Jack C and then done a bit of digging myself and it seems to me that VOLUME on either a direction change or a breakout is a strong signal at the moment (may well be just a feature of the current market phase). So I am just using this to prioritise my potential buy recently, I haven't thought how to screen for it to be honest, I have just been keeping an eye on the charts for my watch list - there seems to be quite a queue for stocks about to "trigger". No idea how it will turn out, but it is looking exceptionally good right now.
Fascinating stuff, thanks Roland. Look forward to see how these work over the course of the next few months. Some observations/thoughts about the rules:
1. There are a lot of sell signals in here, and I wonder whether they will tend to move in concert with each other? (e.g. stocks with falling earnings yields are less likely to pay a dividend etc.). It may be that - as with London buses, you wait around for a sell signal and then 3 come along at once.
2. I suspect that market crash events, such as the Covid crisis, would also prompt lots of companies to meet your sell criteria all at once. The risk with so many sell signals is that you will be heavily tempted to allow emotion/bias to intervene when they prompt you to sell stocks for reasons you struggle to justify.
3. You've used price -5% over 50 and 200 day as your momentum sell signals - as compared to the profit warning definition that Ed and the team used in their analysis of sell signals. Was there a reason why you've chosen this instead of the 20% intraday fall that they adopted?
4. What about the unexpected leaps in price that occur when a stock becomes involved in a takeover situation? I'm mulling this particular point right now as I hold Telit Communications (LON:TCM), currently subject to a 250p all share offer and potentially a couple of other bids. The open market is offering 197p, indicating some doubt about whether this will proceed. But the question these situations raise is: whether to take the money now and run, or ride out the bid process to the end? I chose to hold when Revolution Bars (LON:RBG) was under offer - a wrong decision. In this case I am guessing once more.
5. Your reducing revenue measure makes initial sense, but then I think about businesses such as investment funds whose revenue may decline for reasons unrelated to the stewardship of the business..? Or about the situation where a company that expects declining revenue and adopts share buybacks in a value-accretive way? I don't know the answer, but I wonder how many good businesses might get turfed out on this metric whilst still delivering good returns for shareholders
6. Finally, and this observation applies to your buy criteria as well as the sell criteria. Filtering only on dividend payers has its merits, but also an important downside. Retained earnings compound based on increased book value/per share, but if you take dividends and buy another stock you will typically pay a premium to book value. This is something both Warren Buffett and Terry Smith have highlighted as a key accelerator (or drag) on long term returns.
Hi Kelvin, thanks for such an in-depth comment. I'll try and address the points you've raised as best I can.
1. I think it's inevitable that some rules will overlap. I'm not too concerned about this - what worries me more is that I might have missed a useful signal or that I've become too lax.
2. This year's market crash was pretty exceptional. I see it as (hopefully) a once-in-a-decade event. I did exercise some discretion during the worst of the crash, suspending all sales from the portfolio until the market had recovered somewhat. I don't do this often, but I think a manual circuit breaker is a useful tool to have available.
3. Re. profit warnings and large drops. I have separate rules for these which override anything else - automatic sale on profit warning or after a 25% fall (over any period).
4. In a takeover scenario, I'd use my own judgement rather than following the rules. I don't have a fixed policy on whether to sell into the market or wait for the bid to go through.
5. I agree that there are some investments where falling revenue isn't an obstacle to satisfactory returns. But creating the rules forces me to make sweeping generalisations. I'm afraid this is one of them! More seriously, the type of small/mid-sized, growing business I hope to buy should normally be generating rising revenue.
6. Re. dividends. This is a tough question. On paper (and in practice) I agree that compounding retained earnings can deliver superior returns to reinvested dividends. I think that my requirement for a dividend is not so much about absolute returns as seeking safety. Some companies that don't pay dividends are rock solid. But some are more speculative. I think my dividend rules help to filter out those that are at the riskier end of the spectrum.
Incidentally, for some time now I've maintained a parallel buying screen that excludes my dividend rules. This has allowed me to monitor the extra stocks I might buy if I didn't require a dividend. On the whole, these extra choices have not been inspiring enough to persuade me to change the rules.
However, on a slight tangent I think it might make sense for me to accept stocks that have cut their dividend this year - so many have, often good businesses that are recovering well.
Thanks,
Roland
Many thanks for this Rowland. I can absolutely see the logic at work here although not sure I would have the discipline to apply it rigidly. It does however form a great check list to set against the fundamentals of any stock under consideration to see how far adrift of your requirements they actually are. Hm sounds like I am suggesting a cop out LOL
Hi Roland,
Is the original SIF Screen still being used ? Can I assume that the sell screen is to assist only for selling ie. we will have an additional screen to use for selling.
The sell screen already has a host of companies being shown does that mean they are all to be considered as a potential sale ?
Regards
Melvyngd
Hi Melyngd - as formulated, the screen is actually a holding (rather than selling) screen - ie in order not to be sold when being reviewed as part of the SIF a stock would have to pass all of these tests.
Hi Gromley, thanks for making that clearer I think what you are saying is that these stocks are the ones which meet the new criteria is that correct. Regards Melvyngd
Yes that's what I meant, but as I understand what Roland is doing these are the criteria that need to be met for a stock to be retained in the portfolio once they come up for periodic review.
The criteria to buy them in the first place remains the same.
Thank you
Hi Melvyngd,
I may not have explained this very well in the piece - apologies.
To buy stocks for SIF, I'm still using the original screen.
When portfolio stocks are due to be reviewed for possible sale, I will check them against this new selling screen. As Gromley says, to be held, a stock will need to pass all of the rules in the selling screen. If it doesn't pass them all, then it will be sold.
Perhaps I should have called it the Hold screen...
Regards,
Roland
Thank you