SIF May review: Fulcrum Utility Services, Carr’s, Oxford Metrics & Redrow

It’s the end of another month, so it’s time for the SIF portfolio’s monthly review. For newer readers it might be worth revisiting the rules-based process I used to manage this portfolio.
I run the Stock in Focus screen, which selects stocks that meet my criteria for affordable growth. Most weeks, I review a stock from this screen to decide whether to add it to the SIF portfolio. SIF is a Stockopedia Fantasy Fund, but I also run a very similar portfolio with some of my own money.
Since launching SIF two years ago, it has risen by 45%, compared to a gain of 24% for the FTSE All Share index.
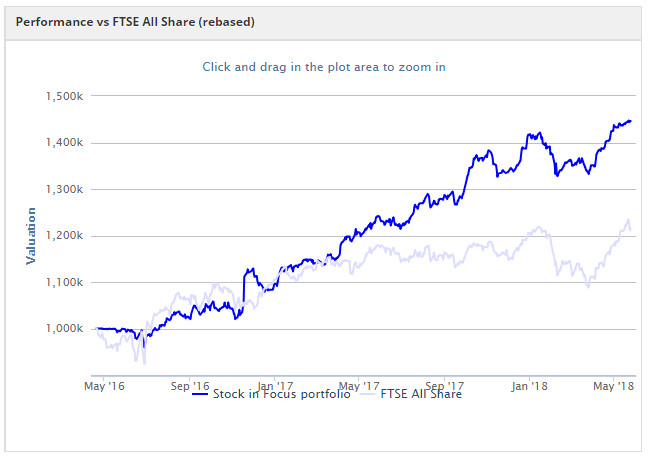
I hold stocks in the portfolio for a minimum of nine months. After that, stocks stay in the portfolio for as long as they continue to qualify for my screen. Then they’re sold.
As it’s now the end of May, I’m need to review the stocks I added to the portfolio in August 2017, plus any stocks held over from previous months.
This month’s stocks
Three stocks were added to the portfolio in August last year, and one company remains from March 2017.
Energy infrastructure provider Fulcrum Utility Services. A recent pre-close trading update indicated that full-year results should be in line with expectations, capping a strong year.
Agricultural feed firm Carr’s issued a decent set of half-year results recently, lifting the shares. I think it’s a nice little business, but it hasn’t performed all that well for the portfolio.
Oxford Metrics is a software group that produces analytical software for customers including infrastructure operators. It has performed well, but is starting to look a bit pricey to me.
Housebuilder Redrow is the portfolio’s longest-ever serving stock, at 15 months. It qualifies for 12 of Stockopedia’s Guru Screens, more than any other UK stock except one.
Here’s how these four stocks have performed during their time in the portfolio so far (excluding dividends):

Carr’s
Although it’s primarily an agricultural feed business, Carr’s also has an engineering division which makes remote handling equipment for the energy industry. Much of this is for the nuclear market, but Carr’s also makes equipment for the oil and gas sector.
Margins are low because of the high volume, low-margin nature of the agricultural business, which is defensive and fairly low growth. But I think the engineering division could provide some cyclical upside, given the growing strength of the oil and gas sector.
Carr’s has a StockRank of 88 and Super Stock status. Although profits fell last year, analysts expect earnings to rise by about 40% this year. This puts the stock on a modest forecast P/E of 11.5. The balance sheet remains strong and cash generation has historically been good.
My decision: Carr’s no longer passes all of my screening rules, falling short in three areas.:
Last year’s drop in profits means that the earnings yield has fallen to 6.1%, below my 8% minimum.
Higher debt levels have caused the Piotroski F-Score to fall from 7/9 to 5/9, below my minimum of 6/9.
A weak share price performance means that the firm has lagged the market, resulting in relative strength <0.
I will sell Carr’s from the SIF portfolio this week.
Total return: 0%
Verdict: Sell from the SIF Portfolio
Fulcrum Utility Services
Fulcrum makes most of its profit from building electrical and gas distribution networks for construction projects. For example, a new housing estate will require a distribution network and a connection to the main grid. This is the kind of work the company does.
Demand is likely to fall during a construction downturn. But the group also owns and operates many of these small-scale distribution networks. This is a regulated business that should provide a more consistent income.
Fulcrum’s half-year results showed the benefit of this twin-pronged strategy. Operating profit rose by 19.4% to £3.7m. Profit from infrastructure services (construction) rose by 12% to £3.2m. But profits from gas transportation rose by 111% to £493k. The company has since gained a licence to also operate electricity distribution networks, broadening the scope and potential scale of this business.
My decision: A review of my screening rules using Stockopedia’s handy Checklist tool shows that Fulcrum falls short in three areas:
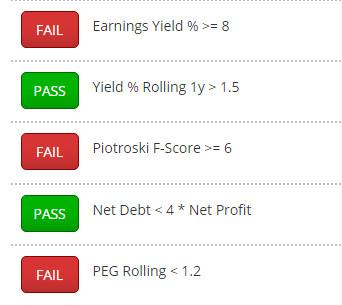
When I added Fulcrum to the portfolio, the shares traded on about 13 times forecast earnings and had a forecast yield of 3.9%. Today the forecast P/E is 16 and the forward yield is around 3.4%.
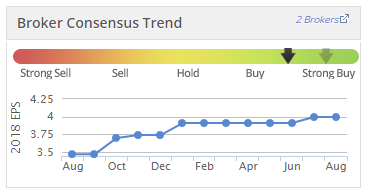
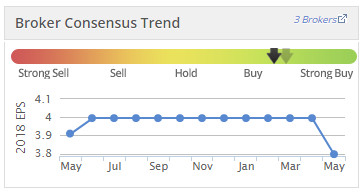
While this stronger rating might be justified if earnings growth was accelerating. However, the earnings upgrade momentum seen last year now seems to have stalled.
August 2017:
May 2018:
Stockopedia’s algorithms style the share as a High Flyer. But they show falling momentum and pretty average StockRank numbers:
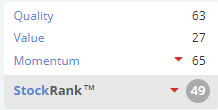
Expensive stocks with slowing growth can sometimes come crashing down to earth. My view is that risk and opportunity are equally balanced here. I’m going to sell these shares from the SIF portfolio this week.
Total return: +33%
Verdict: Sell from the SIF Portfolio
Oxford Metrics
This small-cap software group has been a good performer for the portfolio, gaining about 30% in nine months.
Like Fulcrum, it now ranks as a High Flyer. Also like Fulcrum, it seems possible that earnings momentum is slowing, at least during the current year, which ends on 30 September:
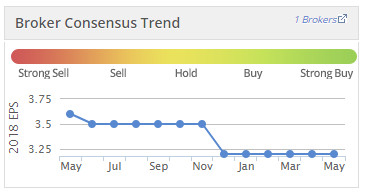
The 2018/19 year may mark a return to growth, as earnings forecasts suggest eps growth of 37% next year. But with the shares trading on a rolling forecast P/E of 19 and offering a sub-2% yield, I think a fair amount of good news is in the price.
My decision: Oxford Metrics’ rising share price has not been matched by its profits. As a result, the stock’s trailing earnings yield has fallen from 8% in August 2018 to just 4.3% today.
This means the shares no longer pass all of my screening rules. They’ll be sold from the portfolio this week.
Total return: +32.5%
Verdict: Sell from the SIF Portfolio
Redrow
My screening rules focus on earnings-related valuation measures, rather than asset value. And because the big housebuilders look very cheap relative to earnings, Redrow continues to qualify for my screen.
Unlike some rivals, earnings upgrade momentum remains positive. The group is expected to deliver eps growth of about 10% this year and further gains in 2018/19. An enviable earnings yield of 15% and a strong balance sheet complete the picture.
My decision: There’s plenty of cyclical risk, but Redrow still qualifies for my screen and will stay in the portfolio.
Total return to date: +29.2%
Verdict: Hold in the SIF Portfolio
That’s all for this week, but I’ll be back next week with news of my three new international SIF stocks for May and hopefully a new stock for the main UK SIF portfolio.
Disclosure: Roland owns shares of Fulcrum Utility Services, Carr’s, Oxford Metrics and Redrow.
Disclaimer
This is not financial advice. Our content is intended to be used and must be used for information and education purposes only. Please read our disclaimer and terms and conditions to understand our obligations.

5 comments
Good morning Roland
Congratulations on your two year performance. The chart looks very nice. I have two small questions:
1. In year one your performance was only slightly ahead of the FTSE All share whereas in the last year you have pulled ahead quite strongly. Do you have any explanation for this? Has there been a change in method? Or maybe different investing environment?
2. Do you include dividends in your portfolio performance? And if so do you use the FTSE total return index as your index (so that both portfolio and benchmark include dividends)
Morning Julian,
Thank you for your comments. In answer to your questions:
1. My methodology didn't change significantly in year two. The only change I made was to increase my minimum holding period from six months to nine months.
What was different in the second year was that the portfolio was more fully invested. When I started in April 2016, the portfolio was 100% cash. As I only added one stock each week (generally) it took some time for the portfolio to gain meaningful exposure to the stock market. So I think this dampened early returns. I think it's fair to say that market conditions have been very favourable in both years.
2. Stockopedia's fantasy fund system doesn't allow for dividends, so these aren't included in the returns shown on the SIF fund page: https://www.stockopedia.com/fantasy-funds/stock-in-focus-portfolio-6449/
However, I do include dividends (and costs) in my "Total return" figure for each stock in these monthly reviews. Personally I'm a big fan of dividends as I believe they're a useful indicator of business quality and management discipline. A yield of at least 1.5% is one of the requirements in my screen (https://www.stockopedia.com/screens/stock-in-focus-screen-113218/).
Regards,
Roland
Hi Nick,
Thanks for your comment. All positions are equally sized. Older positions were opened with £50,000 of virtual cash. Since the portfolio's annual review in April, I have increased the standard position size to £55,000 to reflect the portfolio's increased value.
I don't rebalance except in the unlikely scenario where a holding doubles in value during its time in the portfolio.
Regards,
Roland
Thanks Roland. Good timing with Oxford Metrics (LON:OMG) it seems.
Do you use any rebalancing in this portfolio? How do you decide how big a stake to take in new stocks?