SIF Portfolio: Cyclical turn could make insurer Jardine Lloyd Thompson too cheap to ignore

Last week I wrote about the restricted choice of stocks on offer in the Stock in Focus screen. This week the choice has shrunk even further.
Of the 16 stocks which qualify for my screen at the time of writing on Monday, two are Russian and six are already in the SIF portfolio. A further five are sector duplicates I won’t buy for diversification reasons. And one (Hogg Robinson) has received a takeover bid, so is ruled out.
That leaves just two stocks:
Insurance and employee benefits group Jardine Lloyd Thompson (StockRank 81)
German commercial property group Sirius Real Estate (StockRank 80)
The portfolio rules say that the stock with the highest StockRank should be considered next. So Jardine Lloyd Thompson is the stock I’ll be considering this week.
Jardine Lloyd Triple-bagger
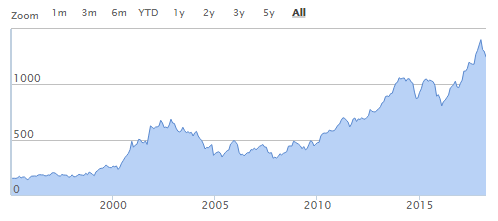
FTSE 250 financial stock Jardine Lloyd Thompson may not be a company you’re familiar with. But savvy investors have snaffled a 50% gain since February 2016. Longer term investors have tripled their money over the last 10 years.
The group’s business has two divisions. The larger one is known as Risk & Insurance and provides specialty insurance, reinsurance and broking services. This includes providing cover for airliners, energy industry assets, shipping cargo, buildings and much more.
The smaller half of JLT’s business deals with providing outsourced Employee Benefits. This includes pension administration, healthcare and life insurance and other services with a finance tilt.
The group has a market cap of £2.7bn and trades in the FTSE 250. It was formed when Jardine Insurance Brokers merged with Lloyds Thompson Group in 1997. But as the name suggests, Jardine Insurance was originally spun out Hong Kong-based trading company Jardine Matheson, whose history can be traced back to 1832.
The Stockopedia graphic shows that Jardine Lloyd Thompson’s free float is just 54.8%.
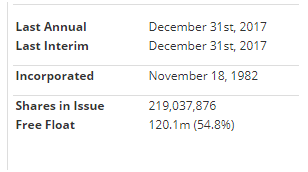
The reason for this is that Jardine Matheson holds a 40% stake in the firm. This probably means that a takeover bid is unlikely here, but I don’t see that as a big problem.
The company comments that Jardine Matheson’s “reputation and local knowledge are of great value” when dealing in Asia. Having a dominant shareholder doesn’t seem to have held back growth or shareholder returns, either:
Is value on offer?
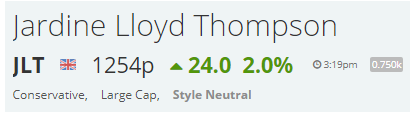
JLT scores quite highly with Stockopedia’s algorithms. Alongside its StockRank of 81 it has a StockRank Style of Neutral and a RiskRating of Conservative, which denotes low volatility.
Conservative stocks have collectively delivered steady gains and relatively few sleepless nights over the last five years, as this chart shows:
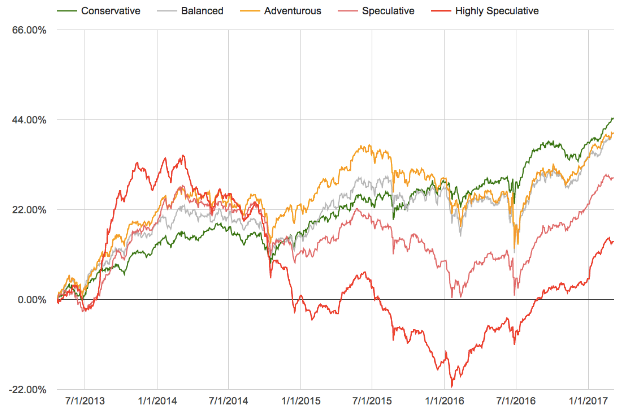
My hope is that this conservative profile will go some way to offset JLT’s rather low ValueRank of 47:
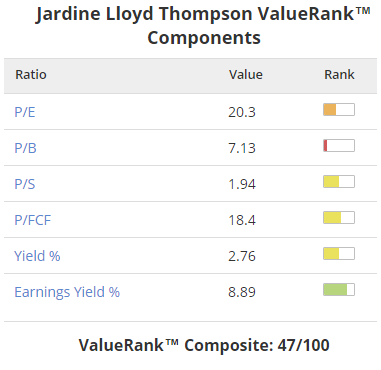
Although my favourite earnings yield is satisfactory, at nearly 9%, the other figures all suggest a more demanding valuation than I’d usually seek when buying a financial stock.
These figures are all consistent with each other and don’t suggest any problems to me. This could just be a good business which deserves a premium valuation.
However, I think it’s worth taking a closer look to see if we’re exposed to the risk of mean reversion. If the shares have risen faster than earnings for several years, this process may reverse to return the stock’s valuation returns to its long-term average level.
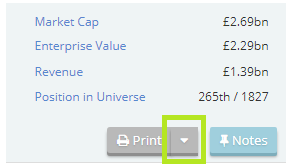
You can check this by looking at historical share prices and earnings per share. But a quicker and easier way to get a snapshot of past valuations is to look at historic Stockopedia data for a share. You can do this by clicking on the arrow next to the grey ‘Print’ button just below the market cap information:
The earliest StockReport available for JLT is September 2013. Here’s how the firm’s key value and growth metrics 4.5 years ago compare with those today:
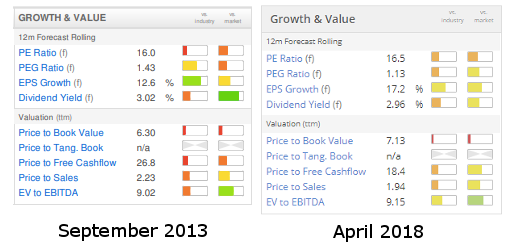
JLT’s valuation and growth metrics appear similar in both snapshots. I think it’s probably fair to conclude that the shares aren’t wildly more expensive than they were nearly five years ago.
Based on this conclusion and the stock’s attractive earnings yield, I’m happy to accept JLT’s value metrics.
A fair price for quality
Things get much better when we consider the company’s QualityRank of 91. This suggests a history of high returns and strong cash generation, backed by a healthy balance sheet.
For companies of this kind I think it’s possible to justify a higher starting valuation for an investment (note that the Altman Z-Score is not applicable to financials):
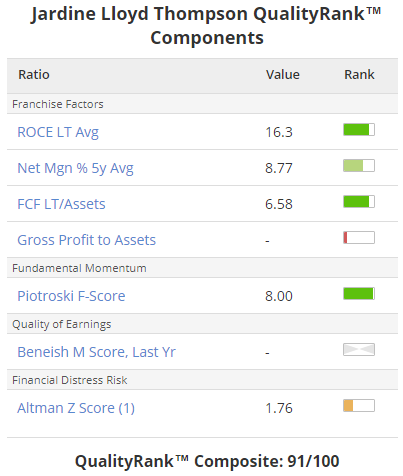
What I’m looking for here is consistency. This snapshot hints at this but I think it’s worth considering the year-by-year figures to confirm this view:

2016 seems to have been a low point for the firm. Happily, performance improved notably in 2017. Looking more closely we can see that this improvement was driven by the insurance business. I’ve circled the relevant figures from the group’s 2017 results:
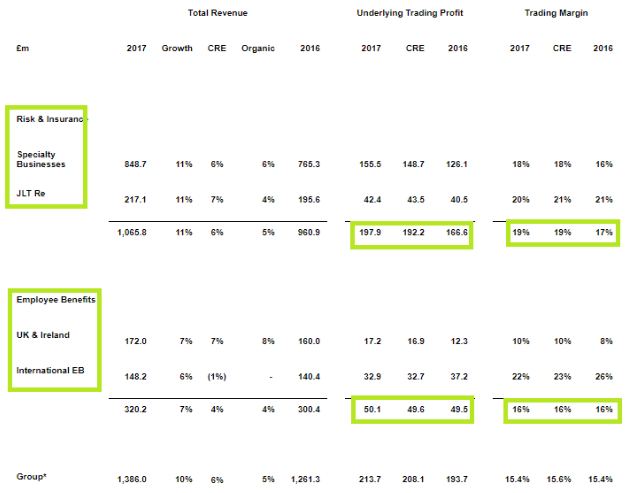
Insurance generated about 80% of trading profit in 2017, up from 77% in 2016. Margins improved last year and insurance profits were also boosted by exchange rates (CRE is constant rate of exchange).
In contrast, profits and margins in the employee benefits business were flat last year, with only a small benefit from exchange rates. Although profits from this business are lower, this appears to be a profitable niche for the firm which provides stable profits to offset less predictable insurance profits.
I’ve no concerns about either part of the business and am happy with JLT’s quality metrics.
Will recent momentum persist?
JLT’s MomentumRank of 65 isn’t bad. But it’s not dazzling either.
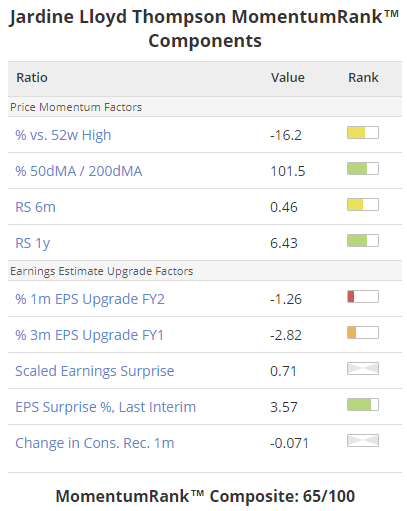
Earnings forecasts were trimmed after the group published its full-year results in February, but I think the picture may be brighter than it appears.
The employee benefits business is now expanding into the international market, having previously been focused on the UK. The segmental figures I pasted in above show margins for the International EB business more than 20%, versus c.10% for UK. Continued growth could generate a worthwhile increase in profits.
In insurance, the management is cautiously optimistic that “the trend of steady price reductions through a number of years seems to have moderated or ended”.
Although this statement was balanced with a comment that “it would be premature to refer to a hardening market”, I think it’s fair to assume that conditions are starting to become more favourable.
Recent commentary by sector rival Lancashire Holdings seems to support this view:

My decision
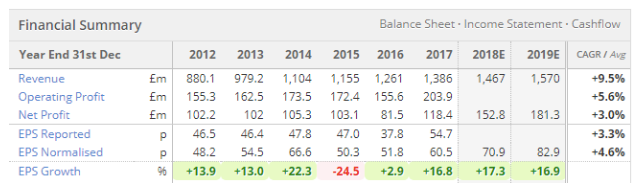
Although earnings forecasts have been trimmed for 2018, it’s worth pointing pointing out that the current forecast still indicate a 21% increase in underlying earnings this year.
At this point it’s impossible for an insurer to know how many natural disasters or other major claims are likely this year. But I think the wording of the group’s outlook certainly allows room for expectations to be raised as the year progresses.
I’m a little concerned that the nine-month holding period used by SIF is too short for a business like this. But JLT stock passes all of my tests, so I will be adding it to the portfolio this week. I’ll also buy it for my own portfolio after this article has been published.
Disclaimer
This is not financial advice. Our content is intended to be used and must be used for information and education purposes only. Please read our disclaimer and terms and conditions to understand our obligations.

17 comments
As I am a new subscriber still feeling my way, found the article quite helpful, as well as the questions and answers that accompany it. Still have a bit to get my head around, but am quite liking what I am seeing, think it will be a great help for the future.
Thanks Roland, would appreciate your thoughts on how you calculate the earnings yield.On a net profit after interest &tax has been paid the EY comes in around 6%,on a EV/EBITDA close to 9%.
Hi coniston,
The earnings yield is calculated as EBIT/EV (so more or less operating profit/EV).
This provides a measure of profitability and valuation that's independent of capital structure and tax, but which does include the essential costs of depreciation and amortisation.
Cheers,
Roland
Excellent article thank you. The comparison between the 2018 and 2013 metrics particularly interesting as a way of showing how valuations have or haven't changed over time although it needs an understanding of how cyclical the stock is to understand it properly.
I think it's important to point out that Jardine Lloyd Thompson (LON:JLT) is a broker, it's not an insurer or underwriter, so if there is huge catosphere it will not produce losses, in fact it will gain as premiums shot up, mind you as it places a lot of reinsurance then it will have a lot more work. Yes rates of exchange are important, most insurance business is in US$s, so if the £ goes up it's not good news, probably why the share price has slipped back this year. I suggested this share after Brexit. The other issue is profits, from some classes of insurance brokers can really benefit from Wars, the war rates shot right up as in the Iran/Iraq gulf conflicts. So yes it could be a god time to buy some.
Hi Herbie,
Thanks for pointing this out, I should have made it clear that Jardine Lloyd Thompson (LON:JLT) is a broker only, not an insurer.
As you say, JLT won't face the potential impact of catastrophe losses. Even so, I think the group should benefit if market conditions harden and premiums rise.
It was certainly a good post-Brexit buy!
Regards, Roland
Thanks Roland, really interesting. Can you help me? Where do you find the Value, Quality and Momentum components on the Stock Reports? I am a regular user of Stockopedia but you are pulling out slightly different data to the normal reports.
A response here when you can would be useful. Keep up the great work.
Charles
Hi Charles,
There may be an alternative way to see the individual components but I view them via the Folio screen view.
If there is a stock I am interested in delving into further then I add it into my Watchlist portfolio. Under the portfolio view you see a range of headings along the top for the stock rank and tabs for the the individual ranks such such as growth, value and momentum.
Click on any of those and you see a different screen relevant to the tab you clicked on. On this screen you will see the circle/bob containing the particular ranking score - click on the circle itself and a pop up screen giving the individual scoring components is then shown.
Hope that helps - I have only been able to find the components by going through the folio view route but someone else may be able to add to that/correct me/show a quicker route.
Best
Richard
Thanks Richard for taking the time to help. I have got it now. I think it was the way Roland showed the data which is a different view I had not seen before. I must look at those views in more detail for future share research. Roland also helped by pointing out comparing the stock report of some time ago. I have done this before but he made the point of using the data to compare with a view to if it is still good value. I don't think I have explained that very well but I'm sure you know what I mean.
Good investing, are you going to Mello? I am.
Happy to help Charles, and I see Nick and Roland have also offered alternative routes to view the figures.
Would've loved to be attending Mello but can't this year due to commitments - maybe next year !
Best
Richard
There is also a "back-door" way in which shows the numbers but not the coloured "rank" info:
https://www.stockopedia.com/ajax/composite_rank/ratios._QualityScore_zz/LON:JLT/
https://www.stockopedia.com/ajax/composite_rank/ratios._ValueScore_zz/LON:JLT/
You just change the stock at the end of the URL to see the stock you want.
Usually the nice way in is the best approach but it does require you to put it into a folio first which is sometimes a pain.
Hi Charles,
Thanks for your question. I should include a reminder of how to find the QVM components in my articles more often than I do!
The easiest way to view the component breakdowns of the QVM ranks is on the sector pages -- just click on any of the rank numbers to see its components. Doing it this way means you don't have to put it into a Folio.
Thanks,
Roland
Thanks Roland and Nick Ray, I have got it now and have found the info as you displayed it in the article. I have to say you are some great guys and gals out there as there are always people who come back with useful tips and answers. Not only is Stockopedia fantastic but the community who use it are great as well. The beauty of investing is it is not a competitive sport so helping each other is good. Thanks one and all. Hope to meet some of you at Mello. Charles
After reading your analysis of the figures I wondered why Jardine Lloyd Thompson (LON:JLT) had not appeared on any of my screens since it seemed to be well within the kind of values that I typically screen for.
The answer was for reasons like this:
It is slightly frustrating that otherwise interesting stocks can fail a screen because data for a particular rule is not available. I have no idea why the Volatility is not available since Jardine Lloyd Thompson (LON:JLT) has definitely got more than enough price history to compute it.
An option to specify how to treat N/A (i.e. as a pass or fail) for each rule would be quite handy.
Hi Nick,
Thanks for your comments. In answer to your questions:
Volatility: I've noticed that all the RiskRating volatility classifications are missing today (e.g. Jardine Lloyd Thompson (LON:JLT) was shown as "Conservative" when I wrote the article on Monday, but today it's showing nothing). Your comment about 1y volatility being n/a might be linked to this. I've raised the question with the Stockopedia team.
Beneish M-score: This doesn't apply to financial stocks.
Gross profit to assets: JLT doesn't report gross profit in its accounts, so this isn't available. Gross profit isn't always relevant -- it's mostly of interest for companies which sell physical products, so the gross margin on the product can be measured separately from the company's overall operating margin.
Hope this makes sense. I find that sometimes my screening rules need to be tweaked for financial stocks, to avoid false positives/negatives.
Regards,
Roland
Just an update on this re. missing RiskRating volatility scores
These were missing due to a technical issue, but are now back on the StockReports and should be available for screening again tomorrow (Wednesday).
Roland
OK - thanks for the info about volatility. I han't noticed that it was missing for all stocks.
As for Beneish etc, you might think that if the metric was not applicable that it would be a PASS rather than a FAIL really. I suppose it depends what you are trying to ask with any given screen.