SIF Portfolio: Oxford Metrics' recent pullback may be a buying opportunity

I’m a firm believer in the value of keeping some kind of written record of your investing decisions. Doing this helps me to double-check the logic behind my decisions. An argument can sometimes appear watertight at first, but may fall apart when you try to put it down on paper. Having a written record of decisions also provides a useful window into your past thinking.
Unfortunately, life and work sometimes get in the way of good intentions. I don’t always manage to document my investing decisions as fully as I’d like to. Similarly, I’ve found this week that the records I’ve kept for my SIF Portfolio trades aren’t as detailed as I’d like them to be.
In July, I sold small-cap asset manager Miton Group from the portfolio for a total return of 46.3%. Yesterday, I noticed that it had reappeared in my screen. Had it been there last month, I wouldn’t have sold. So what’s changed?
Identifying why a company doesn’t qualify for a screen is very simple, thanks to Stockopedia’s excellent Checklist tool. Stocks fall out of the screen when they no longer pass the 14 rules I use.
Back in July, I used the checklist tool to find out why Miton no longer qualified for the screen. But I didn’t write down the results, and didn’t include them in my article. And now of course I’ve forgotten what the checklist showed. So I’ve no idea of the quantitative reasons behind the decision to sell, which is frustrating.
From now on, I will keep a record of this data for each stock sold from the portfolio. But in the meantime, I need to move on.
I’m not going to add Miton back into the portfolio, at least not this week. Although I’m still keen on this firm, the portfolio already contains four other financial stocks, including an asset manager (Standard Life Aberdeen).
In contrast, the portfolio doesn’t contain any technology stocks at the moment:
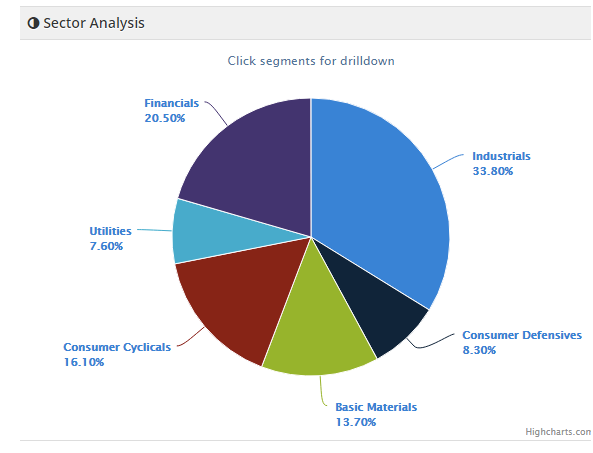
Back in July, I discussed the portfolio’s lack of technology stocks. I suggested four companies which might qualify if their share prices fell slightly.
I’m happy to say that this has now happened. Software developer Oxford Metrics has appeared on my screen this week. The AIM-listed group’s shares have slipped back about 7% from recent all-time highs, improving the value and growth metrics for the stock. As a result, this £69m firm is this week’s candidate for the portfolio. So let’s take a closer look.
Super stock, super price?
Oxford Metrics produces data analytics software for a variety of industries and public sector clients. It has two divisions, Yotta and Vicon. Yotta is focused on infrastructure asset management, while Vicon is “the world leader in high precision movement analysis”, working in sectors including life sciences, engineering and entertainment.
Stockopedia rates the company’s financial profile very highly. It has a StockRank of 94 and StockRank Style of Super Stock. The weakest of the stock’s QVM ranks is the ValueRank, which is just 56. So let’s start there:
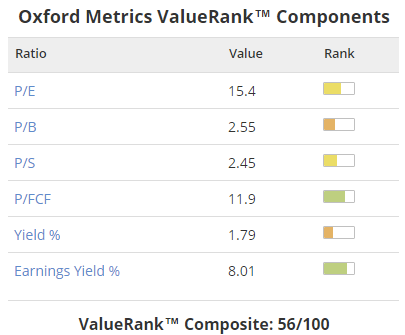
Clearly this isn’t a standard value stock. I’d argue that the shares are priced for growth, but the earnings yield of 8% suggests the stock is still attractively valued relative to earnings.
You might think there’s a contradiction between a relatively full P/E ratio and an attractive earnings yield. The reason both can be seen together is that rather than having net debt, this company had net cash of £11.1m at the end of the last reporting period. This means 16% of Oxford Metrics’ market cap is covered by cash, reducing the firm’s enterprise value (EV) to about £58m. This boosts earnings yield, which is calculated using EV rather than market cap.
It’s worth noting that free cash flow seems to have been boosted during H1 by a big reduction in working capital. This isn’t likely to be repeated, but the underlying cash flow looks okay to me.
The firm’s other value metrics are unremarkable, but not poor enough (in my opinion) to cause any concern.
Top quality
The main attraction here are the quality metrics for this stock, which has a QualityRank of 96. As you’d expect, there’s very little to dislike:
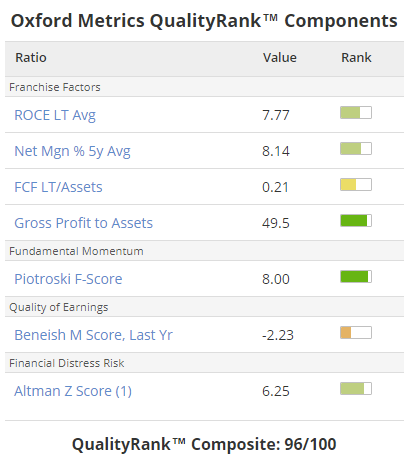
It’s worth noting that this group has undergone some restructuring in recent years, mainly by disposing of a loss-making division. Last year’s net margin was 10.1% while ROCE was 16.6%. So there’s scope for the figures above to improve further if the group can maintain a consistent performance.
I’m reassured by the group’s high fundamental health score (F-Score) of 8/9 and believe that this business’s 17-year history and healthy margins suggest that it enjoys at least some competitive advantages in its chosen market.
Certainly I’d expect the supply of software for asset management to be a sticky business. Switching between such systems is a big hassle that most companies would rather avoid, in my experience.
Why are the shares down?
The stock pulled back recently after surging higher following June’s interim results. But I don’t think this is a sign of failing momentum.
The company is at the start of a five-year plan to develop and grow the business, under the control of a new chairman. which the board expects to be self-funding, with no new debt or equity. Both Yotta and Vicon have recently released new software as part of this plan, following which chief executive Nick Bolton reported “a very encouraging start to the year”.
As you can see from the chart, a pullback wouldn’t have been surprising in any circumstances. But I think the share price has also been hit by two big director sales, on 4 July and 8 August:
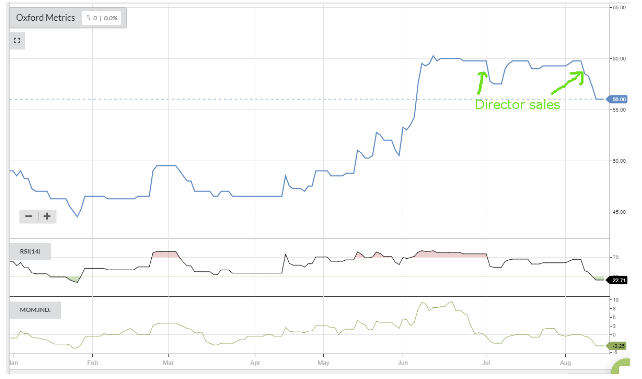
Should we be worried about this insider selling? In this case, I don’t think so. Here’s a summary of the two sales:
Seller: Nick Smee, managing director of Yotta since 2010. Mr Smee sold 149k shares, netting about £84k. His remaining holding wasn’t disclosed.
Seller: Julian Morris, founder and non-exec of Oxford Metrics. He sold 1.1m shares on 8 August, collecting about £628k. Mr Morris still holds a 5.7% stake in the firm, which he founded in 1984.
Neither of these sales look especially alarming to me. I suspect it’s more a case of each man wanting to diversify their investments and perhaps free up cash for other purposes. I tend to be more interested in large director buys. These are usually voluntary and require upfront cash outlay -- hence can be bullish signals.
On balance, I’d argue that these falls have left the stock looking modestly oversold. In the chart above, you can see that the RSI indicator has moved into green (i.e. oversold) territory. The stock may well be positioned for another move higher, especially if full-year results echo the strong performance seen in H1.
My decision
I was impressed by Oxford Metrics when in July and am still keen today. I’m going to add the stock to the SIF portfolio this week. I’ll also add it to my own portfolio, after this article has been published.
Disclaimer
This is not financial advice. Our content is intended to be used and must be used for information and education purposes only. Please read our disclaimer and terms and conditions to understand our obligations.

7 comments
I agree re Oxford Metrics. See the recent inertia as a pause for breath ahead of a move north.But there again I would as bought stock at 58p.
£OMG's short but fairly upbeat interim statement is out today, accounting for the rise in SP. Decided to jump in with a small stake on the back of it
For me I'd probably have given this stock a miss. A SP of 58 close to very strong resistance at circa 60 and a spread of 345bps means in my book little to no profit in the short term until a positive catalyst appears, I also think this may have a little further to drop, and if so could well change my perspective on it. Maybe Roland the emerging resistance was you trigger to exit originally ?
FWIW, I noticed Robby Burns bought the stock back in June, at 60p with a target set at 85p, so it's not done much in the time since. http://nakedtrader.co.uk/trades.htm
I suppose a vote of confidence from the naked trader at least!
It's cagr eps is patchy and not impressive over the long-term. It dilutes its share base. It looks over-valued for a growth company and directors are selling. I don't see much attraction at present.
I like the look of this company that seems to tick a lot of the " moat qualities"
Would you agree?
Thank you for this, a good insight into the mindset of a good investor. I always value reading how you asses a stock and how you reach a buying decision. many thanks. Charles