SIF Portfolio: Pan African Resources update + Alternative Networks

The temptation to break your own rules when investing is immense. But there’s a lot of evidence which suggests that sticking to a set of buying and selling rules over a long period is one of the best ways of generating decent returns.
The proof of the pudding can be found in the exceptional long-term returns of disciplined, methodical investors such as Warren Buffett, David Dreman and Jim Slater.
Indeed, if you’re interested in seeing how a Buffett-inspired value and quality approach can be applied successfully to the UK stock market, I’d strongly recommend reading Strategies Editor Ben Hobson’s new interview with fund manager Keith Ashworth-Lord. Keith runs the Sanford DeLand UK Buffettology Fund which made 27% in 2015, pushing it to the top of the IA All Companies sector.
Should I tweak my screen?
In my case, the temptation to tweak the rules of my Stock in Focus screen in order to broaden the potential pool of buy candidates is stronger than ever this week.
I’ve mentioned before how steep valuations and limited earnings visibility have caused a big drop in the number of stocks qualifying for my SIF screen. A high valuation means that my requirement for an earnings yield (EBIT/EV) of 8% or more isn’t satisfied. Poor earnings visibility means that earnings growth metrics are too weak.
Because companies must qualify for my screen before they can join the SIF portfolio, finding new buys is difficult at the moment. The number of stocks qualifying for the screen has hit a new low of three this week.
Of these three, Somero Enterprises and BAE Systems are already in the portfolio. The third stock is a Russian energy firm which I feel is probably outside my circle of competence.
Of course, when building a portfolio, there is rarely any rush. There’s certainly no need to buy a new stock every week. However, I’m keen to understand how market conditions are affecting the number and type of stocks qualifying for the screen.
To satisfy my curiosity, I’ve been experimenting with the screening rules. I wanted to know if there was a single requirement that was blocking otherwise attractive companies. I’ve discovered that many companies which would otherwise qualify are being excluded because they’ve underperformed the market this year.
This underperformance is reflected in a negative 1-year relative strength figure (RS 1y). My screen specifies that this should be positive. Removing this screening requirement increased the number of stocks which met all the other requirements for my screen from 3 to 17.
Should I ignore relative strength in order to find attractive stocks?
What about Alternative Networks?
One of the stocks which qualified for my screen when the requirement for RS 1y >0 was lifted was telecoms reseller Alternative Networks. Telecoms is classified as a defensive sector and Alternative Networks would have been a useful, diversifying addition to the Stock in Focus Portfolio.
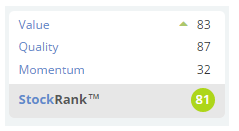
The stock scores highly for value and quality and has a StockRank of 81.
However, a profit warning earlier this year knocked the share price, which has continued to drift lower. This means Alternative’s 1-year measure of relative strength is negative, preventing it qualifying for my screen:
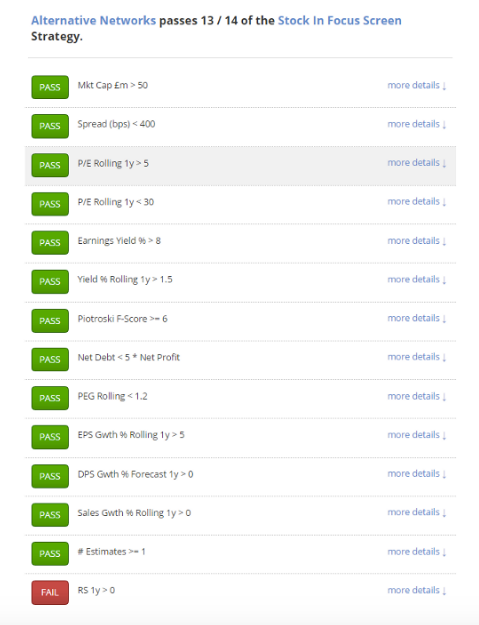
I was originally tempted to ignore this requirement and add the stock anyway. But I soon realised this would be a bad idea. Each of the criteria in my screen serves a particular purpose (I hope!). The purpose of relative strength is that it indicates share price momentum.
My screen was designed to find good, improving stocks at reasonable valuations. Alternative Networks doesn’t seem to fit this category, at least not at the moment.
After the profit warning in February (see Paul Scott’s write-up here) the firm’s interim results in June warned of a second-half weighting to profit. Market scepticism is reflected in a 7.4% forecast yield for this year. The market confidence needed for share price gains is currently missing.
As a result, I’ll be sticking to my rules and will not be making any additions to the portfolio this week.
Do you stick to the rules?
Stockopedia is very much focused on using rules and statistical factors as the basis for investment choices. Long-term use of Stockopedia has certainly made me focus more seriously on developing a repeatable process for my own personal investments.
I’d be interested to know what you think about this. Do you have a fixed, rules-based process for picking stocks, or do you rely more heavily on an individual analysis of each business?
Pan African trading update
Getting back to the SIF portfolio, gold miner and portfolio member Pan African Resources issued a surprise trading update on Tuesday. Pan African was one of the earliest members of the portfolio and is the top performer so far, up by 46% since May.
Tuesday’s update was made to satisfy the requirements of the Johannesburg Stock Exchange, where Pan African is also listed. Whenever results for the current period to reported upon are going to differ by more than 20% from those of the comparative period, a trading update is required.
Pan African’s fast-rising earnings mean that’s the case here. Picking out the key figures from Tuesday’s update, normalised earnings per share for the year ending 30 June 2016 are expected to be between 2p and 2.13p. Headline earnings are expected to be between 1.37p and 1.5p per share.
For JSE-listed companies, I tend to view headline earnings per share (HEPS) as a useful measure. HEPS is a measure of adjusted earnings defined by the JSE. It’s designed to reflect trading performance, excluding non-cash items such as asset impairments. However, it’s more restrictive than companies’ own adjusted earnings.
Pan African shares didn’t move after yesterday’s update. I suspect this is because the firm’s earnings guidance appears to straddle current broker consensus forecasts of 1.71p per share. So full-year results in September seem likely to be broadly in line with expectations.
One thing that Pan African’s trading update did highlight was the massive dependency on currency factors for South African commodity firms:

The lack of currency hedging and the interplay between the South African Rand, US dollar (in which gold is priced) and Pan African’s GBP reporting currency means that reported profits won’t always change in line with the price of gold.
However, Pan African’s performance last year appears to have remained in line with expectations. The stock will remain in the portfolio until its six-month review in October.
Disclosure: Roland owns shares of BAE Systems.
Disclaimer
This is not financial advice. Our content is intended to be used and must be used for information and education purposes only. Please read our disclaimer and terms and conditions to understand our obligations.

9 comments
The recent results
http://www.investegate.co.uk/pan-african-resources...
have enabled me to update my profitabililty model of Pan African Resources (LON:PAF) to include the non-gold assets:
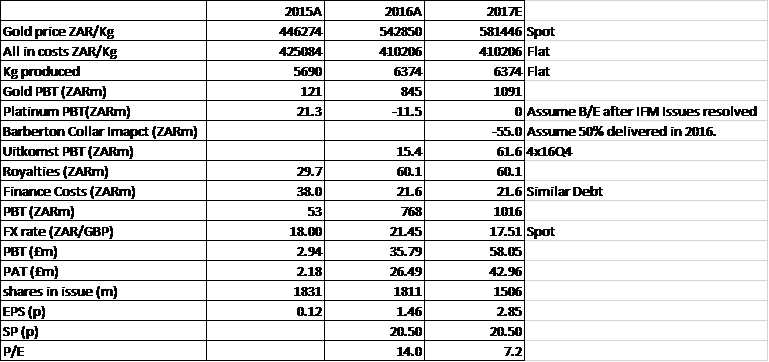
Historic EPS doesn't exactly match reported figures due to minor adjustments, fx on debt/cash etc. but gives a good approx of the underlying profit performance.Interestingly consensus EPS is now increased to 2.91 for FY17 which is slightly higher than my estimate. Although I have modelled flat production. Even a 2% increase here would see the consensus hit.
Strangely the FY18 consensus drops to 2.70p. Think this can only come from modelling a drop in gold price or production since the Barberton collar would drop out and if Phoenix Platinum returns to historic profitability then we would be looking at 3.07p EPS from flat gold price/fx/production.
The other news is the resource/reserve upgrades giving higher Life of Mines.
http://www.investegate.co.uk/pan-african-resources...
Long LOM's makes it more relevant to use P/E as a valuation metric.
In summary the analyst consensus for FY17 EPS does seem reasonable and with this giving a forward P/E of c.7 the market does seem to continue to undervalue the business. The analysts consensus for FY18 now looks too low unless there are material adverse moves in gold price, FX or reduced production in that FY so has the potential to be upgraded going forward.
Roland Head asked for comments on a 'rules based process' and sticking to those rules.
I provided a link which addresses that question. It is well written and I have consulted it periodically over the past 25 years.
Rather than paraphrase it I shall speculate on how Roland Head came to ask the question. The SIF portfolio is fictitious and presumably aims to showcase what the Stockopedia computers can do. As such is it is useful and has led me to discover 'tricks' and aspects of Stockopedia that I would not otherwise have found.
The fact that the portfolio has not been purchased by the author, however, removes the element of emotion and all the rules relating to management of capital. As such it will never test his ability to contol his emotions and deal with profits and losses.
As he points out and Prechter underlines in his piece, rules can contradict themselves. Furthermore rules do not help if they are not followed in periods of stockmarket volatility when the majority of profits and losses are made.
@aflash,
Thanks for your comment! It's probably worth pointing out that the SIF portfolio is a new project I started for Stockopedia less than six months ago.
This portfolio isn't really meant to demonstrate my personal qualities of self control and discipline. It's simply designed to showcase what might be possible by following a rules-based strategy. It may of course underperform the market, leaving me looking a bit daft. It's too early to say...
Regards,
Roland
Roland
Many thanks again for a useful paper, as always I enjoyed it.
I would like to say however, that even if your rules-based strategy does underperform the market, to me, it does not matter.
To me the usefulness of your research is that you are systematically explaining and recording the operationalisation of your particular rules-based methodology. None of us knows what the outcome will be.
The value will be, I believe, not necessarily in the financial result you obtain, but most importantly, in analysing your records to see what factors or execution of the method had the most influence on the outcome. I look forward to that retrospective in due course as I think it will offer up some useful insights.
Regards
Howard
The good news about the Pan African Resources (LON:PAF) update was not the H2 EPS but the potential FY17 read through. In terms of positive developments we have:
- Higher rand gold price today of ZAR609k/kg vs 543k/kg H2 Average = +12.2% EPS
- FX is better today at 18.62 vs H2 Average of 21.45 = +15.2% sterling EPS
- lower number of shares in issue (I got the outcome of the Shanduka transaction wrong originally and modelled an increase in shares.) = +21.5% EPS
- Barberton cost collar expiring Oct 2016 25koz = 777kg @ spot ZAR vs ZAR440k/kg = +ZAR131m = +£7m = +0.5p
- Full year uitkomst colliery contribution to earnings.
- resolution of IFM issues.
So at today's gold price & FX we are likely to see a 57% growth in whatever EPS measure you prefer from 16H2 to 17H1 plus whatever positive contribution from uitkomst colliery & IFM returning to normal give. Then 17H1 to 17H2 could have a further positive boost of up to 0.5p EPS from Barberton Collar expiring.
I'm gold agnostic but if we see further gold strength then these numbers will increase.
Broker consensus is only for +54% EPS growth for 2017 so there is scope for these to be increased during the year if gold prices and fx stay at current levels.
@dangersimpson,
I agree with you in principle about the FY17 readthrough for Pan African Resources (LON:PAF), but my point (hopefully) was that there are a lot of moving parts and assumptions relating to exchange rates and commodity prices.
These can have a big effect -- for example in the recent Q3 update from PAF's fellow South African precious metal producer Lonmin (LON:LMI), the firm provided numbers showing how over the last year, their basket price for platinum group metals had fallen by 12% in USD but risen by 9% in Rand.
The recent weakness of the pound adds another variable into the mix for us UK investors.
All of these moving parts can mean that forecasts may appear precise but are based on uncertain assumptions, in my opinion.
Having said all of that, I think PAF continues to look good as an investment and believe the gold market is likely to remain strong.
Regards,
Roland
That's why I just take spot prices. I think in the absence of any real in-depth commodity & fx market analysis (which is way beyond my ability) they are the best guess of future prices.
The good news for Pan African Resources (LON:PAF) is that today's spot prices if they held constant for the next year would give at least a 57% increase in EPS and probably a fair bit more if the positive operational progress continues.
In the broader sense PAF is a gold producer rather than just an explorer and the biggest factor relating to the price is the price of the yellow metal itself. So Paf as many other gold producers at this time is `Gold on Steroids`
https://fr.scribd.com/document/40167590/Robert-Prechter-What-a-Trader-Really-Needs-to-Be-Successful