Is the SIF portfolio too heavily exposed to cyclical stocks? It’s a question I’ve been asking myself more and more often. Of the 18 stocks currently in the portfolio, only two or three can be classified as defensive:
Specialty pharmaceutical supplier Alliance Pharma
Animal feed and fuel/heating oil group NWF
Insurance and employee benefits group Jardine Lloyd Thompson (some elements of this business may be defensive, or at least not linked to standard economic cycles)
This cyclical bias means that the portfolio’s sector weightings are very different to the market average:
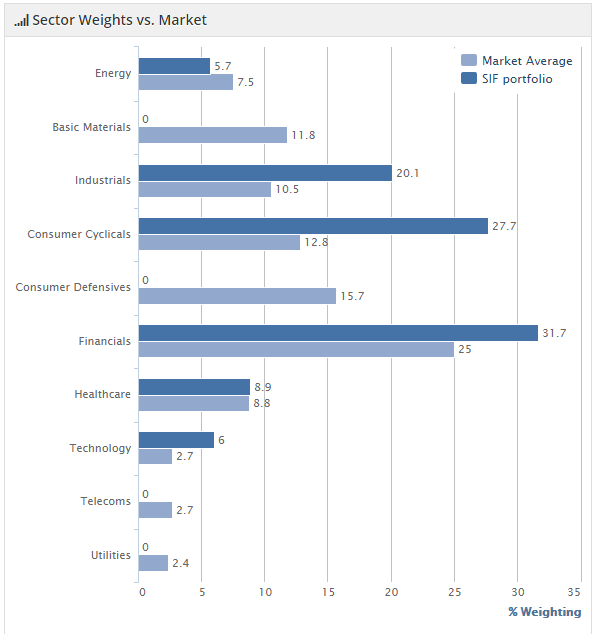
In some ways I’m comfortable with this. I don’t think you can outperform unless you take a different position to the wider market. But taking such a divergent position also increases the risk that I will underperform the market at some point. The portfolio’s heavy cyclical bias means that it’s especially exposed to the risk of a UK downturn.
Is it time to turn defensive?
Two years after the portfolio was launched, we’re obviously at a later stage of the current economic cycle. Despite this, most of my cyclical stocks are still performing well:
However, when viewed as a whole, the portfolio doesn’t look quite as cheap or safe as it once did.
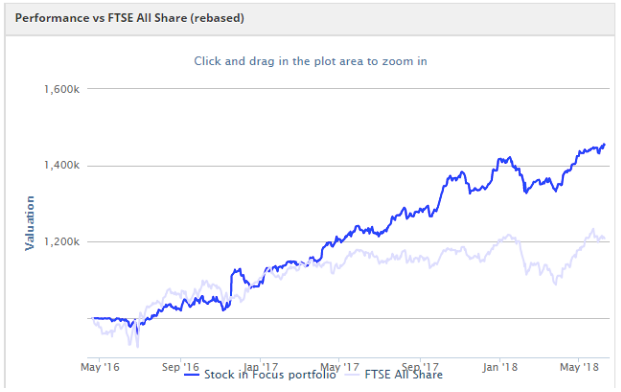
SIF portfolio, November 2016 (dark blue line represents SIF):
Back in late 2016, the portfolio seemed to be delivering on its brief of buying affordable growth.
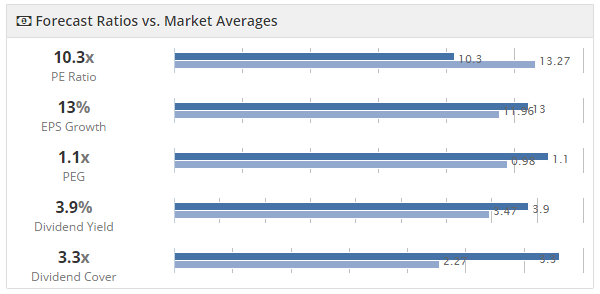
That’s still true today, but the figures are not quite as compelling as they were 19 months ago. Here’s how the portfolio looked at the time of writing:
June 2018
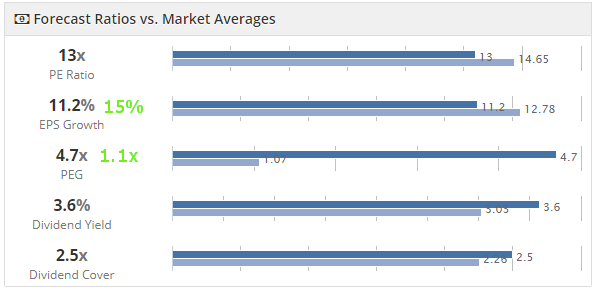
P/E: The portfolio’s aggregate P/E ratio is higher than it was, although it’s still below the market average.
Dividends: The average dividend yield and the level of dividend cover have also worsened, although they remain ahead of the wider market.
Earnings growth: At first glance, the eps growth and PEG ratio scores look poor, with SIF lagging the market on both counts. To address this, I’ve massaged the data and provided some improved alternatives, which are shown in green!
In all seriousness, the reason I’ve calculated alternative figures is to address some anomalies in the Stockopedia data. Forecast eps growth and forecast PEG…