Stock market correction - opportunities to get back in the game

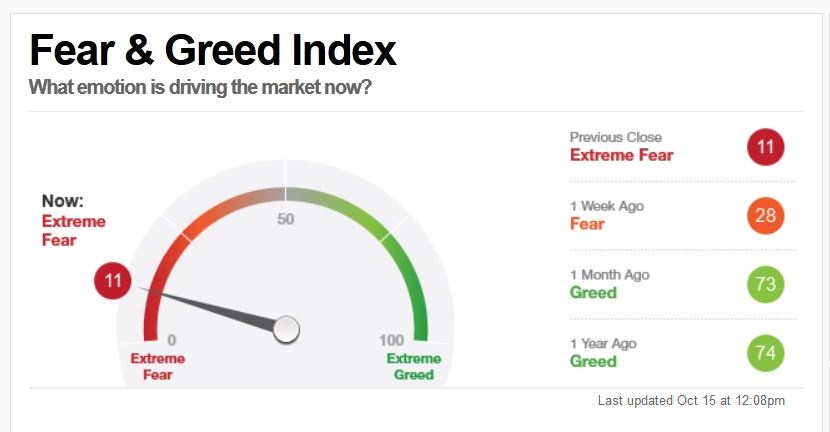
What you see above is the Fear&Greed Index you find on CNN. The index indicates whether investors are currently very optimistic - or if they are afraid. It is easy to see that they have become very anxious. The index is only 11 out of 100 possible points, last week it was even at 6. This is the result of the correction we are currently experiencing on the world's stock exchanges.
What am I gonna do now? I am back in the game since I stood on the sideline with cash since the beginning of the year. The reason why I get back in the market is simple – there is a rule: If the Fear&Greed index falls below 18 then stocks are especially cheap. It is worthwhile to buy now. Or as Warren Buffett once said: „Be greedy when others are fearfull.“
So today I opened up some positions. I am a long-term investor and I follow an approach that I would call QARP (quality at reasonable price). It is inspired by investors like David Dreman or Warren Buffett and the tools for screening for those stocks are here at Stockopedia. Dreman and Buffett are both pursuing an approach that makes sense to me. They are looking for good quality companies that are financially stable and for which they do not pay too much. In a correction as we are experiencing, in my opinion this strategy is ideal.
How about you? Are you in the process of rebuilding positions? Or do you still wait? Are you expecting a real bear market? Or do you believe it is “just” a correction and share prices will recover again soon?
Looking forward to hearing your opinion.
Disclaimer
This is not financial advice. Our content is intended to be used and must be used for information and education purposes only. Please read our disclaimer and terms and conditions to understand our obligations.
16 comments
Mark Minervini tweed this about an hour ago:
The NASDAQ managed to regain its 200-day moving average, but still only 37% of NASDAQ stocks are above their own 200-day lines and the Russell 2000 as well as the Value Line indexes are below their 200-day moving average lines.
This is what he is referring to.
Russell 2000:
Now contrast this with UK's FT100, FT250 and Aim All Shares Index.
FTSE100:
FTSE250:
Some work I have been doing of late is to look at % of UK companies above and below their 200 EMAs on a daily basis .
The data as of last night was 24.9% of all LSE quoted companies bar oil and natural resources companies. Contrast that with Nasdaq's 37% quoted by MM.
Unfortunately I do not have the 2008-09 data against which I could run my programs.
Food for thought.
I only have access to US data, but as of last night the % of stocks above their 200day moving averages for the key indicies were:
So on the surface, no red lights flashing from this participation data, apart from maybe the mid/small cap Russell-2000.
Low numbers are rare - in the past two decades for the S&P-500, only 5% of the time were there less than 25% of stocks above their 200day moving averages.
Things got extreme during the Great Financial Crisis of 2008/09 when on 68 days there were less than 5% of stocks in the S&P 500 trading above their 200day moving averages:
The returns from using this as a buy signal (& subsequently holding for 10 weeks) were no better than a coin flip, although positive out-turns were more than double negative out-turns:
So in conclusion, using the %>200d m.a. participation data is an objective contrarian signal, though not quite as effective as the CNN Fear & Greed Index (on the evidence from the past 20 years).
Similarly one could consider using the vix index. Readings are almost identical to Howard’s findings in that on average we get one extreme reading each year with the exception of bear markets.
Charts are S&P 500 with VIX index displayed in the indicator panel for the bear markets of 2000-2003 and 2007-2009.
It also captures the extremes as in 2008 when Lehman Brothers went bankrupt, Gromley also captured this in his finding when he quoted
We obviously don’t know if either the fear and greed index or vix would have behaved differently if it wasn’t for this extreme event,
How would you use the VIX as an objective trigger to raise exposure to Equities, Taff?
In 2002, buying Equities when the VIX rose above 40 would have got you in at close to the market bottom.
But using the same rule in 2008 (VIX>40) you'd have been buying US Equities in late September when the SPX was 1106. Ten weeks later it had fallen 18%. And it bottomed in March 2009 some 39% below this entry point.
More on the VIX,
http://www.cboe.com/vix/
http://www.cboe.com/institutio...
Mark Minervini keeps an eye on the Leading Economic Index (LEI) to assess whether a bear market is on the horizon, his hypothesis being that a downturn generally takes place 6 months after the LEI starts to dip.
While the LEI for the USA is in a firm upward trend, the index for the UK is not. You can view the UK's chart here: https://www.conference-board.o...
It's interesting to also compare the UK's LEI trend to that of the Euro Area, which can be selected on the left hand side of the above web page.
I'm 100% cash.
Here is my opinion.
The way that most people say we should use the Fear and Greed index is to buy at maximum fear and sell at maximum greed. This works because generally because prices are lower when buying at maximum fear, and higher when selling at maximum greed. But it isn't quite as simple as that. For example if the F&G index has very recently moved to extreme fear, but there hasn't yet been a crash, it could be a terrible time to buy. So for me the best time to buy is when all the following conditions are met:
1) F&G index is at maximum Fear
2) The share price you are looking at has fallen significantly
3) The share is now cheap or at least decent value according to your favourite ratio.
Personally I am currently still selling shares which satisfy the following criteria A) Well in profit B) Expensive / highly rated.
I would welcome all comments.
This is what Paul Krugman, Nobel laureate, eminent economist and columnist of the New York Times tweeted a few days back.
" For enquiring minds:
- Why did the market plunge? I have no idea
- Will it keep going down or bounce back? I have no idea.
- Is this going to translate into problems for the real economy? I have no idea.
- But what you need to know is: nobody else has any idea, either.
"
I am 100% in cash and have been over 80% in cash for a few months, and in no hurry to get back in. I think we are heading into a bear market and we are only at the start of one. The usual pattern is a series of sharp falls followed by more modest pullbacks. Today's 'bargain' becomes tomorrow's serious mistake. But like Krugman, what do I know? I am prepared to accept I could be very wrong.
Interesting article "Benjamin" . As i have written elsewhere I have taken a different stance on the problem by moving towards a market neutral position (long my "good stocks" balanced by short a broad portfolio of low SR stocks), but that doesn't mean I a have no interest in a good buying signal.
Buying when the Fear & Greed Index is low is very compelling. "Howard Marx" observed this last week in comments on the SCVR (comment 3) together with an interesting chart showing how this had done since 2009.
My frustration in trying to understand the signal here was that the timeline given was after the last crash.
CNN themselves give a morsel of additional comfort when they say "When the S&P 500 (SPX) plummeted to a three-year low on Sept. 17, 2008 - the height of the financial crisis -- the Fear and Greed index sank to 12. The index gained some ground to 28 before stocks finally bottomed out on March 9, 2009 and the latest bull market began."
That all sounds pretty reassuring!
Until that is you look at the numbers.
On 17-Sep-08 the S&P stood at 1,156 by the time of the eventual bottom 9-Mar-09 it had fallen to 676 a fall of 41%! It was 2010 before 1,156 was again surpassed!
So whilst the argument that one should buy when the market is fearful (because emotions tend to over-extend) is powerful. Sometimes however, when the market gets really fearful it still hasn't fully comprehended how bad things could get.
For my part I have felt that the market turbulence over the last few days has been but a minor tremor, which may or may not presage something much more significant.
I have though no skills in judging the direction of the market, so whilst I remain interested in market signals, I have chosen another path.
The good news is that in the long run being in the market still seems like the best option. So to have got out at a high and back in at **A** low is a good thing, regardless of where the market goes short term.
Imho - you have picked **A** good time to re-enter the market, but I have my doubts if it will prove to have been the best time.
Hi Gromley
My frustration in trying to understand the signal here was that the timeline given was after the last crash
Agreed, I went searching for exactly the same timeline and couldn't find the necessary historical data covering 2007 to 2009. Anyone have access to it?
The last decade's been a relatively stable time for markets, characterised by the ever-growing dependency on momentum strategies - so the fact that the F&G index has given consistent buying indicators over that period may simply be a facet of the market conditions. Looking at what it did during the financial crisis would be a better indicator of its reliability.
That said, there's evidence emerging of some stock prices moving into bargain territory and, anyway, bottom picking is for monkeys: if a crash happens most people will be too terrified to invest anyway, me included most likely. So anyone fortunate enough to be sitting on a large pile of cash at the moment might consider making a few selective investments, even given the downside risks around. British American Tobacco (LON:BATS) on a PE of 10.5 and a yield of 6.4%? Or H & T (LON:HAT) on 7.9 and 4.5%? Those numbers are discounting an awful lot of terrible news.
But when I look at the PE ratios of companies like Ab Dynamics (LON:ABDP) or accesso Technology (LON:ACSO) or Fevertree Drinks (LON:FEVR) or any of the other stockmarket darlings of the past few years they still make me feel dizzy. Great companies, but can they really justify those ratios on future earnings if those earnings are going to be harder to come by?
I've no idea, frankly. But I take some comfort in the fact that no one else does either ;-)
timarr
Great response, Gromley! I guess nobody knows when is the best time to get (back) in the market. But in the end it is not about timing the market, it ist about time in the market. So yes, a few shares came down to prices where they look interesting and are valued in a "fair" way. So I seize the opportunity. Maybe it was too early, maybe prices will go up just to come down in a few months and we'll end in a crash. Nobody knows right now. By the way, I am not fully invested right now. I still stored some ammunition. And I've also bought a fund-of-funds (ETF) with about 50% in bonds. So, that's for safequarding and sort of asset allocation.
I look at the CNN Fear & Greed Indicator's seven components & see that they highlight current investor sentiment & hence reveal the degree to which markets are short term overbought/sold.
The Indicator reveals nothing about market valuation nor likely longer term market direction. And on the occasions of bear markets, buying on a low CNN reading will obviously not necessarily yield great short term results.
So I use the CNN Indicator in the context of whether we are in a bull market (200 moving average rising) or a bear market (200 day moving average falling). In the latter, I proceed with more caution than the former.
The back-test I showed last week revealed that the CNN Indicator had hit a level of 5/100 just 12 times in the past 10 years:
Over the following 10 weeks, the S&P-500 rose 92% of the time with an average rise of 9.7% and just one loss of -2.8%:
Extending the timescale to 20 years introduces both the 2000-03 bear market as well as the Great Financial Crash of 2008. The CNN Indicator has hit a level of 5/100 on 37 occasions in the past 20 years:
Over the following 10 weeks, the S&P-500 rose 76% of the time with an average rise of 8.7% & an average loss of 4.6% on the 24% of the occasions it fell:
The 37 individual 10 week returns were as follows:
Excellent Howard,
Thanks for sharing that additional data.
So even though this approach 'bought' near the top of the slide in July/August 2007, the relatively short duration of the trade (10 weeks) kept it reasonably healthy.
A couple of other possibly interesting things to come out of the data there.
If you assume that you only hold one open position at a time (ie don't buy again if within the 10 weeks) rather than 37 instances there are only 12, but that still gives a similar performance :
75% winners average return slightly lower at 4.49% (average winner 7.85%, average loser -5.57%).
If though you waited for the second occurrence in any 10 week period (even if it is the very next day)
you would have 9 trades 8 of them winning (89%) and average gain of 7.39% (+8.62%/-2.42%).
That is probably taking back-testing a step too far to be honest, but it does give some indication of the power of this measure as a short term indicator.
I like the granularity of your analysis Gromley.
Re July/August 2007, the CNN Fear & Greed Indicator gave a number of pessimistic readings of sub 5/100 which wasn't suprising given that by then sub-prime issues were becoming evident at a number of Banks & wholesale money markets were drying up (which subsequently led to the collapse of Northern Rock in September 2007).
What is suprising in hindsight is that despite widespread investor pessimism, the S&P-500 didn't peak until mid October 2007. So the 10 week returns generated from using the CNN indicator in the summer of 2007 were still healthy.
I see four drivers.
1. It's October and these things happen in October.
2. The US market has been supported by buy backs. Most companies have paused them in a closed period before announcing third quarter earnings. They will restart afterwards.
3. US interest rates edging above 3% are triggering a move out of growth and towards value. The cycle is turning.
4. Brexit.
The first two will pass. The interest rate changes are a big cyclical change for me. Growth At Any Price will be off the menu. Heaven knows about Brexit.
Then there's the US mid term elections in early November.
I'm a momentum fan, so I'm waiting until mid November to see if the party has restarted before joining in.
1.Brexit
2 Fed hate rikes
3. Trump/China trade war - the repurcussions of this is yet to hit many supporting countries, and the full extent wont be realised just yet but I believe it will be huge and impact economic growth.
4. Bond yields are rising which will take investors away from stock.
5. If Tech continues to stumble, some investors are concerned that other sectors will fail to pick up the slack in any market rotation.
For the above there are just to many issues to influence a bear market, ive actually lost most my gains made this year. ive taken the hit and moved to cash, while I rethink my plan. But I know I don't want to be in equities amidst all the above issues, just to much potential downturn issues to make the market drop more in my view, so im sitting on the sides for moment.
Im not buying any dips to be dipped on again, unless the economic macros views strengthen for the better