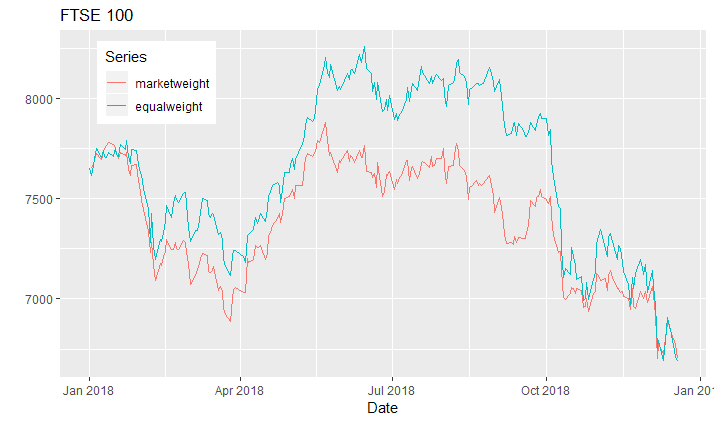
There’s just no getting around it - British stock markets have performed dismally in 2018. The black clouds of Brexit and political incompetence have hammered the indices with the FTSE All Share down more than 12% year to date at the time of writing. But there is one bright note. Savvy private investors have been beating the market handsomely.
Last year in 2017 we sent out a Performance Survey to all Stockopedia Subscribers in which subscribers reported a strong outperformance versus the indices. But there was a tailwind last year - rising stock markets, and significant strength for high StockRank shares. This year, it’s been much tougher going with more moderate StockRank outperformance and a falling market. So tough that we even considered not polling subscribers on their performance. But we deftly sidestepped that possible act of cowardice and are glad to report some really excellent results from a survey of more than 1,220 subscribers.
Since subscribing to Stockopedia has your performance outperformed, matched or underperformed the market?
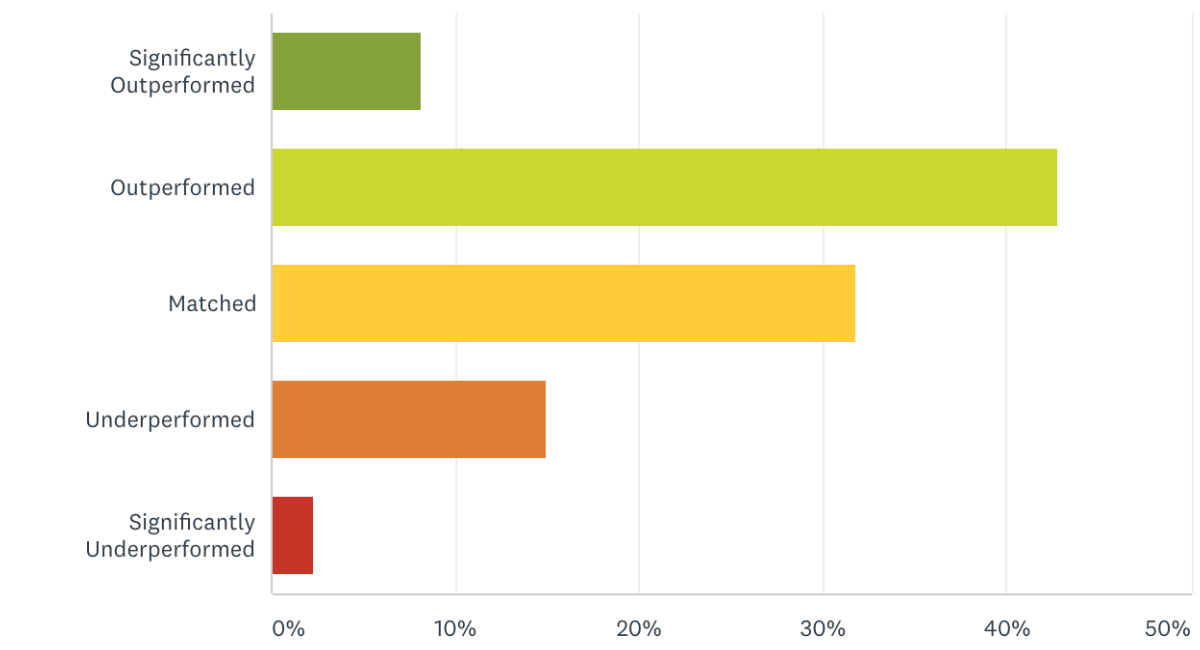
This was the same question as asked in 2017 when only 6% of subscribers reported underperforming the market since subscribing. A significant new cohort of subscribers joined in 2018 during falling markets, so there’s no surprise that those numbers are up, but it’s clear the majority of subscribers are still well ahead of the benchmarks.
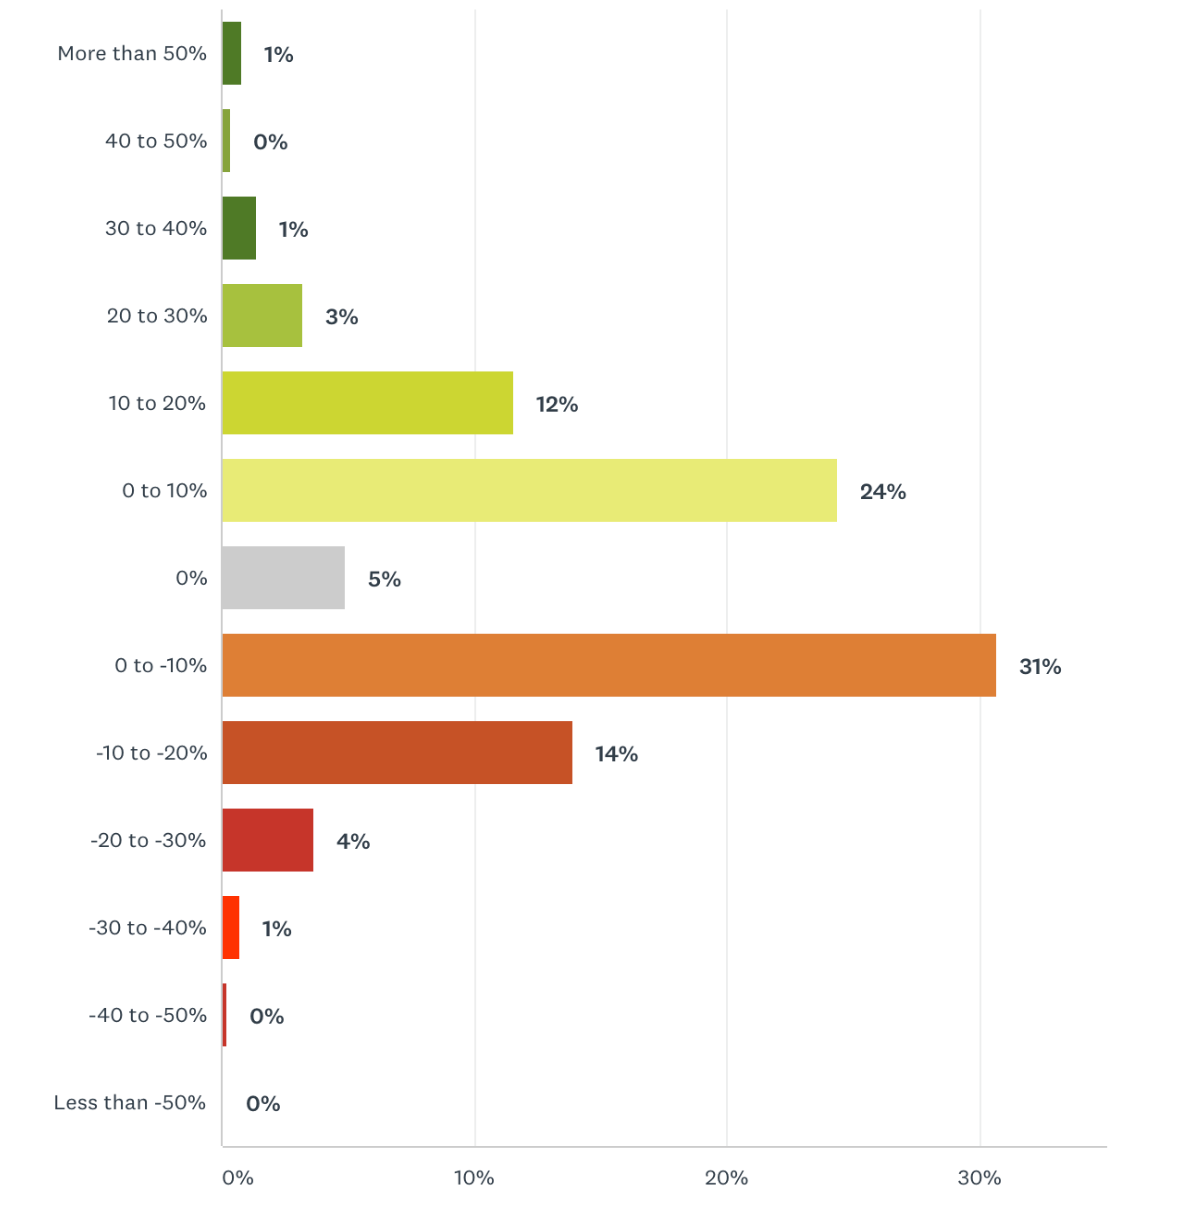
What has your 2018 performance been as a percentage year to date?
In spite of the common StockRank & Ratings systems published on the Stockopedia website, subscribers have wildly diverging portfolios and styles. So whenever we ask this question, we discover a wide variability in the distribution of returns. As you can see below the range of outcomes has been anywhere between -50% and +50%. The outliers have most likely being in highly concentrated portfolios, with more diversified portfolios clustering between -20% and +20%.
But what is most startling is the level of average outperformance versus the market averages. This survey has been open for 2 weeks during which time we’ve seen some big swings in the market. The FTSE All Share (the broadest UK market index ) has been down for the year between -8% and -12% over this period. So to create the next chart we calculated the weighted average FTSE All Share performance based…