Stockopedia Subscriber Performance Survey 2017

On Friday I asked Stockopedia subscribers a set of questions about their stock market performance in 2017. We’ve had a great response so far with 1,168 respondents and more coming in every hour. If you missed the invite, please do check your email inbox and submit your answers. We’ll be keeping the survey open for the next few days, but the results have stabilised and we have a great sample, so I’ve decided to publish the results.
The insights from the survey are exciting and fascinating in equal measure - here goes.
Since subscribing to Stockopedia has your performance outperformed, matched or underperformed the market?
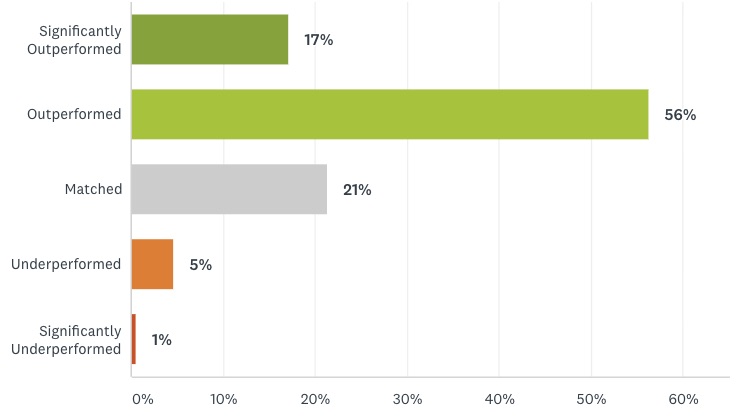
Many subscribers have been with us since 2012 so we started the survey with a more general question about longer term performance. Almost three quarters of subscribers have been outperforming the market since subscribing, and only 6% underperforming.
Those who have been underperforming may be able to learn from the outperformers - so I hope they'll share their secrets. I’ll be following up to ask how the best performers have been achieving their results.
What has your 2017 performance been as a percentage year to date?
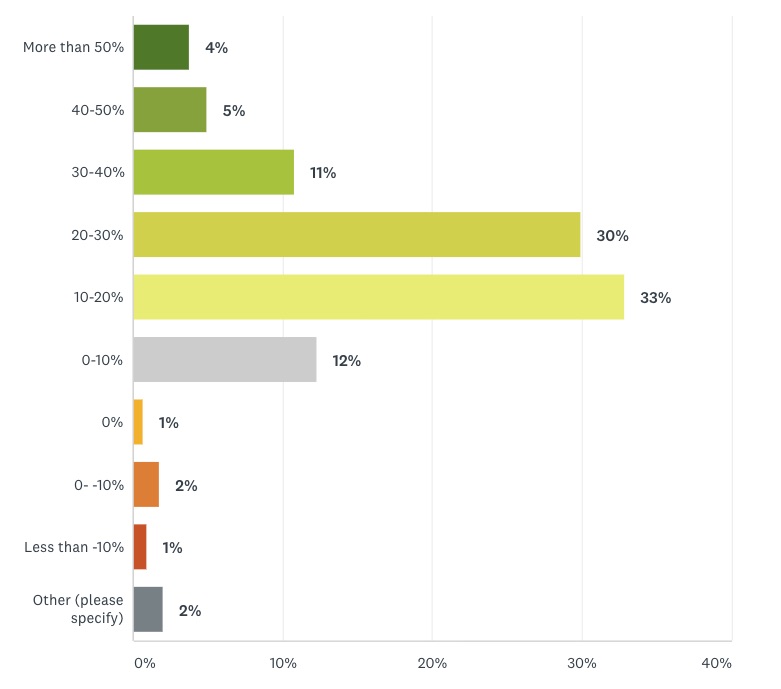
As you can see, it’s been a great result for the majority of subscribers. My estimate is an average 21.5% return year to date. 43 respondents managed far more than 50% returns year to date. I know of one subscriber who has returned 252% year to date and many of this elite group have done exceptionally well with over 100% returns…. so the real average may be significantly above 21.5% returns. There’s clearly a ‘fat tail’ of super-users who are dramatically outperforming the market - through better process or great fortune. I will find out more.
Most of our subscribers are UK based so let’s compare the UK benchmarks with this performance. The FTSE 100 is up 3.8%, the broader FTSE All Share is up 5.2% and the FTSE Small Cap index is up 8.5%. So the community has significantly outperformed the market. This very much backs up my belief that it’s better for investors to take matters in their own hands and invest directly in share ownership rather than buying funds.
The only UK index that is a patch on the subscriber results is the FTSE Aim All Share index up about 19.7% year to date. But while many subscribers do invest heavily on the AIM index, my last analysis showed that the biggest holdings in subscriber portfolios tend to be blue chip stocks. Of the 10 most traded stocks across the community 6 are FTSE 100 names. So the broader market indexes may be a better measure of comparison.
Regardless , the AIM All Share has been driven by many of the larger, high ranking, winning style shares the Stockopedia community and systems have highlighted over they year - including Fevertree, Abcam, Boohoo, RWS, IQE, Dart and more. Well done everyone who invested in these names.
Which Stockopedia features have most helped to improve your results?

The standout feature on the site has been the StockRanks with 73% of subscribers saying they were a strong influence on their market beating success.
The average year to date return of 90+ ranked shares is 18.8%. So the community have managed to beat our own custom StockRank index. Ultimately the StockRanks have been designed to pick out the factors that historically have led to market beating returns. While the future may rhyme, there is no guarantee that they will continue being effective. They’ve had a good run and there could of course be a reversal in fortune at any time.

But what a year for the Small Cap Value Report. Paul Scott and Graham Neary have been absolutely smashing it with their daily reports… highlighting a sequence of winners for subscribers. They are a prolific team and have clearly been having a big impact - I have heard we’ll be publishing a few videos in the next week where these small cap legends share some insights on camera.
This year we launched the StockRanks Styles and the RiskRatings and they’ve already integrated themselves into subscriber workflows. The Styles are now rated as more effective than the entire GuruScreens & Custom Screening system for picking winners which is quite remarkable. I’m really proud of the work that went into these features in 2017. Thanks for giving them a big thumbs up… I can promise even better things for 2018.
What has been your biggest winner year to date?
There were a range of shares picked out by the community. I will focus on the most popular three big wins mentioned by the most subscribers:
- IQE - (130 mentions) - one of my New Year NAPS, and also heavily mentioned by Paul Scott… this has had an unbelievable run year to date, almost quadrupling.
- Games Workshop - (61 mentions) - another NAPS stock - it has tripled year to date.
- XL Media - (41 mentions) - well highlighted by the community, StockRanks, Roland Head and Paul Scott - more than doubled year to date.
Honourable mentions go to Burford Capital, Bioventix and Ferrexpo which were also widely held big winners.
It’s not as if everyone is crowding in the same names. There’s a wide range of different winners mentioned - dozens and dozens of UK and international stocks. Subscribers are using the tools and resources available to them and finding their own winners from multiple sources. Some are readers, some are screeners, some analyse reports… it’s a pleasure to witness the collective industriousness that’s going on.
What could we add to the Stockopedia service that would most help your performance?

I put a little list of feature requests into the survey. Surprisingly, the most requested feature was Buy, Hold and Sell Recommendations. Given we’re a DIY site, I thought that that this might be ignored… but it’s clear a lot of investors do have trouble with knowing ‘when to sell’. As many will know I tend to favour systematic sell rules and there's value we can add here in future.
This selling worry was backed up by the next question that asked What is the biggest problem or concern you have with your investing?. 161 respondents mentioned “when to sell” as their biggest worry with 148 worried about the state of the market and a possible correction.
Stop Losses and Risk Management were key concern areas too… big focuses of our current development. I’m just hoping we ship these features before the next market break… we may not have time, so be careful out there.
Do you feel more or less confident in your understanding of the stock market since using Stockopedia?

This result is what I’m most proud of about the work we’ve done to date. 80% of subscribers are feeling more confident in their understanding of the stock market since using the site. It’s a story I hear again and again… the service helps to remove the uncertainty and aids decisiveness on shares.
I hope though that it doesn’t breed overconfidence. Overconfidence is a dangerous trait in the stock market and can leave investors over-exposed right at the wrong moment. So I will leave you with the wise words of Jesse Livermore.
The stock market is never obvious. It is designed to fool most of the people most of the time.
I’d love to hear your thoughts on this survey in the comments below - thanks to everyone who has participated. Many of you have said we can follow up and find out more personally. I doubt we’ll be able to contact everyone, but I’ll try and make sure we get back in touch on this in the New Year.
As ever - Safe Investing !
Disclaimer
This is not financial advice. Our content is intended to be used and must be used for information and education purposes only. Please read our disclaimer and terms and conditions to understand our obligations.
61 comments
I'd just like to get everything in general terms on one platform - or at least as much as possible.
Stockopedia is my chosen platform - end of - but there are some, I presume easy things, you could do to help me.
1) Understand totally you don't do unit trusts and I don't want you to, but it would be helpful if there was a way to manually enter these onto my portfolio - I'll do the work.
2) You provide stock prices at a 15 min delay - all I need - but could you do something similar, even if somewhat more delayed if a cost issue, on a minor range of commodities (Oil, Gas , Copper, Zinc, Lead, Gold.....) - like many here I suspect, although oil and resources are not high priority, most of us have them (probably 'cos we can't resist).
Phil
Please would you provide information about the Net Asset Values (NAV) and Discounts to NAV of investment trusts. I understand that Reuters already provide you with that information, so it should not be difficult for you to display that.
Hey I am in Australia,
It would be great to have some commentary/ stock reports for OZ.
Great software but feel as though its a UK model that's been rolled out to the rest of the world.
A forum for OZ would also be great to liaise with other oz members.
Cheers
I am new to investing and have so much to learn. Wonderful site and service. A1.
I've already replied on this and asked for coverage of Investment Trusts and all I got in reply was pure rubbish and didn't address the topic at all! Shame on you
If there is any one thing that Stockopedia has given to me above all others, then it is confidence in my investing approach, and the ability to take complete control of my SIPP and ISA. No longer am I destined to underperform based upon poor share tips, or my own personal (poor) analysis of the company finances and prospects. Being a mathematician/statistician, I love the data analyses that Ed and the team have developed around the Stock Ranks and to a certain extent this provides a base platform for me to apply my own twist over and above this. So whilst I look at the Stock Ranks, I will not simply buy the top twenty or so, and will apply a whole list of other criteria before focussing in on a stock. I have also developed my own rudimentary approach to try and time my buys and sells, and I think the results adhere pretty closely to the 80/20 rule with 80% being reasonably well timed and assessed. Given that ratio, and in also limiting the losses of the 20% losers, I have managed to improve my performance considerably and am a very happy subscriber. Indeed, given the increase in risk and possible over valuation of the UK stock market in late 2017, I have recently extended my subscription to Europe, and this too is starting to show some early successes too, most notably with £LHA £DBAN £1COV.
(Note sure why but the £ prefix is not working for me: basically, Lufthansa, Deutsche Beteiligungs and Covestro.)
Longer term, I would really benefit further from the inclusion with the screening tools of a variety of technical indicators, and this would ease the pain and efforts involved in timing buys/sells considerably, especially if this could be linked to an alert so that I can mail myself accordingly.
Anyway, for 2018, I am pretty sure I will extend my involvement outside of the UK to reduce my local market risk, and given a fair wind, I am reasonably optimistic of decent returns even if I do not possess a looking glass to assess the economic future and directions of world markets.
TT
£ will only work for UK listed shares IQE (LON:IQE), don't think there is a Euro equivalent or USA.
Hi TT
Nice write up. Good for you.
I think extending into Europe stocks will be a useful step for 2018 (and beyond).
With regard to your comment about alerts (copied from your post).
'Longer term, I would really benefit further from the inclusion with the screening tools of a variety of technical indicators, and this would ease the pain and efforts involved in timing buys/sells considerably, especially if this could be linked to an alert so that I can mail myself accordingly.'
Are you aware of the Alerts facility under the Folios option. It's at the end of the Folios drop down. You can create an alert for any metric within the Stockopedia database. The function is still quite basic but with a thoughtful approach to using it it can be very effective. As an alert triggers Stockopedia emails you. I use it to good effect to assist with spotting falling shares.It can be used to spot rising shares as well, or any other movement of a metric of interest.
Regards
Howard
Thanks Howard.
I must declare that I used these alerts some time back, but they always failed to mail correctly, although i think this was down to my unusual mail address at the time with two '.' characters before the @. So I changed it, and now it does work, albeit that I had largely forgotten about this tool. Thanks for the reminder!
Overall however, what I would like to see included is the content you find in 'Tools > Chart Signals'. I find when combining some of these, such as Golden Cross, MACD Zero Line Crossover and so on with a decent stock rank, and as long as other content aligns with my specific requirements, then this can be a very good indicator for strong upward movement in several cases. Doesn't work every time, but I used this approach and found Morgan Sindall (LON:MGNS) and Ferrexpo (LON:FXPO), and I think I also used this approach to pick up on IQE (LON:IQE) when it was < 30p in 2016.
Best Regards, TT
My 50ps worth. You can provide what you want about buy sell etc..I never use it and never will, its a con.(Again my opinion based on a number of super gurus and data to back it up)
Read David Dreman contrarian investing theres a whole section on brokers ratings with data to back it up.. why do very few brokers rate a SELL , because its employment suicide.. brokers are in bed with the conpanies that pay them..Data doesnt lie and that book is one of the best I have read so far covers so much. Written by ex an trader
https://www.amazon.com/Contrarian-Investment-Strategies-Next-Generation/dp/B00P3GTR6O
Pg102 chapter 5 "The expert way to lose your savings"
Pg 96
"Rule 5"
"There are no highly predictable industries in which you can count on analysts forecasts. Relying on these estimates will lead to trouble"
Pg 94
1973-1996
Percentage (plus or minus) by which analysts hit actual earnings
+ or - 5% by which analysts hit actual earnings
29.4 of analysts
+ or - 10% by which analysts hit actual earnings
46.8 of analysts
+ or - 15% by which analysts hit actual earnings
58.3% of analysts
This then goes a level deeper based on industry..with metals and mining have the higest error of 71%
With tobbaco the best of 4%
An excellent book , as are the rest of the guru books listed on stocko
I will never be an expert but Im losing less money now :)
Actually on the buy/hold/sell recommendation front I can see this being a useful service _if_ the trigger points are based on hard data. For example the StockRanks and other measures are fantastic for selecting decent shares which are statistically likely to do well. However they're no good for timing purchases and sales (and not particularly useful for finding shares which are heading towards being highly ranked but haven't made it just yet).
So if a system similar to the one that generates the ranks could be devised for identifying buy/sell points that work overall for groups of shares that would be useful. I think that the kick-back against this suggestion comes from the discredited notion of individuals giving buy/sell/hold recommendations on little more than gut feel.
Damian
I was one of the subscribers that did less than average. I started using the service in June, therefore results are for 6 months. I am in the U.S.
Please do NOT start providing Buy Hold Sell recommendations, because I use the service to determine this.
This is further complicated by people like me who have shorts portfolios, where a loss is actually a gain. My guess is that most people who are shorting are doing so on large cap stocks (very risky with small caps) so some of the large caps holdings in the pie chart on post #20 may actually be shorts.
Many of us , me included, have test portfolios on Stocko in addition to our real holdings. I would be prepared to mark my test portfolios as theoretical and my real portfolio as such if it would help Ed's team with their statistics.
Well done Mr Croft and his staff is what I say.
I have subscribed to Stockopdedia (Sped) for 2 years but only really used it in 2017, when it has returned me 16% to date, which is more than the previous 3 years combined. That's because I have more time this year.
I have been improving as I go along especially with stop losses, so expect better next year - market conditions allowing, bien sur.
Sped stock ranks take away much of the graft of working out what are good and what are duff companies. The self tailorable reports are invaluable. I hold 8 stocks at the moment with an average Sped rank of 93 (from 83 to 99) Then the charts give me the chance to work out when to buy (volume/technical analysis, etc)
Sped also gives me confidence to go into areas I'm not familiar with. That is to say, although all my stocks are all mid caps (average market cap about 250 million), a year ago I had not heard of any of them, except maybe Forterra (ex Hanson Brick). But, with Sped taking away the drudgery I can look at, for example XLM or Griffin, research them and find what fantastic companies they are
Thanks lads!!! Have a great Christmas, you deserve it.
Alan
Hi Alan. You have me puzzling over your reference to "self tailorable reports"! Have I missed something? Where are they?
Hello 3rd Man. There's so much in Stockopedia that it's easy to miss stuff. See the options/tab 'screens', then sub option 'create a screen; then build one with the fields supplied, for example enterprise between 100mil and 300 mill with a rank of > 95. Or from one of the 'guru screens' under the same option, copy the screen ('fork') and then play with it. Alan
@thirdman - we will be introducing editable StockReports in the new version of the site. It won't be available right from the start, but we've designed it with this feature in mind. So you'll be able to pick and choose your ratios/metrics to view.
Also age and gender if your allowed to show that
Can you map into your charts the age of time stockopedia users have been with you?
The graphs are okay but could offer more info
So for example a subscriber who has been with stocko since 2012 has made more from stockreports than a person who has been 1 year who has made more from pauls blog..etc,etc.etc
This may give some insight to the thinking /use of stockopedia long term users v short term?
Even better people who comment on the boards in here and age of time with stockpedia versus non comments and age of stockopedia, from your survey you should have the data
You could show interesting trends
Also:
1 Anyone who needs buy/sell recommendations should probably think about their own investment process for a while longer before picking stocks.
2 There ARE publications which offer such recommendations. As a handful of journalists seem obliged to offer an opinion on every stock they review, I would suggest their recommendations are much less useful than what is found here.
Excellent article
Great survey Ed, and the results reflect the great value we get from Stockopedia. I've subscribed since 2012 and of all the services I pay for, this is the one that I feel I get the most value from and am happy to continue paying for. The introduction of the StockRank Styles was a great innovation and my first step after understanding that feature was to immediately sell anything in my portfolio that was red!
Having worked in the City for nearly 30 years, I'd implore you not to introduce Buy/Sell/Hold recommendations. I feel it would devalue the service, which I see as providing subscribers with the information necessary to make up their own minds.
However, I do agree with any features that would help us make the decison that it's time to sell a stock. I think many often struggle with the thought "Is this a pullback, or is this a sustained move to the downside?". I try and implement Minervini's principles, and I've used Alexander Elder's "Safe Stops". Even then it's a very difficult decision to make, especially if the stock has given you a big return in a short timeframe. Your natural instinct is to hold. I've probably lost a good 10-20% return because of not acting correctly around this point in a stock price move.
Keep up the great work!
I couldn't agree more... and thanks for the good advice. It aligns closely with my own thinking on the subject.
Another problem with systematically giving buy, hold and sell recommendations is that I believe it would require you to be an authorised adviser, registered with FCA The resulting limitation in the range of services offered by Stockopedia, not to mention the staff's well-being generally,this would be as desirable as "a hole in the head"!
Totally agree - stick to supplying tools for us to use as we see fit. There are enough tip sheets about already for anyone who feels they need them.
dear sir plese add portfolo of long term small cap, midcap and large cap high growth value stocks --aggresive investors , most important to suggests companies come from loss to profit which are undervalued ---can give huge returns . stocks buy and hold with stocks tgt with consideration with dcf --graham --waiting eagerly this is the most important feature lacking in this website and research is high quality . regards shrirang
I totally agree.
All, having been a private investor for years with a lot of experience trying to find the tools to improve and a few good kickings to prove it, I absolutely agree. It makes us lazy and gives us an excuse to blame someone else.
Best, Tony
Now that Google Finance has dropped their portfolio support, it would be really useful to be allowed to have more than ten portfolios on Stocko. There does not seem to be a limit on custom screens so I am not sure why the portfolio limit is seemingly so stringy.
"There's a lot of sensible investing going on. So, the IMA Smaller Companies index is not the right benchmark. The right benchmark isn't so far from the FTSE All Share."
That seems to contradict some of your articles about small companies outperforming large ones? Also NAPS is mainly small to mid cap companies. FTSE has gone up about 1% a year over last 10 years FTSE250 about 8% pa, FTSE Allshare about 1.5% pa. Really betting the Allshare is not that great. Are the best performers ie > 50% investing in mainly large caps? Best performing NAP shares 2017 have been IQE (LON:IQE) and Games Workshop (LON:GAW).
As for portfolios on here, mine are nothing like my real portfolio so I'm sure how meaningful that is.
I think there has been a move out of small caps into large caps recently, that does not mean that was the case earlier this year.
Herbie...
I'm not sure what the existence of the small cap anomaly has to the choice of correct benchmark to compare against subscriber results?
OK maybe I quoted the wrong part, but it was about most people here investing in large caps and being sensible. But you have frequently have written about small caps outperforming large caps, I remember phases like elephants don't run. The contradiction is you say invest in small caps for better performance but then if you buy large caps you are sensible. Be interesting to know what the best performers are investing in. I know some are more invested in small caps, such as Paul Scott.
Let me be clear, I never tell anyone what to do with their money. I just research and study what has worked historically, and then guide the design of the site to reflect these empirical facts. The future might be completely different to the past.... just because something worked in the past doesn't mean it should again.
It was Jim Slater who said 'Elephants don't gallop'. Small caps have outperformed in the UK, but in the US large caps have. It depends on the market. One has to be smart about markets, and one has to realise that mean-reversion is an ever present danger. If you've done well in small caps or large caps it doesn't mean you should invest pro-cyclically and only invest in that segment. Diversification is the only free lunch in investing.
The 'sensible' comment relates to the general behaviour of the community being rather different to what many believe. They aren't just 100% loaded on small & micro caps. Given the liquidity issues of small/microcaps in any bear market, it's sensible not to be 100% exposed to them. It's good to see the community being smart. (on average)
But they are still overweight in small caps - If you look at the pie chart, you can see that more subscribers have actually been buying small caps than large caps. I haven't anywhere suggested otherwise.
OK I probably misunderstood about what you were inplying about small caps. As for US markets are we talking just about UK shares here or are you including foreign shares in these figures?
Interesting survey & article, 'tho I share some of the reservations voiced by others in this discussion. It would be good to repeat the exercise after a bad year in the markets.
BMUS has done about 67% this year - which seems very high to me. So very unlikely to repeat!
Pretty good,
Happy Xmas :-) PP.
Paul, 67% is obviously a great result, but what would you consider to be a 'good' result? Do you have a minimum threshold in mind that would make you happy (eg. "If I achieve at least X% this year, I'm happy")? And if so, how did you come up with that number?
A little flawed as a scientific study but rather good for marketing the site I suspect - and why not, it is a brilliant site after all :)
Actually I would not be surprised if the average subscriber does outperform the market. I am definitely not smart enough to get 100% plus returns so its easier for me to avoid doing anything too dumb than it is for me to do anything really clever. Stockopedia has greatly reduced my ability to be stupid and correspondingly increased my financial well being!!
As a starting point aggregating all portfolios across a collection of investors should get to a random selection and therefore average performance. But that would include a lot of investment decisions which for various reasons are objectively bad. If one makes the assumption that access to better data, a better understanding of accounts (I've certainly got that from Paul Scott), better awareness of behavioural bias etc. etc. mean that subscribers weed out a significant number of duff decisions then outperformance on average is a given.
As for whoever achieved a 252% return - thank you for the gift of humility!
Thanks Ed for an interesting survey and article.
"Of the 10 most traded stocks across the community 6 are FTSE 100 names."
How do you know what is traded?
Burford Capital (LON:BUR) is a curious one, I'm a long term holder, I did not put it down on the survey because I bought it before I joined Stockopedia and it's not been rated highly on StockRanks usually in the 50s and low 60s, despite high growth. I suppose most people have picked it up from other members posts rather than Stock Ranks.
Re: Buy, Hold and Sell I'm really not in favour of that, that for me is getting too close to a tip sheet and could impact share prices.
I believe it will be based on the Folios stored on the site. Ed has previously acknowledged that a lot of these may not be real portfolios but had some method of weeding out to get to likely set that were probably real.
Good article and well done your team but however many times I ask for Investment trusts to be covered, nothing ever happens. I hold IT`s which have risen 30 -4o% this year and my IT portfolio has risen 19.7% which is comparable to my shares portfolio which has risen 21-5%. If you are going to do nothing about IT`s then for goodness sake say so!
Tony Drew
Seconded! ITs are particularly good for diversifying through a foreign theme, e.g. India, where researching small amounts of individual stocks is not a good use of time. And comparable discount/premium to NAV through the universe would be a great extra line. WHEN the downturn comes and anxiety is high, putting cash into discounted ITs virtually guarantees outperformance over the following two years, I believe.
Ed,
I will happily be a beta tester! Ian
Thanks for the article. I really don't think buy or hold recommendations would add anything - but some sort of indicator that flashes "SELL" when a previous well performing stock starts to deteriorate might be useful. An example might be Quarto, which had a stock rank of 98 December 2016 and had had a great run but which then ran into trouble.
Maybe this is too hard. But it would be great if stockopedia boffins could have a go trying to identify when it's time to sell.
Ed
Very interesting article! Please could you tell us a little more about the features that people requested that you add to the site? The most requested category was "Other" Is there a breakdown of what was most requested in "other" ?
How are you going to react to the survey in terms of actually making some of the requested improvements?
New app timeline... undisclosed... but beta aimed for Q1.
Hi Ed,
In regard to stop losses, this would be great, just a thought though... would you be able to retrospectively plot a given stock loss method/% into the stock rank performance charts?
Thanks
Gary
Great survey, there might be as one reader suggests some" haven't I done well biase" but still interesting to see the results. I had , 5th December 2016 a pension portfolio of £1.125m today it's £1.7m . Down to me alone, no way, A combination of a lot of reading and reasearch, and thinking, input from paul graham and importantly, I should mention, other users. Of the six stocks you mention, I have and do hold five. But also importantly, I think. I have exited some other old favourites, boohoo? For instance. Could I have achieved what I have so far without you guys, in a word, NO!
It's interesting, but without knowing the size of portfolio involved it's hard to draw meaningful conclusions.
Someone nailing a 200% rise on a £10 million portfolio is probably pretty smart, someone doing the same on a £20K portfolio is simply a rounding error. Even that isn't conclusive, because if the £10 million is only 10% of a bigger diversified portfolio it changes the risk / reward ratio - but at least it gives an idea.
timarr
timarr raises an interesting point about percentage gains. One of the things I noticed when I was doing the survey was that my financial gain hasn't been so different this year (a little less, but not worryingly so) than usual, but actually in percentage terms it is far less than when I started out.
I realised that my investment approach hasn't moved as my portfolio has moved. I'm still buying in the same sized chunks as I was when I started out. As a result I find myself owning more stocks. But the really big winners have always been a small subset. So it looks like the big winners are finding it more and more difficult to move the needle.
It has been a useful survey to do as it made me have a look at a few things in my approach. I originally started my investing (pre Stockopedia) with some big cap dividend payers which I intended to buy and hold. I've then added a portfolio built up using Stockopedia alongside this. My biggest winner from my Stockopedia portfolio this year Serica Energy (LON:SQZ) has gained more than the total amount of dividends I've been paid across all stocks since I started managing my money myself in 2012.
So my Christmas break will be spent looking at my existing approach and bringing it up to date.
Hi Ed,
What would be great is some video's of these top traders as to how they use Stocko to research stuff even a 10-15 minute video of how they screen would be great.
Ed,
Good to see such excellent average results. I don't know what % of Fund managers have averaged a 21% gain this year, but if this percentage is correct then the average Stocko respondent is part of an very special investing group who are applying the Stocko metrics and discussion forum to stunning effect.
There is one index that has done fantastically well in the last 12 months and that is the AIM 100 which is up from 3940 to 5225 (+32%). There have been some dramatic gains from some of these AIM 100 companies including IQE (LON:IQE), XLMedia (LON:XLM) and Burford Capital (LON:BUR), which get a special mention above.
Congrats to you and your team on a great investment product and service. Ian
The "UK smaller companies" sector is in that ballpark on Morningstar (median YTD return about 24%). It's probably the right comparable for Stocko-style investors -- even if Ed sees some interest in some FTSE100 stocks, it seems improbable that typical subscribers have a portfolio that looks anything like a cap-weighted index.
Moreover doing arithmetically-correct performance attribution is tricky, and tools for it are not very common, so given a little bit of overconfidence bias, quite a few people probably overestimate they real (out-)performance.
I do not know where Morningstar get their figures but, for balance, the FTSE Small Cap ex Investment Trusts is showing a capital return of 8.93% in the YTD, and a total return of 11.88%.
It's indeed a bit surprising.
I've "calculated" the median by poking in the middle of the list ordered by YTD return of the IMA sector "UK Smaller Companies". The IMA website defines this as "Funds which invest at least 80% of their assets in UK equities of companies which form the bottom 10% by market capitalisation."
I have looked at the FTSE index constituents: once you trim the ITs there's fewer than 200 stocks, among them fallen mid caps that have dropped off the FTSE250. Can't see any of the recent small (or mid) cap big hitters on the list. So all the small cap action was all on AIM this year, for some reason. Few people (fund managers or otherwise) would use that weird and lately particularly sedate FTSE index as their investment universe so it's consistent that the average "small cap" fund beats it.
@cig - I think your benchmark is quite far from the reality of this community's behaviour.
The community may discuss small and micro caps an enormous amount, but this is at the speculative end of their portfolios. You can't presume that people actually invest all their money in the things they talk the most about.
To prove my point here is the size-group distribution of purchased stocks in the last 3 months across all portfolios. As you can see, more than 60% of purchases have been in mid and large caps. The least purchased segment of the market is actually in the sub £50m micro-cap space.
There's a lot of sensible investing going on.So, the IMA Smaller Companies index is not the right benchmark. The right benchmark isn't so far from the FTSE All Share.
It does embolden my belief that the community here are actually a pretty smart set of investors.
I'm not sure the FTSE All Share is a good benchmark to use here. As a cap-weighted index, the FTSE 100 (which is broadly similar to Large Caps in the pie chart in post #20) represents around 80% of the FTSE All Share by capital value and hence around 80% of the FTSE All Share return. Basically large caps (FTSE 100 stocks) drive the FTSE All Share return. Assuming the 3 month purchase data of the community used for the pie chart represent the community's portfolios (big assumption I know!), we have a much higher amount in stocks that aren't large caps (around 70% of portfolios vs the 20% in the FTSE All Share index).
A return based on an equally-weighted FTSE All Share index might be a better benchmark. Or if the community portfolio has vaguely a third each in large, mid and small caps (as suggested by the pie chart) then a composite benchmark comprised of a third of the returns of each of the FTSE 100 (large caps), FTSE 250 (mid caps) and FTSE SmallCap could work too. This adds further complication to the process though, I use the FTSE 250 as a simple but far from perfect compromise.
Non-UK stocks complicate things too but let's not go there.....
So, the IMA Smaller Companies index is not the right benchmark. The right benchmark isn't so far from the FTSE All Share.
It does embolden my belief that the community here are actually a pretty smart set of investors.
So why not create your own index/indices, it might be a good marketing wheeze !
Congratulations on what you've achieved and a happy Christmas to you all.
Surely those who have done well are far more likely to respond to such a survey.
Agreed, can't see many people who under performed wanting to put their hand up or go into the detail of it...