In the last article we looked at how to determine whether markets were trending or ranging. In Part 13, we look at a very interesting method used to calculate support and resistance and capture the behaviour and psychology in any given market: Fibonacci. Fibonacci has become an extremely popular tool amongst technical analysts.
The Fibonacci tool on your charts, is one of the best bits of kit for predicting support and resistance levels and price targets. It works across all markets, but in my experience, it works better on the longer-term charts e.g. 4hr, 1 day, 1 week. (Anything less than 4hrs and I like to use Pivots.)
What is Fibonacci?
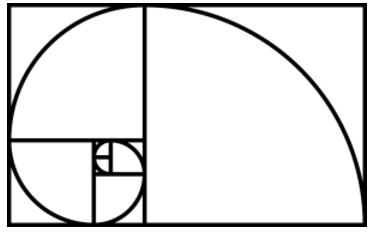
Fibonacci was a 13th century Italian mathematician and accountant. You may be familiar with his number sequence from your maths lessons: e.g. 1,1,2,3,5,8,13,21. As you progress through the sequence, the ratio of each number to its preceding number approaches closer and closer to what is known as the golden ratio: approximately 1.618. Each number is also approximately 0.618 of its successor. This reciprocal number is known as ? (phi).
In the non-financial world, the Fibonacci sequence is employed in all manner of fields; from architecture through to physics and engineering. In nature, as well, we can see Fibonacci patterns at work. Some would argue that Fibonacci's sequence and methods were nothing new even back in the 13th century. It is thought the Egyptians designed and built their pyramids based on similar mathematical laws.
Fibonacci's concept, when translated to trading and investing, has to some extent become a self-fulfilling prophecy. In trading terms it works, because it is based on the behaviour of groups following patterns and lends itself perfectly to the analysis of financial markets. The concept is saying to the analyst that price retraces by a certain given amount and these amounts are governed by the Fibonacci sequence. What makes it so effective, is that the Fibonacci tool generates movements in advance that you can anticipate.
Creating Fibonacci lines
Fibonacci lines are placed on top of the price.
To set these lines, you need to look for a high and low and connect them (this is a pure discretionary process, but in most cases, it is obvious).
The points you select depend on your trading time period. I like to break a chart into 3 Fibonacci sections based on the rules of technical analysis. So,…