We’ve finally come to the last article in our 25 part technical analysis series. I hope you’ve enjoyed it and found it beneficial? In the previous article, we looked at applying technical analysis to Risk & Trade management. There is still though another great, not so obvious, use for technical analysis that we need to look at before wrapping up this series. Another part of the trading and investing jigsaw to piece together! I hope by now, you’re starting to see that technical analysis is not a one dimensional tool. Applying and using the basic inputs to your technical analysis in a simple quantitative/qualitative process, can go a long way to improving your results.
By introducing technical analysis into your trading and investing, you can create the discipline and consistency you need for better performance and help to remove and minimise the human psychological ‘interference’ bias on your trading. We have learnt that:

We know that the best traders have mastered two components – themselves and the markets. Where the markets are concerned, technical analysis allows the trader to decode in a more simplistic and quicker fashion, the psychology, behaviour and fundamentals at a more ‘macro’ level.

As an individual, technical analysis allows you to become more objective rather than subjective in your decision making processes, which is crucial to your success and improving your results. Technical analysis allows you to bring these various components together into a structured process.
Market understanding
Understanding people’s behavioural psychology plays an important part in driving the markets and the profession of technical analysis has created many tools to aid your timing, entry, exit and analytical ability. At this level again, we’re trying to add in objectivity where possible, but it still has a large subjective bias.

Cycle theory is a great concept to understand. Many of the greats: Dow, Elliott, Gann, Wilder etc have all put in their pennies worth. If though, you can understand by looking at a chart where we are in the trading cycle using whatever technical tools are at your disposal, then this can seriously improve your trading! In simplistic terms, the hypothetical chart below illustrates this point. For example if you know the market is in a stage of ‘desperation’ why would you go long!!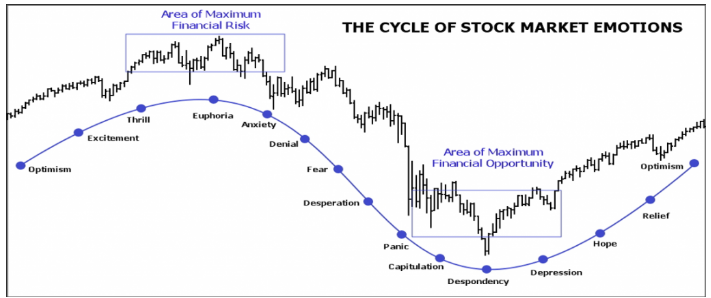
Other…