Last week in Part 7, we looked at Market Breadth. We now start a chain of eight articles covering technical analysis directly carried out on price. We will be looking at patterns, support & resistance, trends, Fibonacci, pivots, moving averages, bands, indicators and Ichimoku. The first of the eight, looks at Trends, Support & Resistance. Understanding these principles will give you the necessary building blocks to understand price action and analysis and evolve your technical analysis learning.
The trend
From the previous articles in this series, we know how to build some of the basic and most popular chart types. We now need to know what the chart is trying to tell us. We start with direct price analysis. Remember one of the key founding pillars of technical analysis: ‘Prices move in trends’? This is where we start – what direction over a period of time is the price moving in? This can be categorised into 3 simple classes: Up, down or sideways. The trend is measured through the analyst’s subjectivity, based around some loose rules, by manually drawing trend lines onto charts.
So, what is a trend? Its official definition: The general direction of a market or of the price of an asset.
All tools used by the chartist have the sole purpose of helping to measure the trend, with the expectation, as a trader, of participating in it.
Some basic trend rules
Markets trend roughly only a third of the time – so you need to know when it is happening!
Other than being Up, Down or Sideways, trends have three time classifications:
Major trend: 6 months to 1 year+
Intermediate: 3 weeks to 6 months – where most ‘trend followers’ interact with the market.
Near: < 3 weeks – used for timing purposes
Trends don’t just move in straight lines. They move in zigzags and create waves.
A tentative trend (Up): if price has 2 reaction lows with second higher than first – vice versa for down trends.
A confirmed trend, if the price touches for a third time.
Trend significance: the more times touched and the longer intact, the more important the trend is.
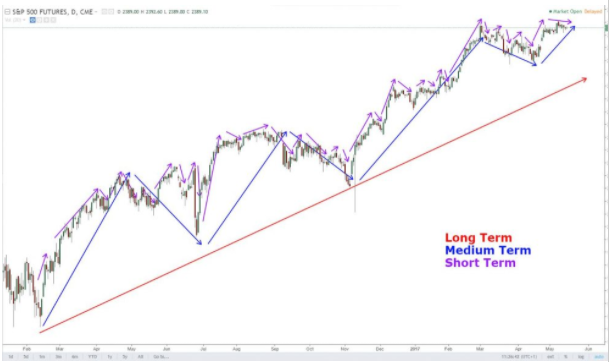
Example of trends within trends in the long, medium and short classification on the S&P500 (charts: TradingView)
Measuring trend length, is often down to the perception or objectives of the trader or the type of trader you are.