Last week, I wrote about AIM breaking below its moving averages and what that meant for UK small-cap investors. Now it's happened to the world's most followed equity index - the S&P 500. This holds even more significant ramifications for global investors.
The 200-day moving average is the line in the sand that almost all trend followers and institutional investors watch. When the S&P crosses below it, the character of the market changes. As Paul Tudor Jones, the great hedge fund manager, once said “nothing good happens below the 200 day moving average”.
So this weekend, I decided to analyse 56 years of S&P 500 history to quantify exactly what we’re facing.
Two very different markets
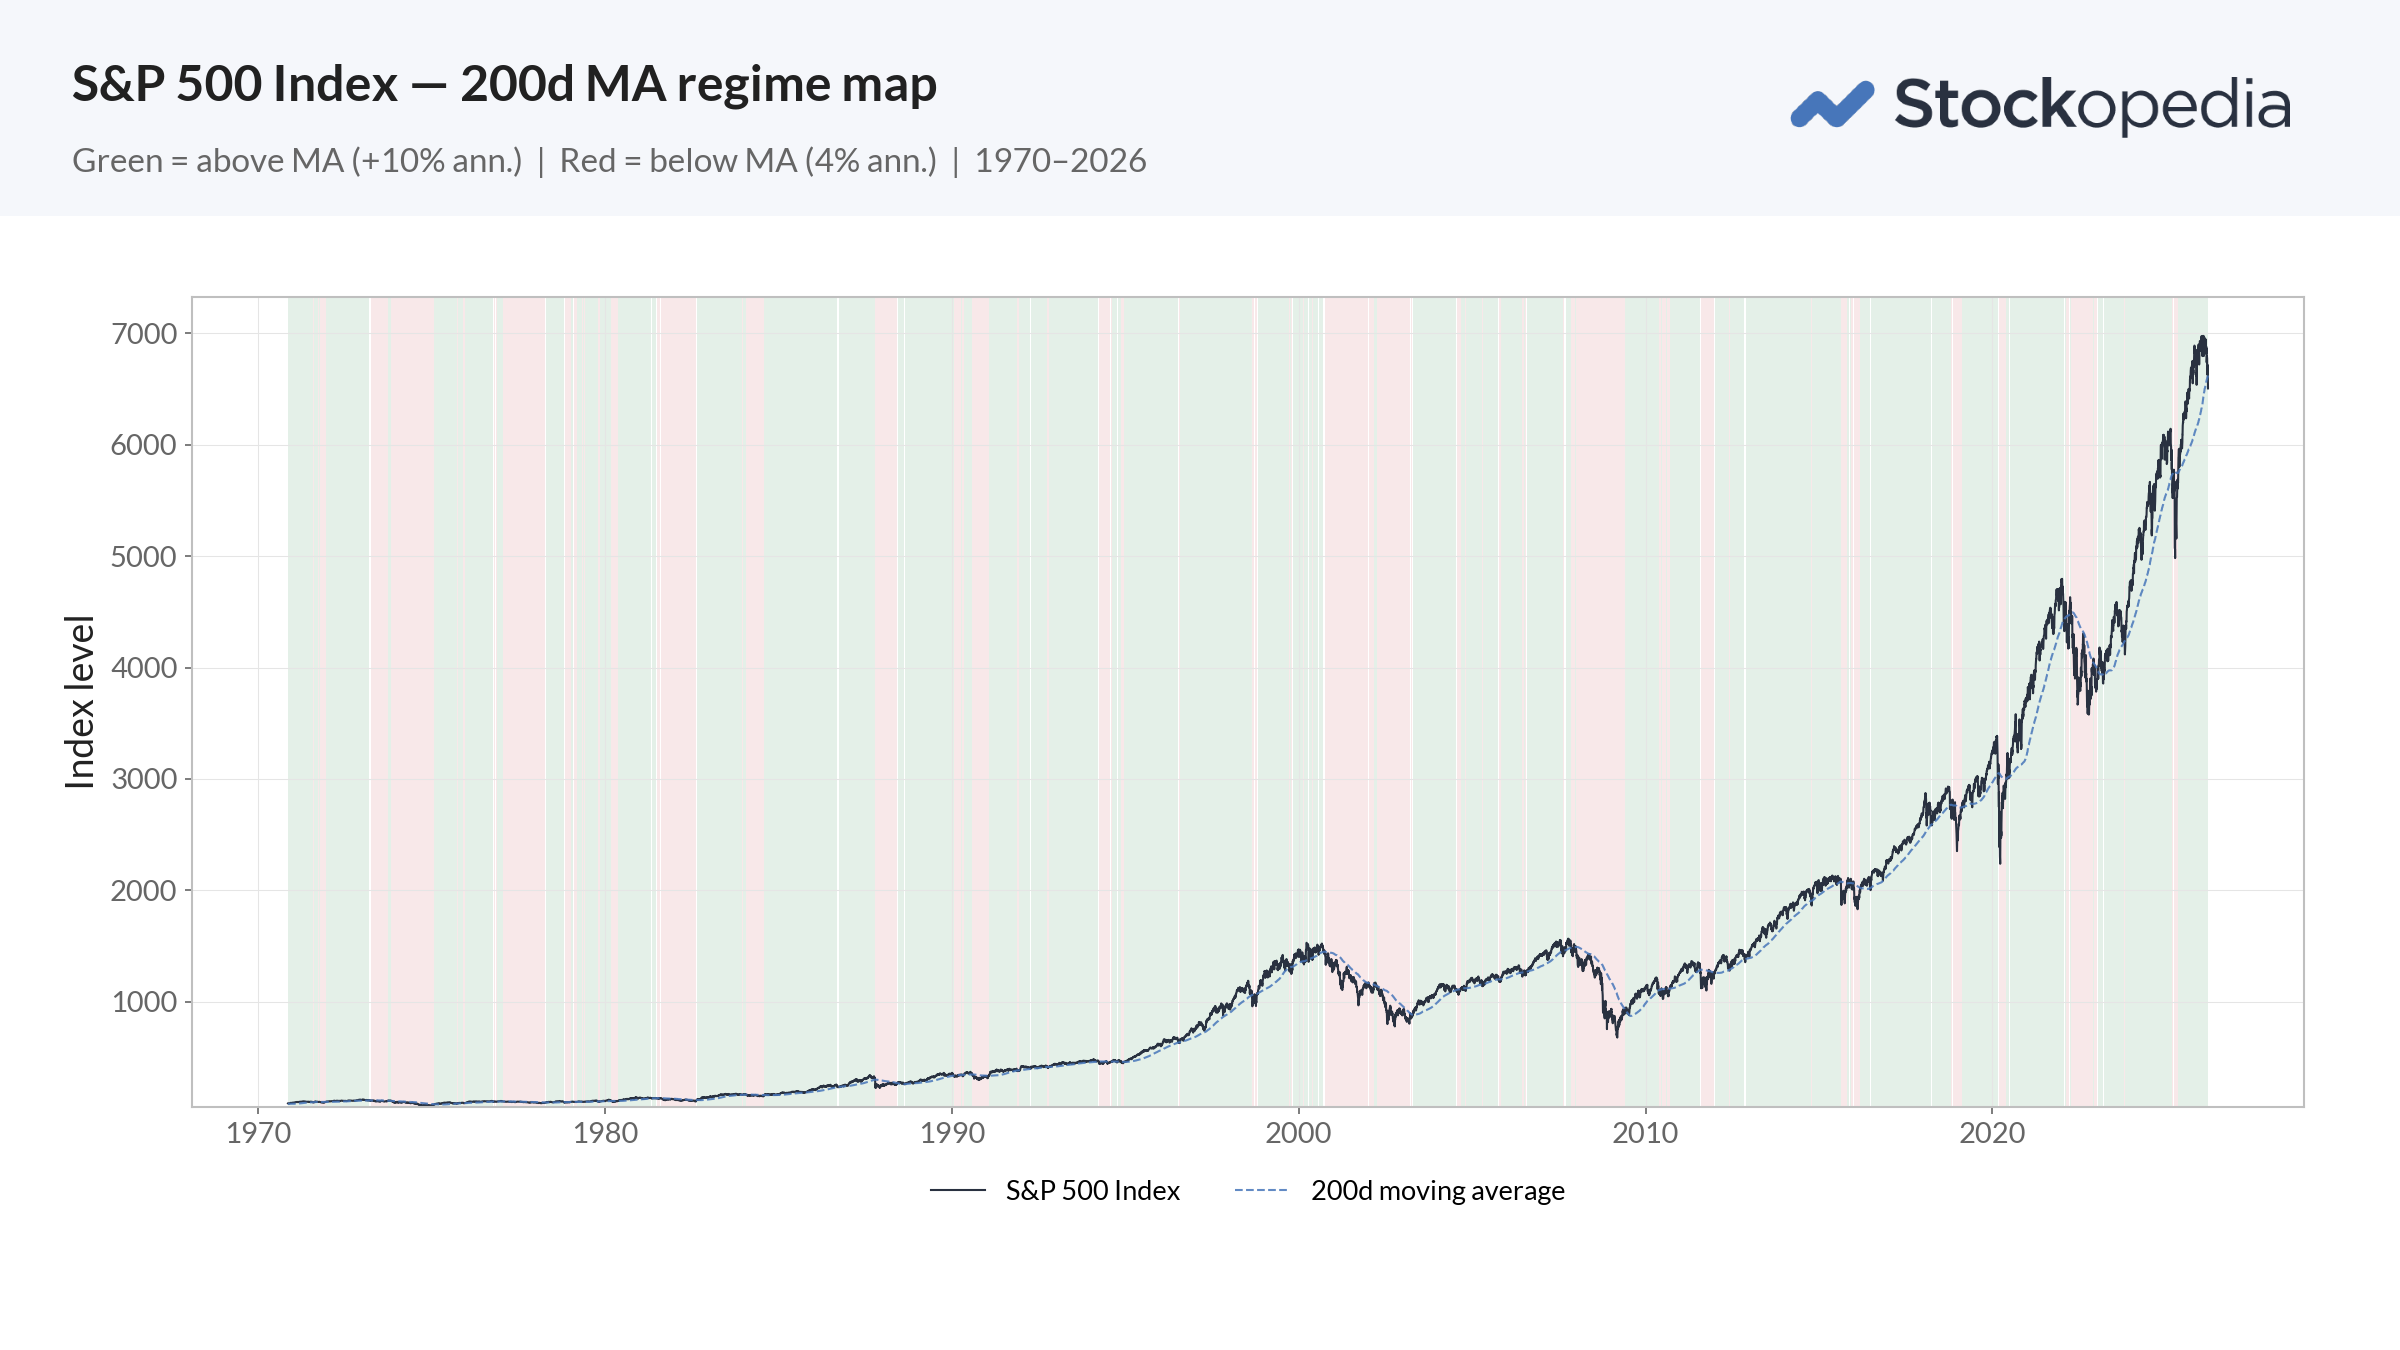
The S&P 500 has returned +8.1% annualised since 1970, which is an impressive record. But within that number lie two very different regimes.
| Regime | % of Time | Annualised Return | Volatility |
|---|---|---|---|
| Above 200d MA | 72% | +9.7% | 13.1% |
| Below 200d MA | 28% | +4.1% | 25.0% |
| Buy & Hold | 100% | +8.1% | 17.3% |
When the price of the index moves below its 200 day moving average, the numbers are stark. Admittedly, the performance difference between bullish and bearish regimes isn't as dramatic as AIM's 43 percentage points - the S&P 500 being a far superior collection of companies. But a 5.6% spread over half a century is certainly not noise.
Below the 200 day MA, returns are more than halved, while index volatility nearly doubles. You are paid less for more risk, and crash risk is heightened. The S&P 500 moved into this regime 2 days ago. The chart below shows how most of the worst breaks down in the index happen during these periods.
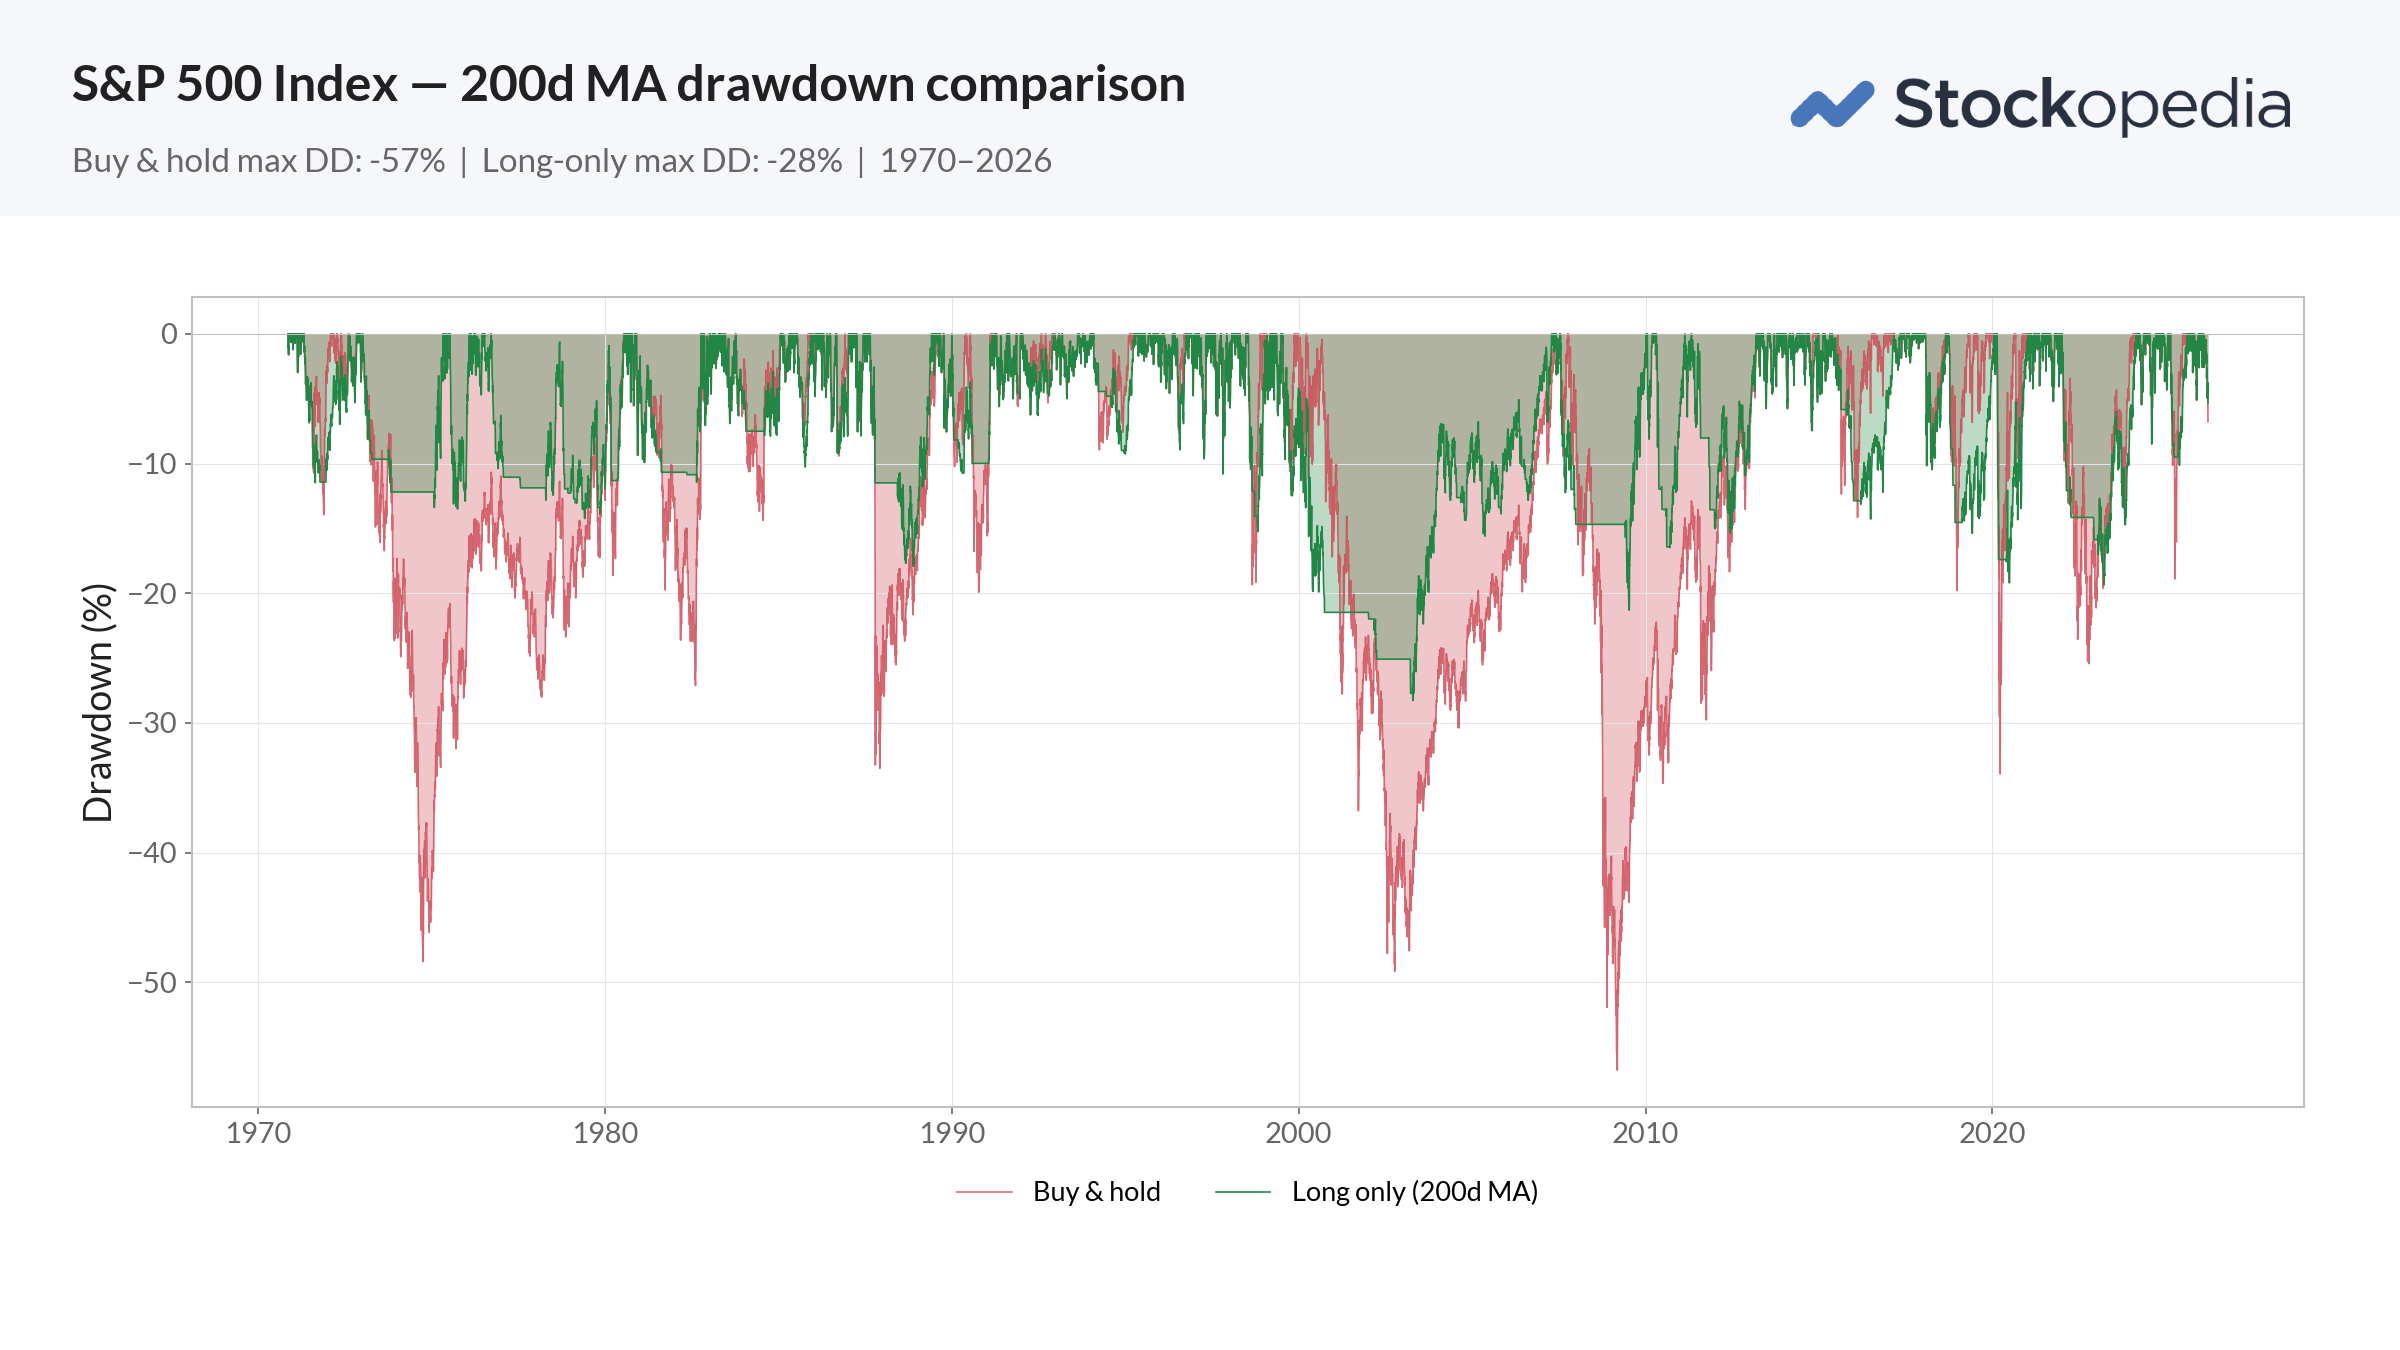
Avoiding drawdowns really matters
It’s drawdowns that bring the most pain in investing. We all get anchored onto our portfolio valuation at a market peak, and we rue and regret every day we spend below it.
Consider this - an S&P 500 buy-and-hold investor would have endured a -57% drawdown during the 2007-2009 financial crisis - more than half their portfolio gone. Compare an investor who simply stepped aside when the index fell below its 200-day MA? Their worst loss across 50 years of history would have only been -28%.