I've been holding off speculation as I've been waiting for an 'up week' in the markets as my first condition, based on 'a rising tide lifts all boats'. If you follow the link to wikipedia you'll see that Ed Miliband appended to this "Now the rising tide just seems to lift the yachts". To Identify the yachts we can use screening, but first we need to take note of the tidal direction. William O'Neil (CANSLIM) and Mark Minervini amongst others seem to agree.
To measure 'tide', I've been examining indexes with Weekly Heiken Ashi candles. These purport to give clearer signals by averaging over price criteria. The result is a better indication of trend and a slightly higher threshold for signalling a change in trend. In effect they try to reduce false signals.
Below is the weekly Heiken Ashi for the FTSE All Share. As the latest bar is green, after a series of red, this is apparently a 'green light' at first glance, however, it is still still below the 10 week (~50day) exponential moving average, so, possibly not 'bright green'. Also the 40 week seems to be dipping downward which is traditionally bearish.
Heiken Ashi:
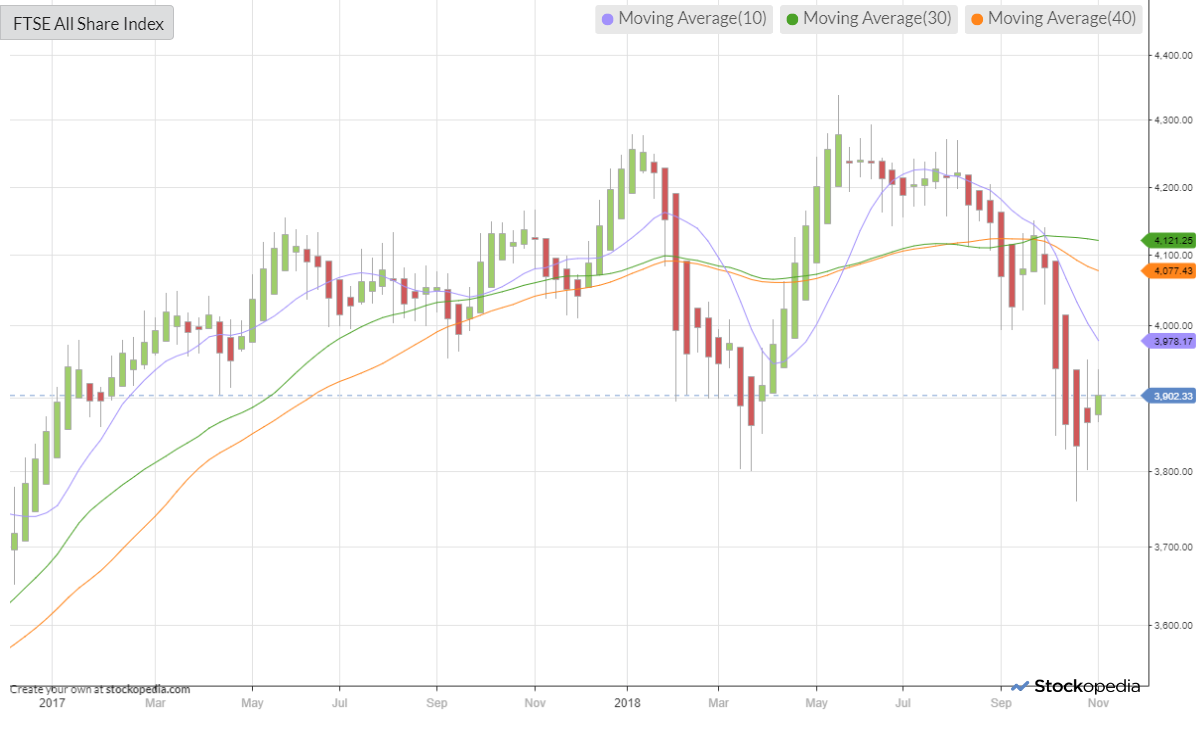
Weekly candles (below) turn more quickly but also more often within trends. Interestingly from this perspective, the last week was inside the previous one, indicating uncertainty, with a small body and relatively long wick, also supporting this. The positive element in both charts is the 'support' at roughly 3800.
Traditional candles added for contrast:
.png)
The Eurofirst 300, my second investing region, has also got a green light with just the average issues.
Heiken Ashi:
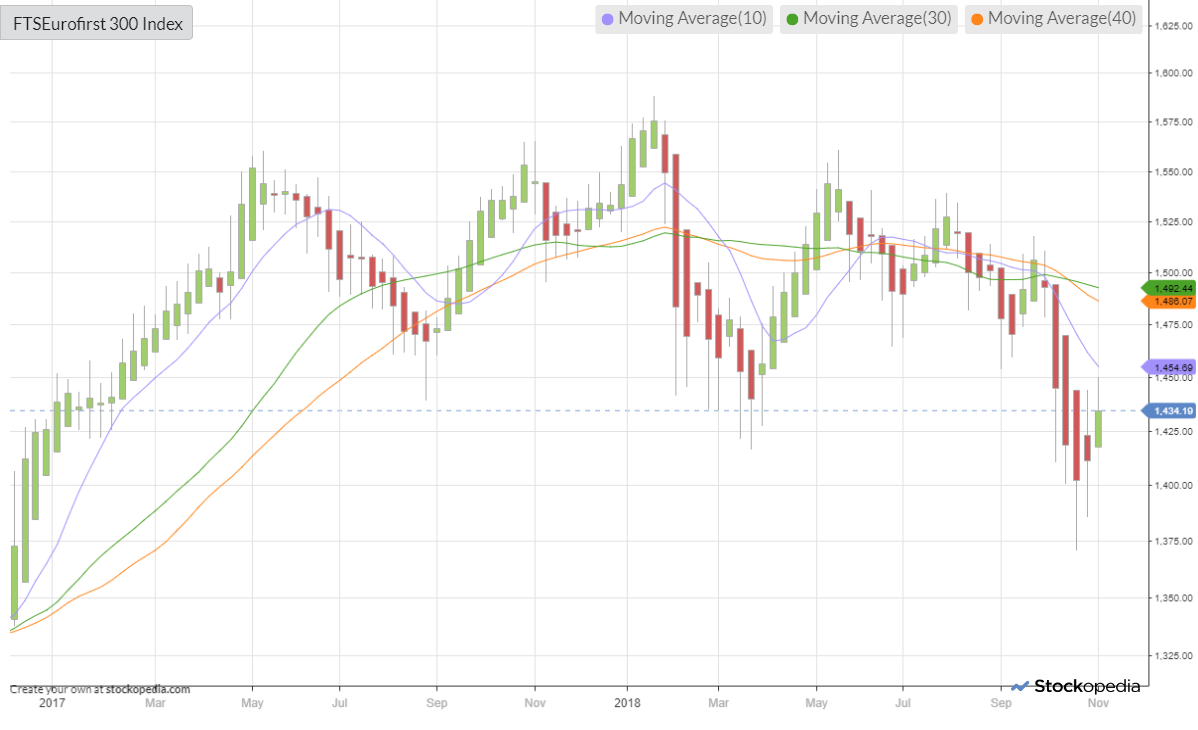
In Heiken Ashi terms the final candle is more positive, however, its closing position, in the middle of the candle, isn't particularly strong. From a bearish perspective the latest low also undercuts the prior low.
Traditional candles:
.png)
In pure candles terms there is a similar picture to the FTSE Allshare.
I also look weekly at the S&P 500 and the Hang Seng. I'm not sure if these are 'dog wagging tail' or 'tail wagging dog'.
Heiken Ashi:
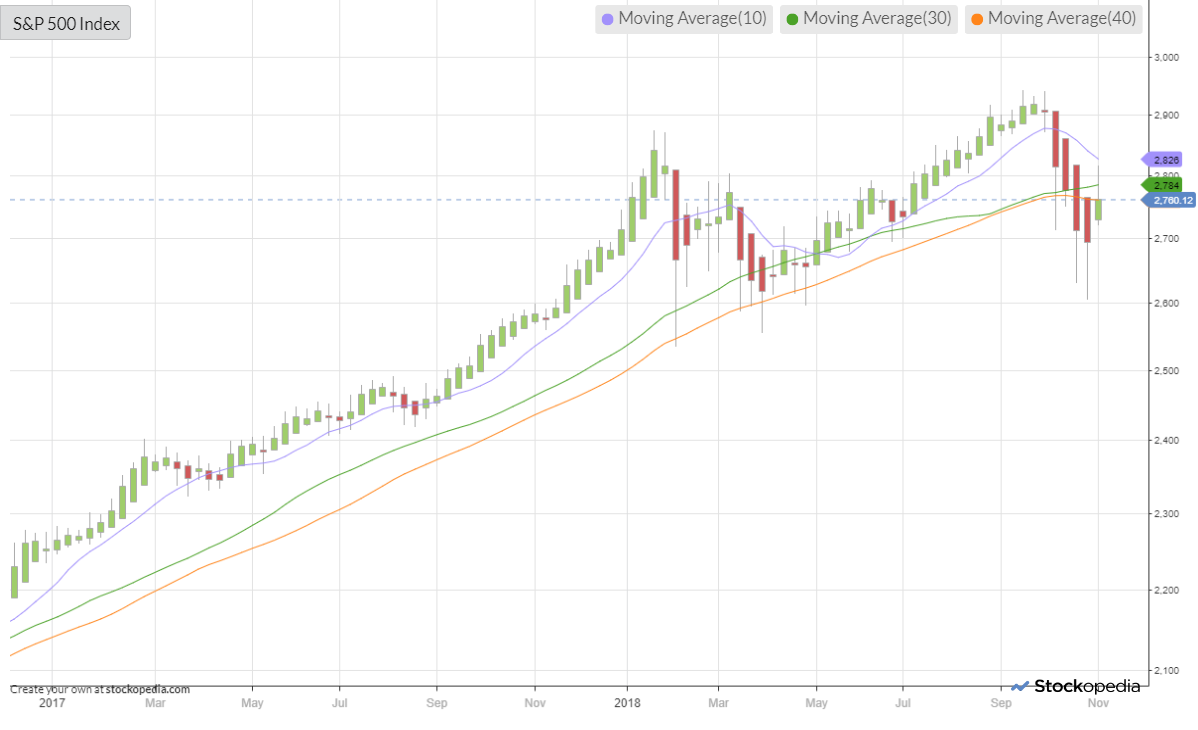
The S&P still…