The StockRanks - five years of market beating returns and ten essential insights

In 2013, a year after we launched the subscription service on the Stockopedia website we had an idea. Having read through hundreds of academic papers, quantitative research notes and books on the subject of stock selection we realised there were some common threads. Why not bring those threads together into a simple, intuitive and effective rating system for stocks?
So were born the StockRanks, which we launched in April 2013 for UK stocks. The system was extended across Europe and other global markets over the next several years. This academically inspired, but intuitive system that ranks stocks for their quality, value and momentum has become the most loved feature of the service. 73% of subscribers tell us it’s had more impact on their results than any other site feature.
Reviewing half a decade of insights…
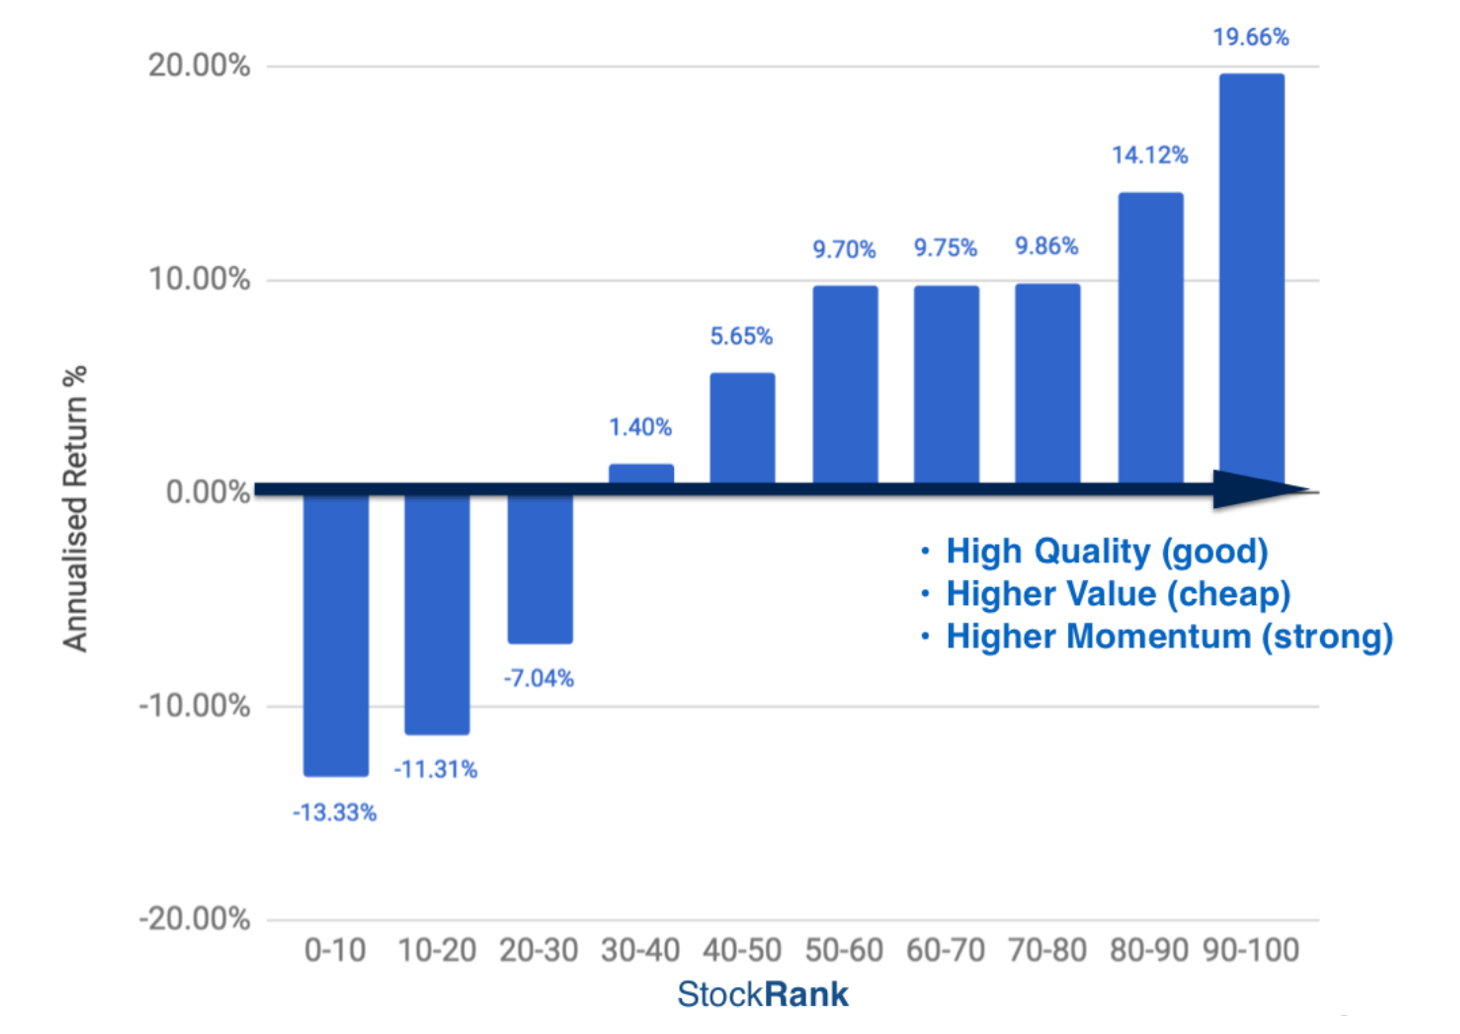
Last month marked the five year anniversary of their birth and led to some reflection. Over this period, the top 10% of UK stocks by StockRank have generated annualsed capital gains of almost 20%. Significant wealth has been generated through their use. Across more than a hundred years stock market history, five years is not long, but the differential returns between high and low ranking stocks do suggest that our approach has merit.
Since 2013 I’ve published dozens of blogs, videos and webinars about the StockRanks and their use in portfolios which have generated vigorous discussion. Having to respond to such an intelligent community of investors has been one of the most rewarding aspects of my role. It’s helped considerably to deepen my thinking on all aspects of investing - especially with regards behavioural biases, factor investing, diversification and rebalancing.
Last week I conducted an extensive but accessible 2 hour webinar covering the construction, history and usage of the StockRanks. It’s a deep dive into the foundations of factor investing, ranking systems and their use. Any investor using the StockRanks to help in their own stock selections will benefit from the lessons within. Thanks to Ian for the following compliment on the material:
A lot of ground covered in your latest webinar – Its instant investment expert stuff!
You can watch in your own time at this StockRanks Webinar Link and download the accompanying 125 page StockRanks Slide Deck.

I’m 75% of the way through an extensive eBook about the StockRanks to further explore these ideas. As usual it will be available for subscribers for free via PDF, ePub or Kindle.
Market beating returns don’t come without risk…
While the performance to date has been impressive, details of which are published in the slides, I try in the webinar to be clear about the risks. Our factor-investing inspired approach has worked across most sectors, size groups and regions in the world to date but these sources of return may not persist perpetually. The old financial industry disclaimer “past performance is not an indicator of future returns” remains true.
Investors using the rankings should be aware that factors like Value & Momentum do not all work across all market cycles, and there are likely to be ‘bad times’ of underperformance in different market areas at different times. This is to be expected. All good systematic investors know that without occasional underperformance, outperformance cannot return. Markets tend to be reasonably efficient after all, and strategies showing good returns tend attract more capital until they are squeezed.
Nonetheless, for me, investing in stocks that display the traits targeted by the StockRanks (high quality, good value, strong momentum) is the only rational way to invest. The day the market doesn’t reward these traits, is the day I’ll throw in the towel and invest in tracker funds. Thankfully, for everyone that enjoys selecting their own stocks, that day doesn’t appear to have arrived quite yet.
Ten key insights from the last five years
While most of my recent work has gone into the webinar, slides and ebook, the following are ten key insights worth reiterating in this blog. The charts below relate to UK stocks above a £10m market cap. If you want a more international perspective you can jump to the relevant section in the webinar.
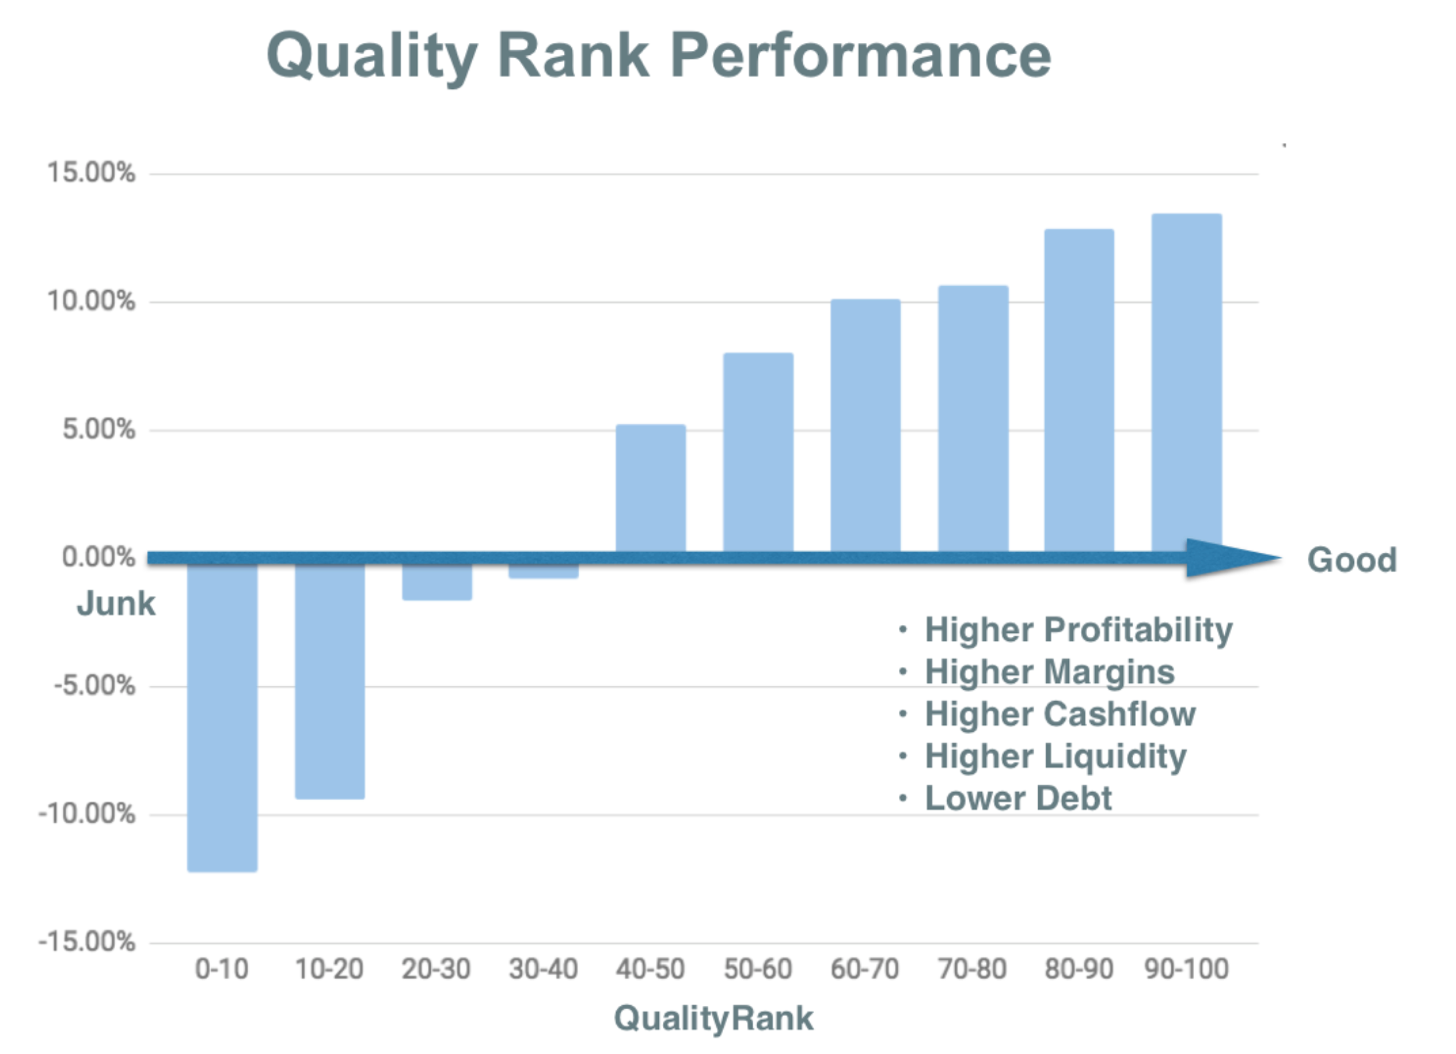
1/ Quality Stocks have outperformed Junk Stocks Profitable, cash generative, low debt, high margin companies with improving fundamentals have outperformed unprofitable, cash consuming, high debt, low margin companies with deteriorating fundamentals. It’s not rocket science… just good common sense.
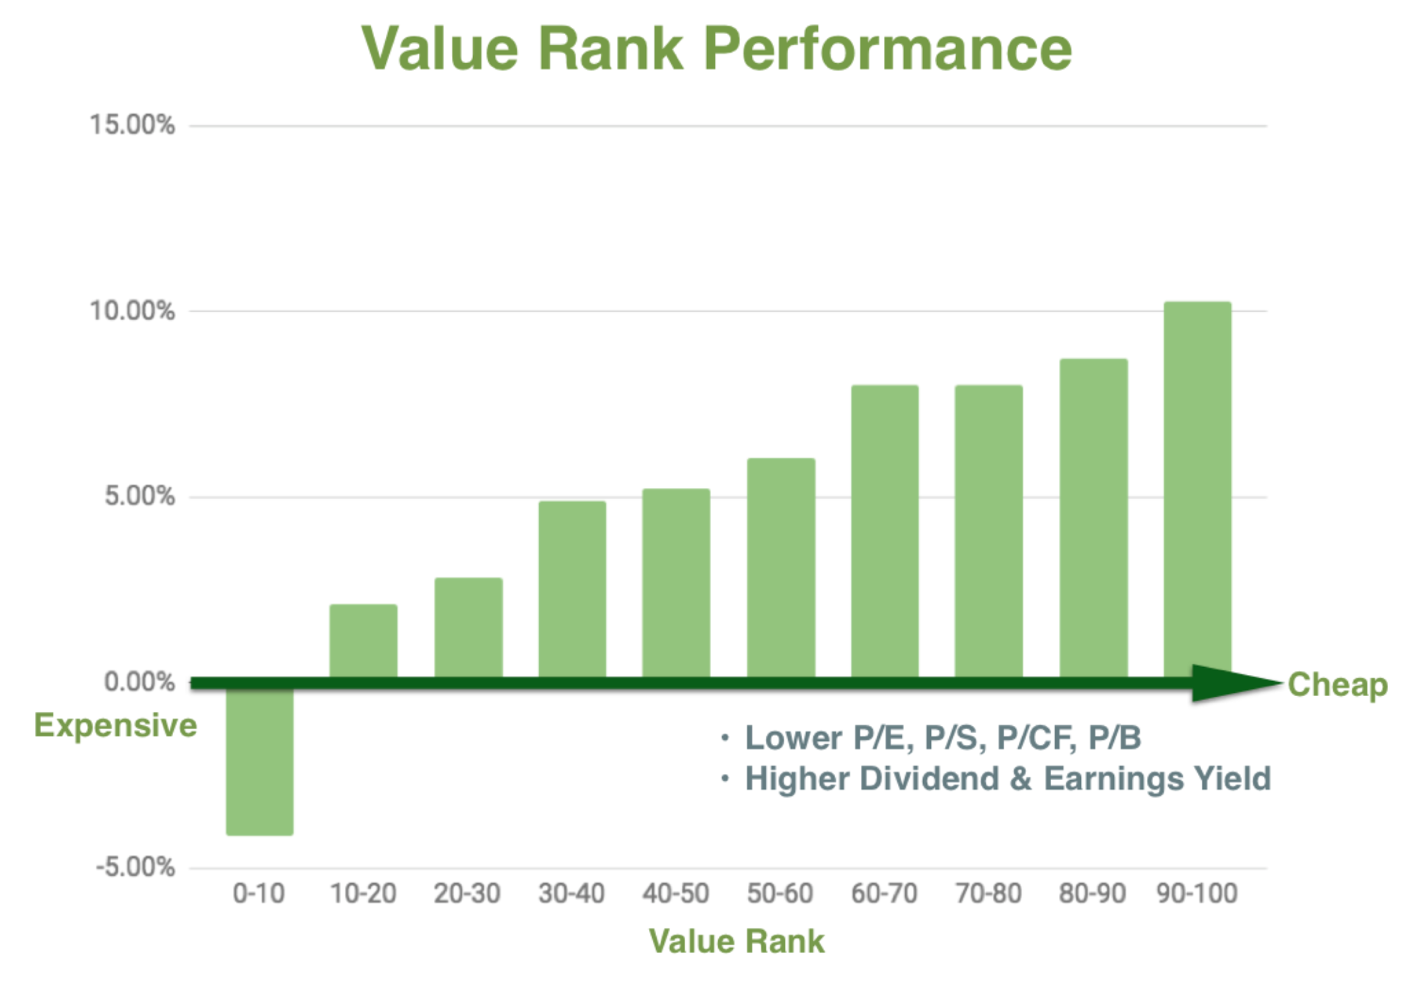
2/ Cheap Stocks have outperformed Expensive Stocks Stocks that are cheap according to traditional valuation ratios like the Price Earnings ratio, the Dividend Yield and the Price to Sales ratio have outperformed those that are expensive on the same measures. Bargain bucket investing still pays…. but do note, it’s been a very volatile approach, and is loaded with significant risk. Watch the webinar for more info on how to use the ValueRank.
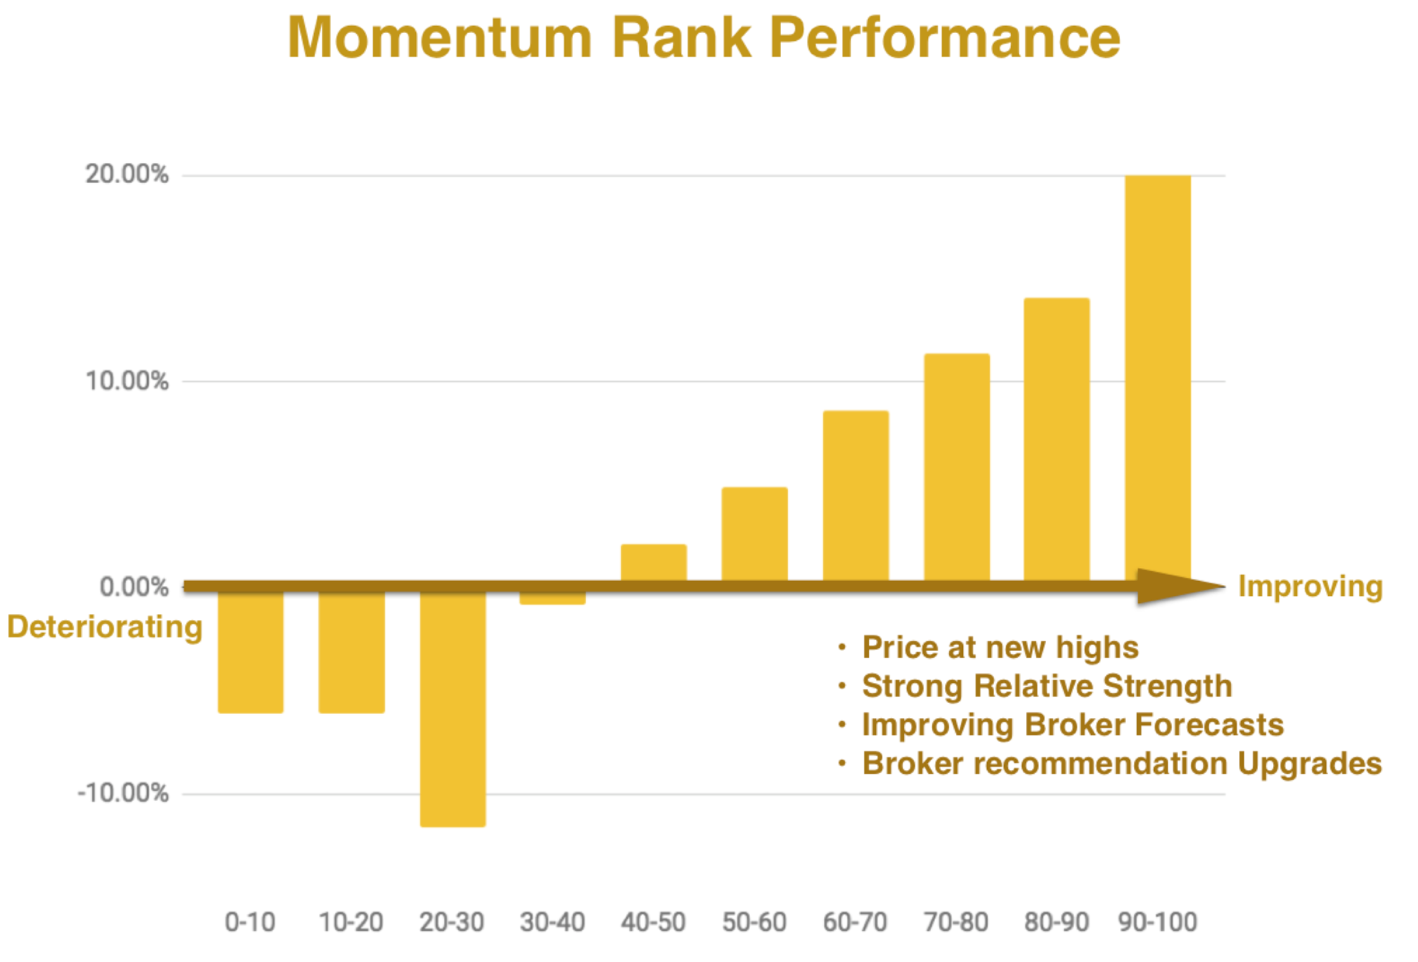
3/ Strong Stocks have outperformed Weak Stocks Buying ‘Momentum’ is loathed by Value investors… but it’s been almost twice as profitable in recent years. While the value investing brigade have done ok, momentum and trend investors have done far better. Recently the Momentum Rank started outperforming the overall StockRank. Buying shares at new all time high prices is a strongly leading indicator of future price performance.
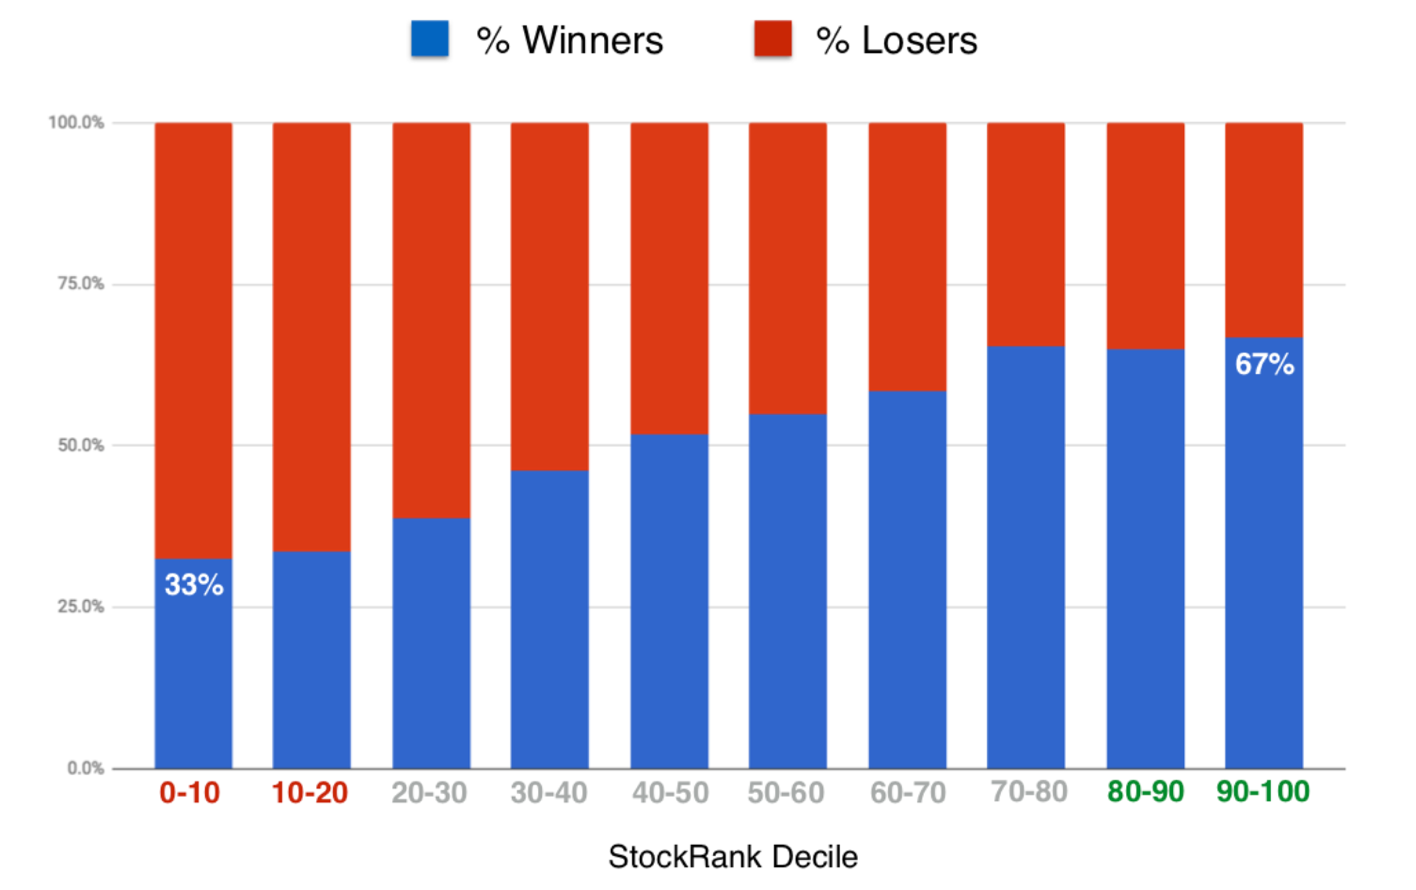
4/ Higher StockRanks have had a higher chance of being winners The following chart shows the percentage of stocks each year that have on average turned a profit (in blue) or a loss (in red) over the next 12 months. For 90+ ranked stocks there’s been a 2 in 3 chance of picking a winner, for 10- ranked stocks there’s been a 1 in 3 chance. Thanks to Oliver Cooper for his extensive work on these hit rates.
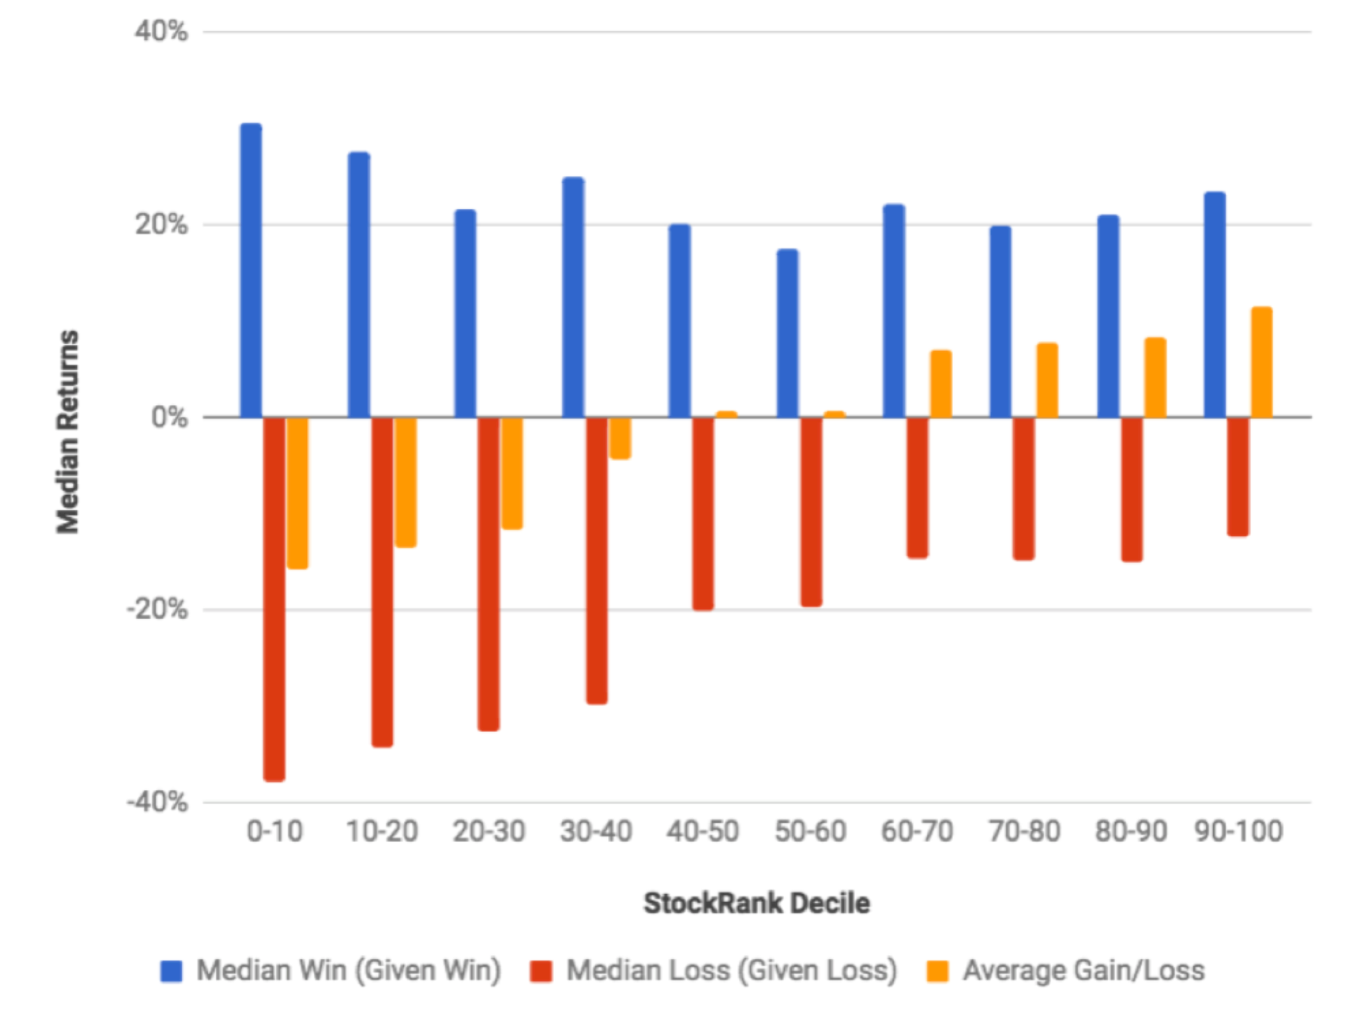
5/ Low StockRanks stocks lose more on average, but win more when they win While higher ranking stocks have outperformed, that doesn’t mean lower ranking stocks should be ignored. Oliver’s analysis has shown that if you do pick a winner in lower ranking shares, you are more likely to pick a big winner. The blue line below shows the average size of a win given a win. There’s hope for blue sky stock pickers yet!
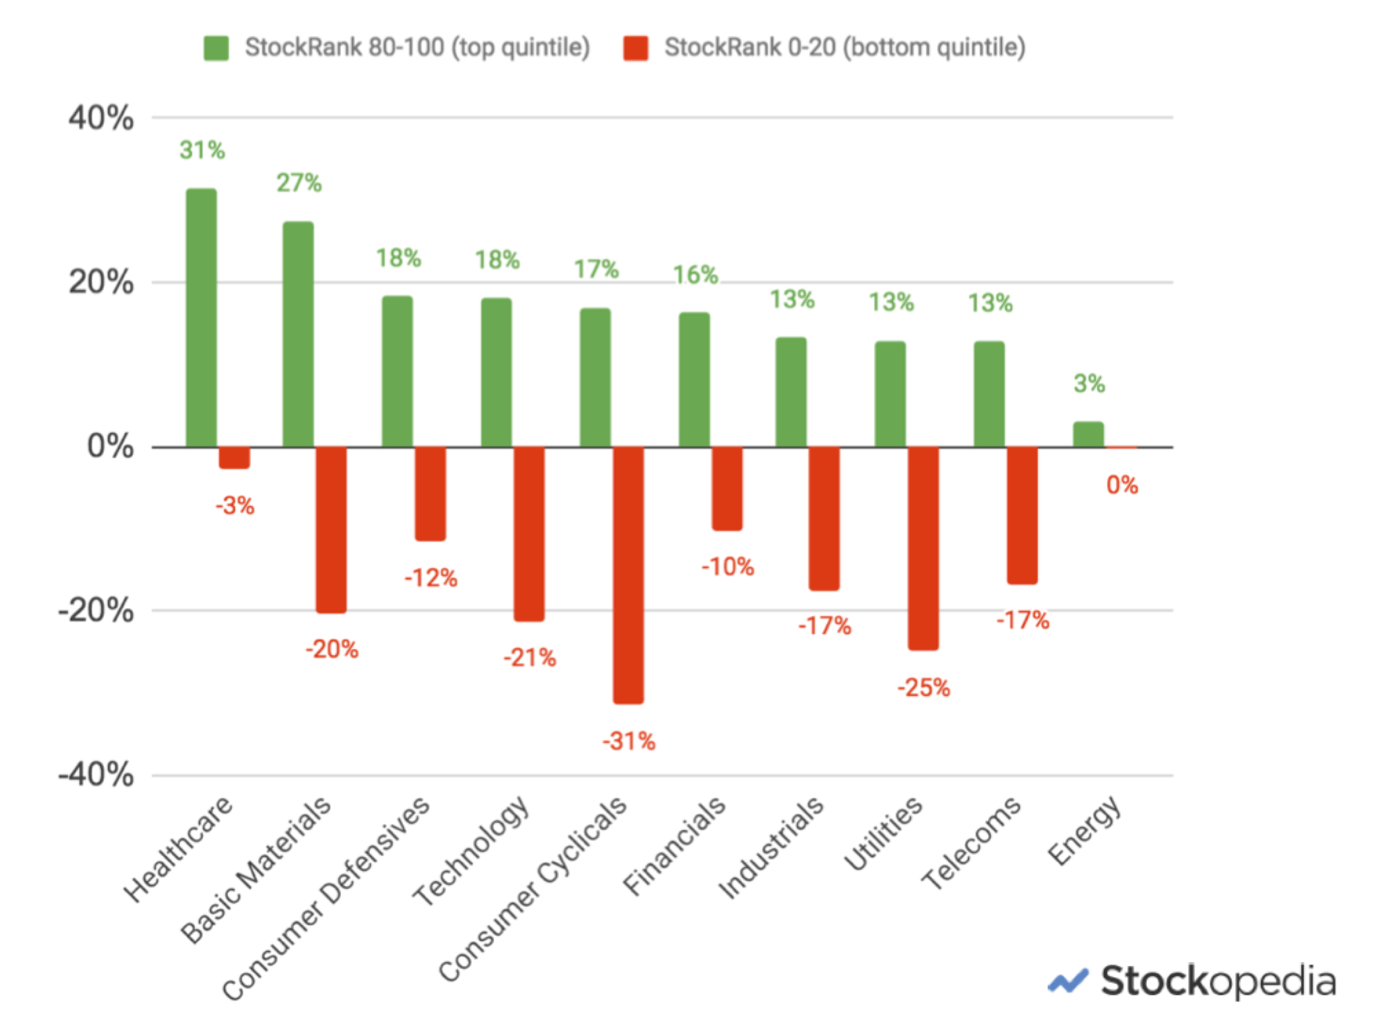
6/ High StockRank stocks have outperformed in all sectors except Energy We use the same universal ranking system across all stocks in the market. Understandably many have queried this approach. Surely the metrics most appropriate to analyse financials are not the same as those most appropriate for healthcare stocks? While these arguments have merit, the results have been surprisingly consistent across every sector in the market except the Energy sector which has been going through a poor cyclical swing.
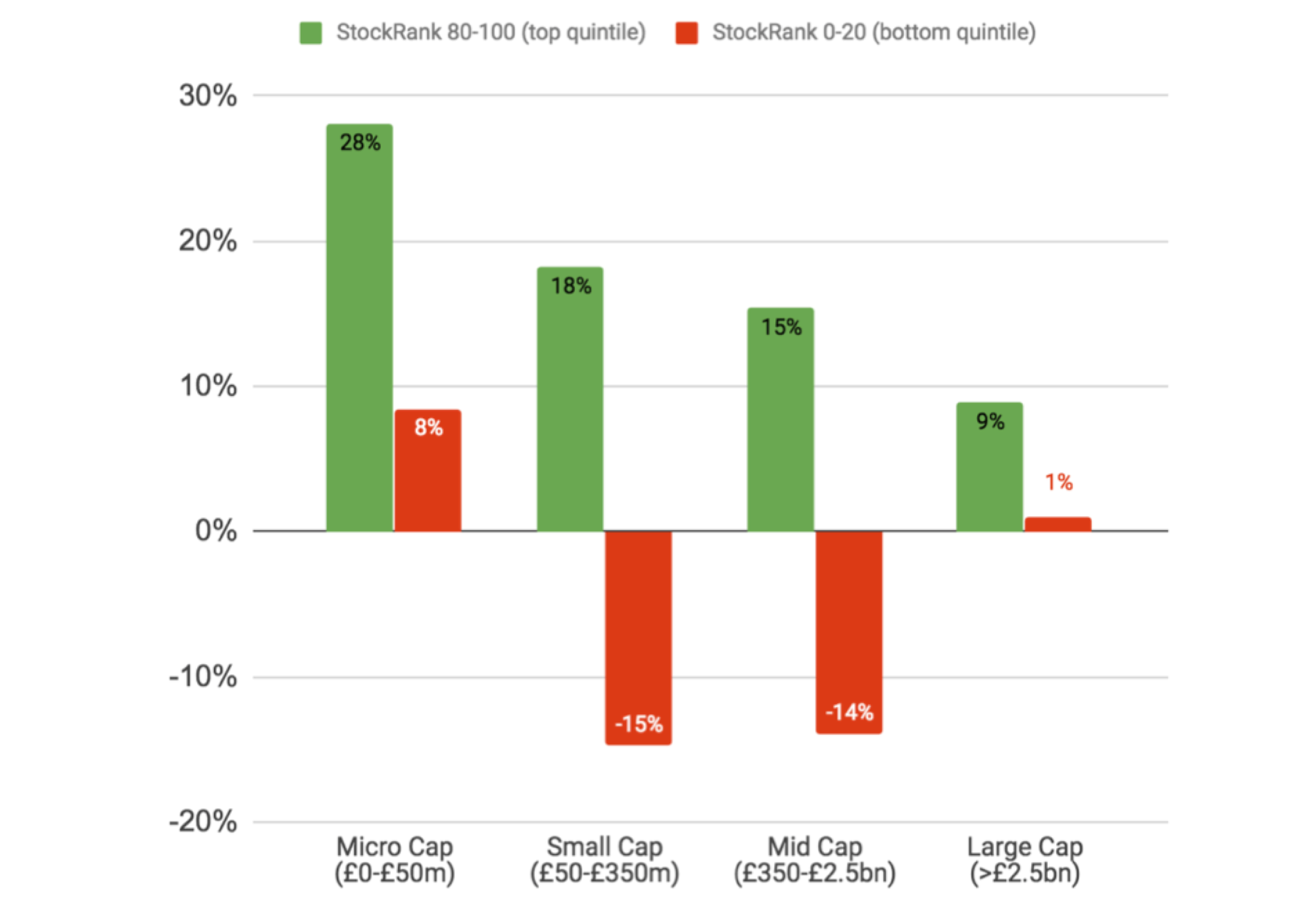
7/ High StockRank stocks have outperformed across all size groups Given the dominance of small cap shares in recent years, some have questioned whether the StockRanks have any use among large caps. The results show categorically that these approaches have been universally effective across size. While there is a small cap bias, the 9% annualised performance for large cap shares has dramatically outperformed the 3.3% annual performance of the FTSE 100 over the same timeframe.
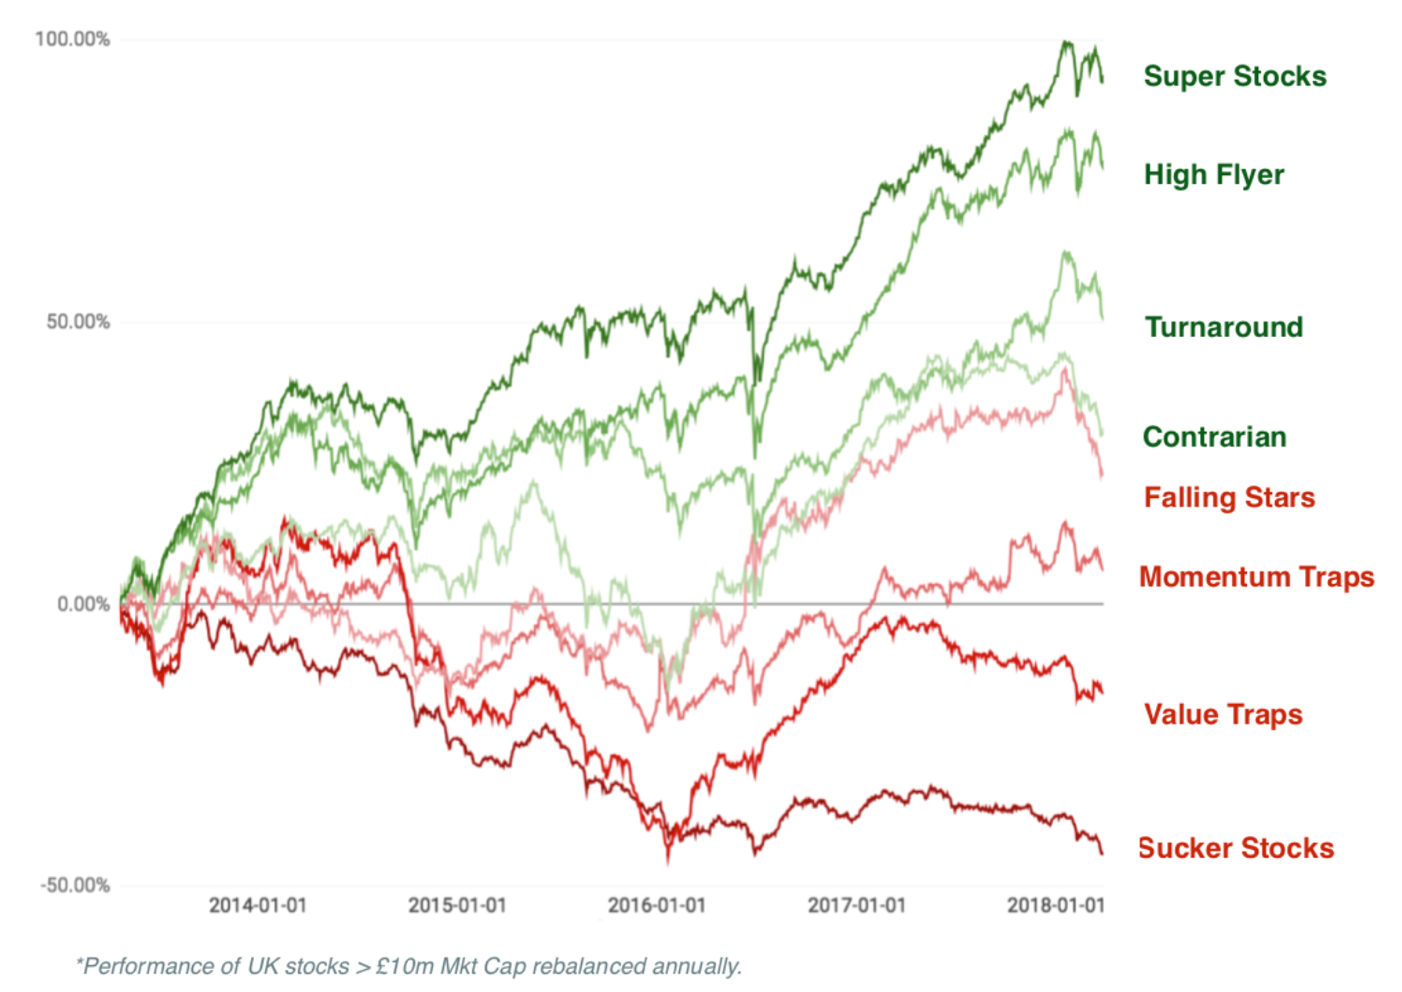
8/ Sucker stocks really do deserve their label… The Style Classification system that we launched last year was a great project pioneered by Tom Firth here. We wanted to use provocative language to help subscribers think twice whenever they were attracted to lower probability bets. This approach was inspired by Cass Sunstein’s excellent book “Nudge: Improving Decisions About Health, Wealth and Happiness”. While buying lower ranking shares can be highly profitable, the odds are low… and they are never worse than when picking ‘Sucker Stocks’. If you’d like a fun 33 minutes on the “Super Stocks vs Sucker Stocks” debate - watch this speech.
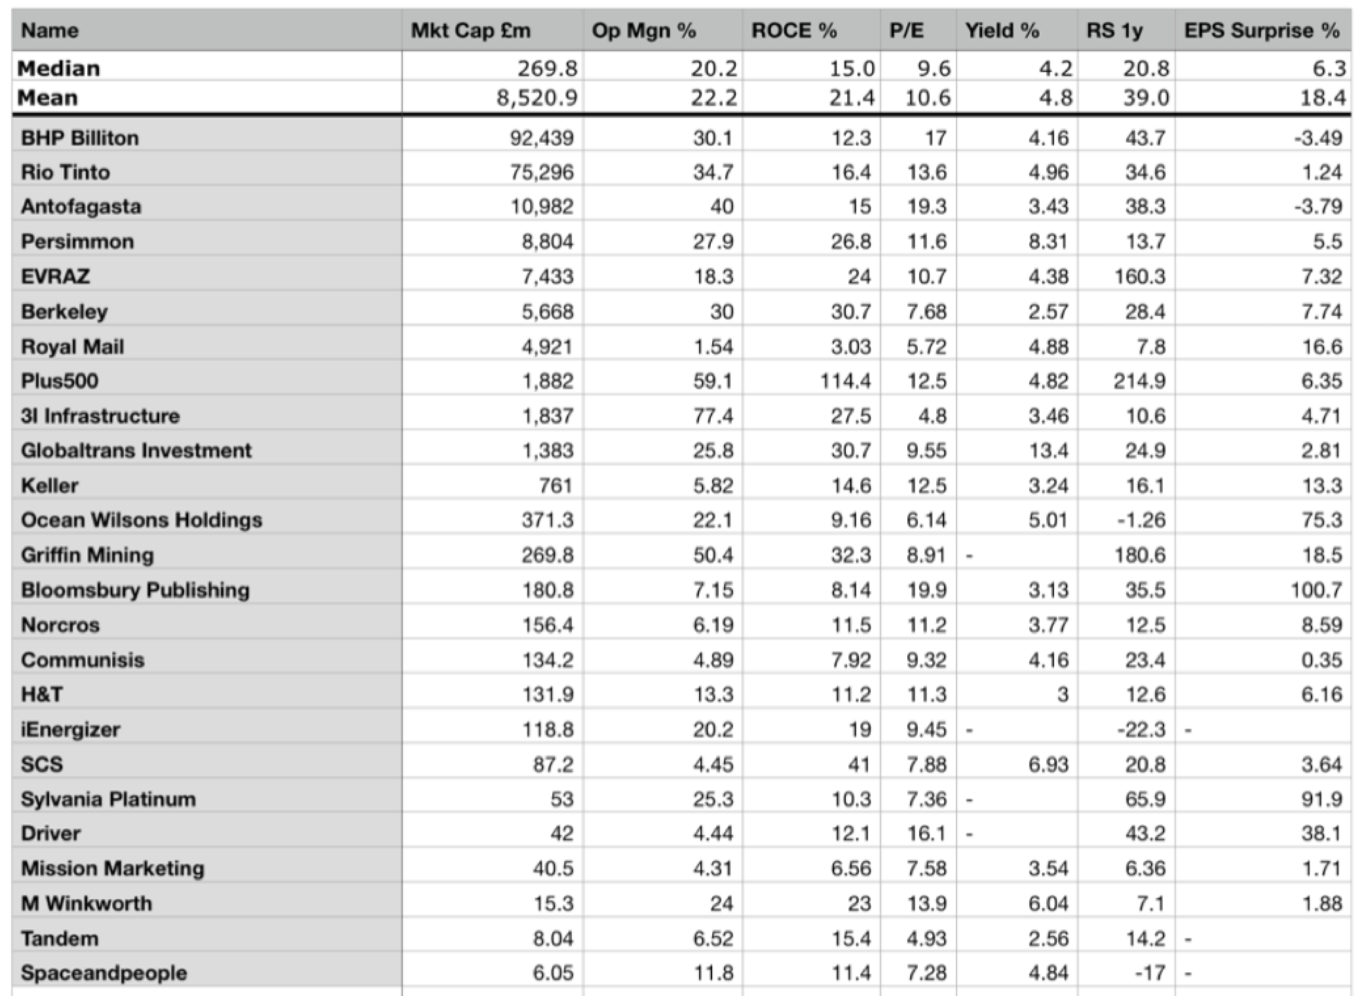
9/ You can’t pick the perfect stock, but you can synthesise one… In the webinar I showed that trying to screen for stocks with great financial metrics is a futile exercise. The perfect stock that has high profitability, high margins, a low P/E, high yield, strong relative strength and a history of beating expectations does not exist. But when using the highest StockRanks in the market, you can synthesize a portfolio that displays these traits on average. It’s a kind of mad alchemy.
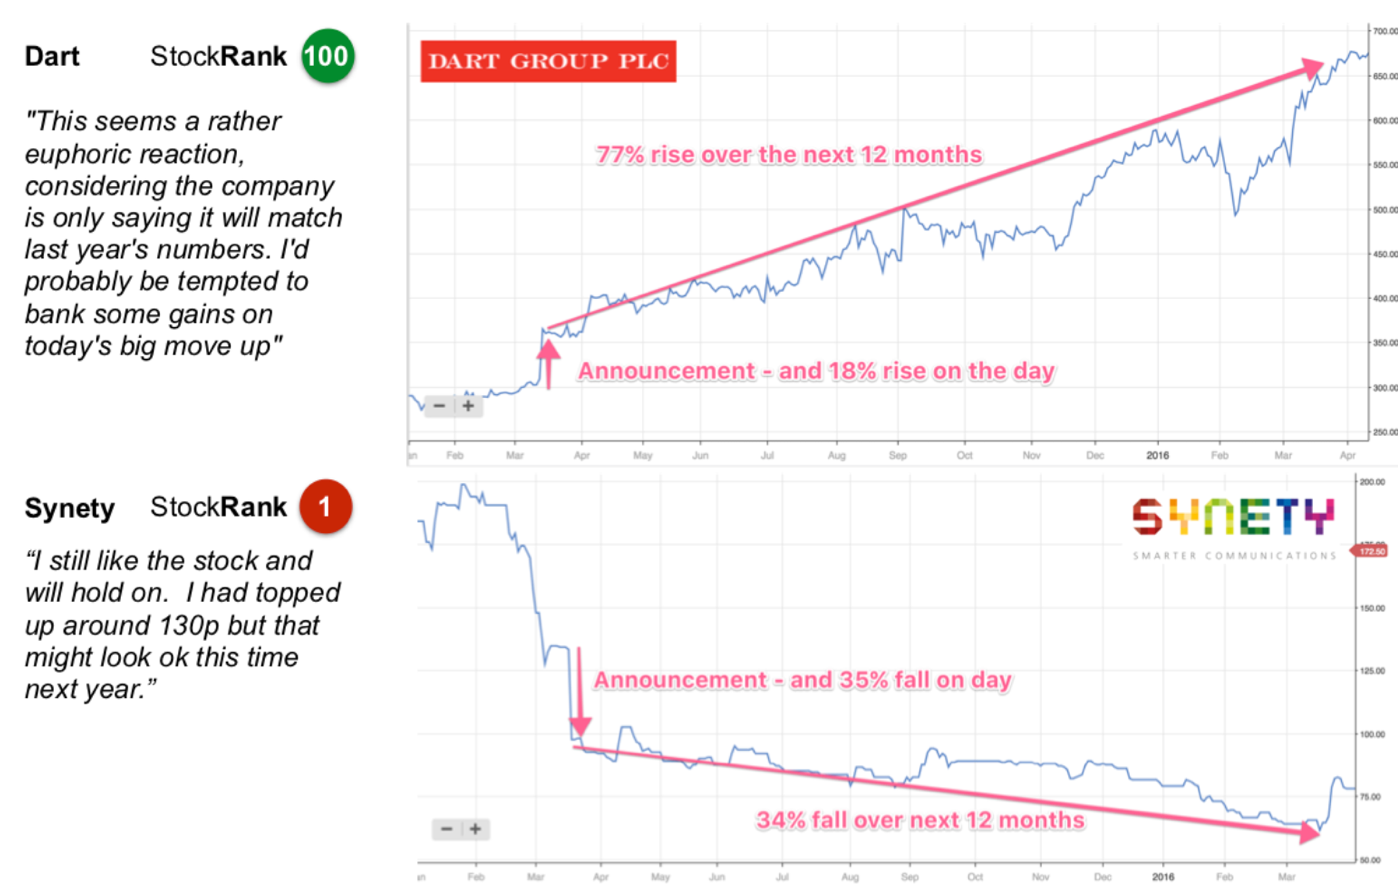
10/ We’re psychologically biased against high StockRank stocks, and attracted to low StockRank stocks This classic example from a few years ago really illustrates this point. Dart Group had a rank of 100, and beat expectations, while Synety had a rank of 1 and disappointed by announcing a placing. Dart rallied, Synety plummeted. Comments about dull, predictable Dart discussed taking profits. Comments about exciting, story stock Synety discussed buying more. What happened in the following 12 months is a tale that plays out again and again and again…
I hope these insights have been useful, and if you want more, do watch the full StockRanks webinar and read the ebook when it is published. Please remember that Stockopedia is designed for DIY investors. Make sure you do your own research (DYOR) and take investment advice if you aren’t sure about your own ability to select good shares. We do everything we can to help, but there are no guarantees in the market, and ultimately the future is annoyingly unpredictable.
Here’s hoping the next 5 years are as profitable as the last.
If you've done well, or badly, using the StockRanks - please do add a comment below to let the community know your story. Everyone can learn from each other's successes and mistakes. Many thanks !
Disclaimer
This is not financial advice. Our content is intended to be used and must be used for information and education purposes only. Please read our disclaimer and terms and conditions to understand our obligations.
31 comments
On the subject of using a long/short system it is quite amusing that the second best performing guru screen is a short screen. The "James Montier Trinity of Risk Screen" which has outperformed nearly every other system, including the stockranks. Probably not the way to go if you are looking for candidates to short.
Great analysis thank you.
Some of us try to reduce / balance market risk by having a short portfolio to complement the long.
Understandably there is a large bias on the site to long analysis but i think some punters here would appreciate a little more on the short side. For example does the 5 year record show that the most efficacious long attributes are equally powerful on the short side. Just looking at the bottom quintile chart appears to show this is not the case.
Thanks for a great site.
Hi Ed,
When will one be able to invest in a StockRanks ETF?
Would save me a lot of time!
Mark
Hi Edward
Great presentation and I love the site, stockranks and the overall approach. I am from a database/programming and project management background and whilst I know numbers are not everything, they can provide invaluble insights. I do have a question for you, which is around the inflounce of spreads on validity of the returns illustrated, which I will explain in more depth further down this post.
I have also been spending a lot of time reading investment books, focusing mainly on factor investing and behavioral finance, with some popular stock picking books too. What I have found fascinating is that even after really researching investing, and understanding the behavoural traps, I still fall right into them. Turns out I have the same monkey brain as everyone else - who would have thought it!
Hence I am considering a pure factor based approach, using the full range of value/momentum/quality factors in the Stockopedia stockranks and only picking those with an SR of 90-100. I plan on ordering all of these by size (smallest first) as the clear evidence seems to be that small companies outperform, and picking the first thirty, as this means I can invest enough equally in them, without the fixed trading costs becoming too great. (about £3k in each). I plan on rebalancing annually, to reduce trading costs, and expect the latter to roughly equal the dividend yield.
The one extra filter I am planning on using is only choosing shares where the spread is less than 200 basis points, to minimise trading costs, and make sure I am not trading in illiquid stocks. This also seems to rule out most companies under £50m in size, but that is a prettty small size.
The question I have for Ed is if we pick a max level of spread (say 200 bp), and call those within this spread 'tradable stocks' and only including these stocks in the performance analysis, does this affect the historic returns that have been shown. I suspect it may affect the overall return, as it will eliminate many of the 'micro caps' where there is outsize performance. I completely understand that any factor based analysis excludes trading costs (and dividends) as they are hard to quantify because they depend on trade size, broker, taxes etc. I am more curious about what happens if you only include what I have defined as tradable stocks.
Any comments on what I have proposed or my question for Edward are very welcome, I have only been looking at investment for a couple of years and like learning from others.
Hi David.
A quick and dirty screen filter suggests that by cutting out stocks with a spread above 200bps you will severely limit the available universe of shares. For example, if you take the AIM all share index, there are 803 companies of which only 123 have a spread of 200bps or less (according to Stocko) , i.e. roughly 1 in 7.
Gus.
size effect related to liquidity premium (spread)
therefore by choosing small cap with low spread is contradictory in my opinion
What concerns me about the Stock Ranks measure is what appears to be their day to day volatility.
Are the graphs above based on an annual average stock rank for any stock or a stock rank measure taken at a particular point in time?
As an individual investor, I don't have access to the former but I do have limited access to the latter i.e those of todays and any previous days I recorded
I suppose Ed's Nap's approach by having a limited pool of 20 twenty stocks in different sectors presumably in QVM classes may be a way of smoothing out volatility .
Individual stocks I have selected have jumped about in their individual classification. So it a bit like being in a post office queue, you pick the one that will move quickest only to find, that the one next to you is outperforming. However, jumping about only adds cost and market timing issues as a friction.
I note that Ed will be reviewing his own NAPS performance in the not too distant future.
However, surely, a more scientific approach, assuming there are enough QVM qualifications stock available is to run one or more control NAPS selections in parallel to the one he has selected for his own, to baseline to some degree what the results are. This would help screen out some of the noise in his own selections. I appreciate he does this in a broader graphical analysis of QVM performance, but that is very hard to judge in detail and against real results.
If that trends in a similar way, it creeps towards an underlying position that QVM has a higher mean that other categories of selection, and therefore in periods when out performance reverts to mean, you are still optimising overall performance.
As you will appreciate from the above I am not a statistician!
Rick: a very good, and important, question.
Can Stockopedia please provide an answer?
The graphs are based on an equal weighted portfolio of stocks at a particular point in time that have that particular rank (e.g. QualityRank) between the lower and upper bound (e.g. 90-100). The performance is tracked in a portfolio for 3 months, and then the portfolio is rebalanced and the same process starts again... equal weighted, held for a quarter, rebalanced... etc etc.
We also track semi-annual and annual rebalancing... which all have the same general trend, though slightly lower performance records. The benefits of annual rebalancing though are lower transaction costs.
There is of course some day to day volatility in the StockRank as it's influence by the stock's price, which changes daily. But there's far less volatility in the StockRank than in any specific valuation or momentum ratio that is price influenced - e.g. the P/E ratio or Dividend Yield. The least volatile rank is of course the Quality Rank as it's more stable between reporting periods.
I can't figure out where we are supposed to be on the JPM graphic. But I want to stay in tune with the market to make maximum returns. To do this I regularly check how the different stock ranks have performed over different recent time periods.
You can see my recent conclusions in a comment that I have just added to my original post entitled "TOP PERFORMING STOCK RANKS"
What I find interesting is that, over the past 5 years, the Momentum Rank has comfortably beaten both the Quality and Value Ranks, but the Momentum Rank has only narrowly beaten the QVM StockRank, which is a blend of the individual Quality, Value and Momentum Ranks with equal weighting to each of those three. So including the relatively poorer performing Quality and Value Ranks in the QVM StockRank's blend has not significantly harmed performance of the latter over a prolonged bull market period which has favoured momentum. This makes me hopeful that if market conditions should change in the future, for example if there is a recession and/or a bear market, so that the Momentum Rank performs relatively poorly compared to the Quality and/or Value Ranks, then the QVM StockRanks blend should still perform reasonably well. That's relative to the market as a whole, of course, which might not be much consolation if everything is falling!
Great stuff which I will have to take some time to properly read through. But to provide an anecdote. I recommended Stockopedia to my uncle as the platform is very easy to use. The second reason is that I think the ranking system provides a good wake up call on questionable stocks.
His feedback was something along the lines of "I see these tips and recommendations in the press and then go to Stockopedia and see they are rated as a load of (*£&$£ [insert expletive]." So I think it has been very helpful for him to not get waylaid by media tips and story stocks (although a few story stocks a good).
The only thing I would say is to improve the ranking system by focusing on risk. Happy to explain how if someone contacts me. For a number of reasons I think volatility is an inadequate measure of risk (backward looking). You could easily have a fourth ranking score with risk. It would include things like the operating margin, capital intensity, financial gearing, long-term track record and you could also put volatility in there perhaps.
This metric WOULD have picked up Conviviality for example which was a low margin business with significant financial gearing. However, the Stockopedia Quality metric had it rated over 90 at one point (not sure how). I would look at how Conviviality could have been as high on the quality metric. But more importantly I would introduce a separate risk ranking using mainly fundamental data.
To be clear, this is not a criticism it is just an idea for one area that things might be improved. Things will go wrong in most systems with stocks not working out. But if there were things that could be improved so that bad stocks don't slip through the net I think they are worth looking at.
Lastly, and perhaps this has been mentioned but if not here goes. If you then have four factors - quality, momentum, risk and valuation - you get the overall Stockrank. However, different investors may feel differently about each factor. So maybe they should be able to weight it themselves to get the Stockrank they would prefer. Somewhat risky for people to do themselves but a possible idea. I.e. so if I am a low valuation and quality investor these are more highly weighted in my overall Stockrank that appears on every page for a stock. Could still keep the default Stockopedia Stockrank on the page too perhaps.
My feelings:
Quality can't be arbitraged away by the market. If a stock is intrinsically growing its NAV and earnings this must eventually be reflected in the price in proportion to the underlying growth.
Momentum is obviously partly simply the price reflecting the underlying quality but also might contain herd behaviour that will fade away again. In the real world, Quality without Momentum might mean that there is something that the fundamentals are missing but the market has noticed, and Momentum without Quality should give you pause to wonder whether it's just a bubble. But Quality plus Momentum is a very decent combination.
Value is the metric which is most likely to be arbitraged away by an efficient market. Although a high V can protect in a downturn, it can also be a sign that a stock is going to fall even further. In fact V>85 is often a warning sign. High-V stocks have a bad habit of getting worse. On the other hand, when 25<V<75 (or since good stocks tend to be skewed towards expensive, 10<V<60 can work better) the stock in question is fairly priced and well away from the extremes where strange things can happen. As a bonus, middling V usually also means lower volatility. I think of it as being like trying to go straight down the middle of chute rather than bouncing wildly from side to side.
Rob Arnott, who's a factor based manager, has done some research on the long-term trends across growth and value stocks. He did this by going back 50 years to look at the stock valuations then and then tracked forward to see how those valuations panned out in terms of returns to shareholders. He called this Clairvoyant Value.
What the analysis showed, over 50 years of the US markets, was that value stocks and small cap stocks outperformed growth and large cap. But the research threw up two really interesting findings:
Now there are a lot of assumptions in this research and I certainly wouldn't want to hang my hat on it, but in an environment where we have to pay quite heavily for quality and value is being largely discounted I think it would be a very brave assumption to entirely discount it. Paying large multiples of earnings on the basis of future growth is relatively risky, and always has been.
Sadly we'll only know for sure in 50 years time. I won't be around to see that, but maybe some of you will ...
timarr
Ed, it would be interesting to see similar analysis / commentary and charts for the US version of QVM performance. I still don’t understand how SP outperforms almost all deciles.
Lucas, QVM hasn't worked in the US due to the failure of Value Investing in the States over the past 5 years. The more favourable strategy has been in the QM stocks, the so-called 'High-Flyers':
See slides 99-100 in the presentation: http://img.stockopedia.com.s3....
I can perfectly understand the desire to extract an average of high stockrank averages, with appropriate sector spread as a route to investor gains.
Unfortunately, as with all experiments they general require a varying set of conditions in which to test their veracity. So Howard's cautionary comments above may well be relevant, but only time will tell. I appreciate that much of the research backs up the hypotheses of the stockranks approach, but still a relative bull market is not the ideal time to critically test it in.
Is it wise to pin your hopes on a verifying stockranks as a performer? There is a danger at a future date that without independent analysis of performance, headline performance will be slanted by the human perspective of wanting to see our ideas vindicated. For example taking Paul Scott's experience, having lost a huge amount of money on investing, as he jokes, he is now brilliant again. But take those two periods together and you might argue it was better to stay in bed, and put it in a fund/tracker.
I don't know if my stockpicking stands analysis over the long term. For example when I last measured my gains I was 20% up overall some months back, but the market moved, and I am back to overall marginal gains, and losses, which have eroded that 20% to something which I haven't yet dared look at (loss aversion).
However, what I get from Stockopedia, is the constant reminder of the monkey mind approach to investing, is extremely hit and miss, so gradually I am trying to carve a suitable mixture of appropriate risk and caution, which is my natural characteristic overall, I would say. But I don't think many of us find it easy to stick to a regime, and we need constant education.
Great article & presentation Ed, the last 5 years have been a resounding success.
The Quants at JP Morgan have attempted to overlay the common factors identified in your presentation onto an economic cycle. Their findings suggest that a portfolio of high StockRanks will not always be the best strategy:
Past experience suggests that when emerging from a recession, counter intuitivity is called for - you want to be buying the lowest Quality, weakest Momentum, highest risk stocks. These will typically be 'bombed out' cyclicals. Think Persimmon, Travis Perkins or Topps Tiles in 2009 as we emerged from the last recession.
The Stockranks efficacy will likely get turned on its head at some point in the next five years. Which will be a shock to any investor extrapolating the past five.
Hi Howard what they are indicating & you have identified is the tendency for Quant / momentum based strategies to "crash" at inflection points. As someone who worked for a quant fund management house that had a similar model to the Stock Ranks I know this happens having seen it on a couple of occasions over the years. There is a research paper exploring this for the technically minded here - which looks at the factors behind this.
This is more of a problem for fund managers who then have to explain sharp under performance to their clients - may be less of an issue for PI's who are probably more worried about absolute performance.
In terms of using the Stock Ranks I think it is instructive to look at the performance of the QVM deciles for >£50m which is a minimum size threshold that many serious private investors use. It is noticeable if you select varying time frames that the 50-60 decile does surprisingly well. Thus personally I tend to go for a diversified approach and hold positions down to a 50 rank to capture the factors rather than aggressively chasing and re balancing to the top deciles all the time.
The net effect of this that on average I should be holding stocks that are more likely to outperform, while if you weed out or don't buy those ranked less than 50 then this helps you avoid the losers, which is often more important than picking winners and also keeps your trading costs down. I happy to accept that this may not deliver returns as high as actively trading the top decile, but makes for a more relaxed way of managing a portfolio.
Thanks for the research Jamie, not a paper I've seen before, will read with interest.
Ed actually refers in his presentation to the 'intermittent crashes' of momentum as contributing to the risk within this factor & hence possibly one of the reasons for the persistence of it's superior returns.
Personally I have had only a little over six months exposure to StockRanks, but during that time I have to say that they, together which much of the excellent content and discussion surrounding them, have helped me immensely on a investment journey I was undertaking. My primary objective over the last 18 months or so has been to improvement investment performance mostly by eliminating 'mistakes', many of which I was already in one sense or another already aware of, but others which have become more apparent through study of SRs. I also think i have learned some new tricks from Stockopedia too.
The reason, however, to chose Howard's post to respond to is that I do think it is important to recognise two things about this stellar five year performance.
1. StockRanks are relatively young. Although the principles on which they are based are as old as the hills, I have never before come across such a clear and compelling codification of factor investing. This does present this risk that the benefits could be arbitraged away, although I have at least two reasons to think that may not be case (but that is maybe for another time).
2. The stupendous performance has occurred in (predominantly) as single 'type' of market (AKA market phase.)
So it is appropriate, imho, to flag that one needs to be constantly on the look out for any change in performance and judge whether it is a 'blip' or whether SRs have "stopped working". (My personal view is that whilst there is a chance they may at some time be less effective, I'm doubtful they will "stop working" overall - but again that is perhaps for another time).
At Mello South this week, Guy Thomas included an excellent review (I'm sure many have seen similar references before) that 15 year out performance by a "fund manager" is absolutely no predictor of future performance - why would the same not be true of a "method" ?
Ed is always at pains to include within these discussions “past performance is not an indicator of future returns” and whilst I am absolutely sure that Ed includes that as a genuine caution, I'm equally sure that many readers treat that in the same way they treat the T&Cs and privacy statement of any website they register for!
So just to be clear, StockRanks could stop working tomorrow and everyone is at their own risk on that and needs to take there own view; I have my own thoughts on this and lets just say I expect to be making increasing use of them over the next year.
But coming back to Howard's post: that is a really useful JP Morgan chart (thank you for that), but it is worth examining what it actually says about the specific factors making up the SR, as to me it does not support the likelihood that "The Stockranks efficacy will likely get turned on its head at some point in the next five years."
Here is an overlay of the SRs and styles
So in fact, whilst JPM's analysis does suggest different weightings of the factors in different market phases; in three out of four phases they effectively think that a Stocko "winning style" is king.
In the "Recovery" phase their view is effectively that a loosing style "Value Trap" prevails (aka - Cheap, Unloved, Junk).
Whilst I am sure that over-peformance against the market is equally attainable in this market phase I would (with an undue degree of hyperbole) that it really doesn't matter in this phase. "Virtually everything" has stopped going down by this stage and "most stocks" will rise aggressively, the only way to lose in this market is to not be in it. [For the avoidance of doubt that last sentence is dangerous nonsense, but if you turn the volume down 50% - and have a diversified portfolio - I would largely hold it true.]
So whilst, if accurate, the JPM view suggests that "QVM" is only best in 1 market phase out of 4 (ed by the way makes the point that Q=100,V=100,M=100 stocks do not exist) they do suggest that winning styles are best in 3 out of 4 phases and in the other phase [my repeated hyperbole] everyone wins.
So to borrow a phrase I first wrote a little over a decade ago, my stance here is "proceed with caution".
You might try to be clever and adjust the QVM weightings based on which market phase we are in, but as I mentioned recently in another thread for me personally whenever I try to judge which phase we are in, the benefit of hind-sight invariably informs me that I was 1 phase ahead or behind reality.
So thanks Ed (& team) for this fantastic resource it has taught me much and I for one am confident to proceed cautiously with it.
Very interesting but its not always obvious which market environment we’re in!
Perhaps slowdown now as QM High flyers seem to be doing well but is value about to make a comeback?
Another issue is of course JPM are referring the economic cycle. This can both lead or lag movements in the stock markets (although as of late downturns seem to have been caused by stock market crashes)
Gromley you beat me to it and your amendment to the schematic captures the point very well. JPM are not saying that QVM investing doesn't work at certain stages of the cycle but rather that the emphasis on the Q, V, M components should change over time. I had understood that Eds team were doing work on some sort of cyclical adjuster to take this into account.
Also I would contend that the issue of whether or not SRs 'work' in the long run depends on how you use them. I view them as a sophisticated screen rather than a system to be blindly followed.
Re: JPM Quant Investing diagram with StockRank styles overlayed.
Firstly I think there's a slight typo in the StockRank overlays on the diagram.
In the expansion phase, it's low Q, high VM which is classed as a Turnaround in the Taxonomy of StockRanks
Secondly I just don't see the evidence for the JPM argument .
Here's a chart for the S&P 500 since 2004 ...
I'm not sure what you call the uptrend from Spring 2009, is it all Recovery or 50/50 Recovery/Expansion? Maybe the Recovery phase is 2009 up to early 2013 and then the Expansion is 2013 to date (which is the period that the Stockopedia data covers)
JPM would suggest during this bullish trend that ValueTraps or Turnarounds would be outperforming? But that hasn't been the case over that period, well certainly not from 2013 according to the Stockopedia data.
Using the Stockranks performance tool with parameters of > £50m mkt cap and quarterly rebalancing on the UK market on the data set from 2013 to date we see ...
QVM (SuperStock) +141%
VM (Turnaround) +138%
QM (High Flyer) +130%
Value (Value Trap) +94%
Maybe this isn't an accurate picture as selecting Value as a parameter in the Stockranks performance tool doesn't mean that all the stocks selected would meet the criteria for the ValueTrap label (High V, low QM). So it'd be nice to have a Classification performance tool too.
I wonder if there's any bandwidth in the Stockopedia team to crunch the numbers for us to see if there's anything in the JPM analysis?
Phil
I have some doubt about the labels in that JPM diagram too. They look like the kind of classification you can only clearly delineate after the event when you look back. Then you say "Ah-ha! There is where I should have switched from high momentum to low momentum."
There's an old joke they used to tell when teaching about stochastic processes (essentially what we are dealing with here):
"How do you make perfect toast?"
"Grill it until it burns. Then five seconds less."
The point being that you only know the key bit of info you require too late to be able to act on it.
I take the JPM chart literally i.e.
So looking at the UK ONS data for the last UK recessionary period 2007-2009:
3Q/4Q 2007 : EXPANSION
1Q 2008: SLOWDOWN
2Q,3Q,4Q 2008: CONTRACTION
1Q, 2Q 2009: RECOVERY
3Q 2009 - 2Q 2010: EXPANSION
(NB to answer Nick Ray's valid point re the difficulty of knowing where you are in real time, it is true that there are long lags in the publication of GDP data. Instead, the monthly PMI data (manufacturing & services) can be used to reveal acceleration/deceleration in growth rates.
The JP note stretches to 124 pages i.e. it is thorough! It is based on a back-test of 20 years of European Equity data 1997-2016.
The other thing to note is that they favour looking at factor risk-adjusted returns, not absolute returns. So even if we had Stockopedia data from 1997 for European Equities, we'd still need to calulate the Sharpe ratios assess the quality of JPM's conclusions.
I'm happy to email you the note if you're keen on reading it.
Hi Ed
This is a really good clear overview of the performance of your ranking system. I was also at your recent marathon webinar.
But when I looked at the Value Rank plot in point (2) it triggered my spidey senses. The Q and M plot show the returns passing through zero near the 40%-50% rank - that is close to the median value. This makes intuitive sense given the way that the rank is computed.
For the Value plot it passes through zero at the 10%-20% mark which seems "curious". However, even more curious is that the Value Rank when I analyse it does not behave the same way as in your data. In particular high Value Rank stocks do not out-perform strongly in my data.
So what is going on? Fortunately Stockopedia provides options to customise the performance graphs and after a bit of playing with the options there seem to be two key factors at play.
Firstly, I usually only look at stocks with a market cap > £100M. The out-performance of high Value Rank stocks seems to be most strongly present in the range below £100M and weaker above that level. Perhaps because larger MCAP stocks are more efficiently priced in the market.
Secondly, a large part of the out-performance of high-Value Rank stocks comes from 2014. If you look at periods shorter than 5 years it disappears. But if you include 2014 it re-appears. And in fact you can see quite clearly on the Stock Rank plots how much better high Value performed in 2014 than low Value. (See https://www.stockopedia.com/st... and play with date range and Min Mkt Cap)
If I plot the market indices for 2012-2018 (see below) it becomes clear that 2014 is the only prolonged bear period in the last five years and it is here that Value has proved its worth to the point where it can pay back for any under-performance in other years. An interesting and cautionary lesson perhaps - about markets and about data analysis!
Ed and Stocko team
Stockopedia has been a life changer for me.
I also have a suspicion Stockopedia has been a significant helper to many, many great micro, small and medium sized companies across the UK.
Through your efforts and the platform you have provided a great resource through the use of which many of us can direct investment funds towards such companies.
This I believe is very important, because, after all such businesses are the absolute foundation stone of our economy.
I thank you for what Stockopedia has done for me, but more so I truly hope you gain wider recognition for what you are doing to contribute to the development of the economy of the UK.
Regards
Howard
Congrats Ed & The Stocko team for the 5 year anniversary. A great job!
I've been reflecting on point 10 and the example you cited using Dart Group & Synety. I think ego is playing a huge part in this. A look at those two charts in late March (Dart breaking out and Synety plummeting)
Do I chose to buy into Dart?
Ego says ...
"I don't want to over pay."
"The ship has already sailed"
"You're late to the party"
"It won't last"
"buy low, sell high"
Do I chose to buy into Synety?
Ego says ...
"It can't go any lower"
"It can go only go up"
"I've spotted the bottom"
"It's a bargain"
"I can't lose"
I think the shift in thinking for me was recognising that I have to be prepared to take losses on some selections. That is so freeing.
I can manage the anxiety in choosing that path by cutting losses quickly. Once I freed myself from 100% winner mentality I could challenge the ego commentary on stocks such as Dart. For example, ego might say "that ship has sailed" my response is "perhaps the party has just started, let's make a more informed judgement when I come to sell"
I think the experience of using this strategy emboldens and increases confidence in the approach. But the caveat is that the market has been generous to strategies that involve momentum and that might/will change at some stage in the future.
Best of luck to all
Phil
It's known as loss aversion, there's a ton of research out there detailing the impacts. A lot of Tversky and Kahnemann's original work on prospect theory was based around it back in the 1980's. They showed that people dislike losing so they sell winners to lock in the gains and run losers in the hope of making their money back. Given the persistence of momentum effects that's usually the exact opposite of what investors should be doing.
Learning to cut your losses and move on is a key investment skill. I think it was Soros who said that he had twice as many losers as winners, but when he lost he lost small and when he won he won big.
timarr
The biggest change for me in my investing inspired by the stock ranks was to pay much more attention to momentum. Previously I was classically fearful of buying when a stock is soaring, feeling I have missed the boat. I preferred a value investing, bottom fishing style. Unfortunately I lost much of my active equity investing performance data after google finance decided to downgrade and is something I desperately need to look at, but my overall portfolio continues to outperform a multi asset index tracker with similar asset weightings - circa 12% annualized performance over 3 years vs 10% for the Vanguard Life Strategy 80% since using stockopedia as my main resource for investing.