The StockRanks Jump Effect - 20 shares that jumped 90+ in recent weeks
Here at Stockopedia we’ve built a community around a stubborn, evidence-backed idea - that good quality, moderately valued, trending shares - the kinds that carry a high StockRank - have a powerful tendency to beat the market. Since launch, UK shares sitting in the top StockRank decile (a rank of 90 or more) have returned about 12% a year on average before dividends. And we've shown with strategies like the NAPS portfolio that there are simple, rules-based ways to capture that kind of return without staring at the screen all day.
But one question crops up again and again. If a high StockRank is good, is a sudden jump into the top ranks good too - or have you already missed the move by the time the rank catches up?
I’m going to answer that properly in a full webinar on 23rd July (do sign up here) - it’s the deepest piece of research we’ve done on the subject - so please do join. But in the interim, I couldn’t resist giving you a sneak preview, with a list of some recent jumpers as examples to think through.
90+ jumpers do seem to have an edge
We measured every time a UK share’s QVM StockRank jumped across a 90+ threshold in a single week, going back more than a decade - thousands of events, including all the (very many) delisted and dead companies kept in the study so nothing flatters the numbers.
The headline is that the average share that jumped 10 to 20 points to a StockRank of 90 or above went on to return about +15.9% over the following twelve months, against +10.7% for the shares that were already in the cohort. That is a +5.3% edge simply by arriving newly into the 90-100 zone. Bigger jumps, up to around 40 points, did even better still.
Beyond this, when we tested the 90/80 rule - i.e. buy the jump into 90, and sell on the first weekly close back below 80 - it compounded at roughly +18% a year, net of our best measure of dealing costs (spread, stamp, commission). The 90/80 edge comes from holding the big winners longer rather than selling on a 1 year clock.
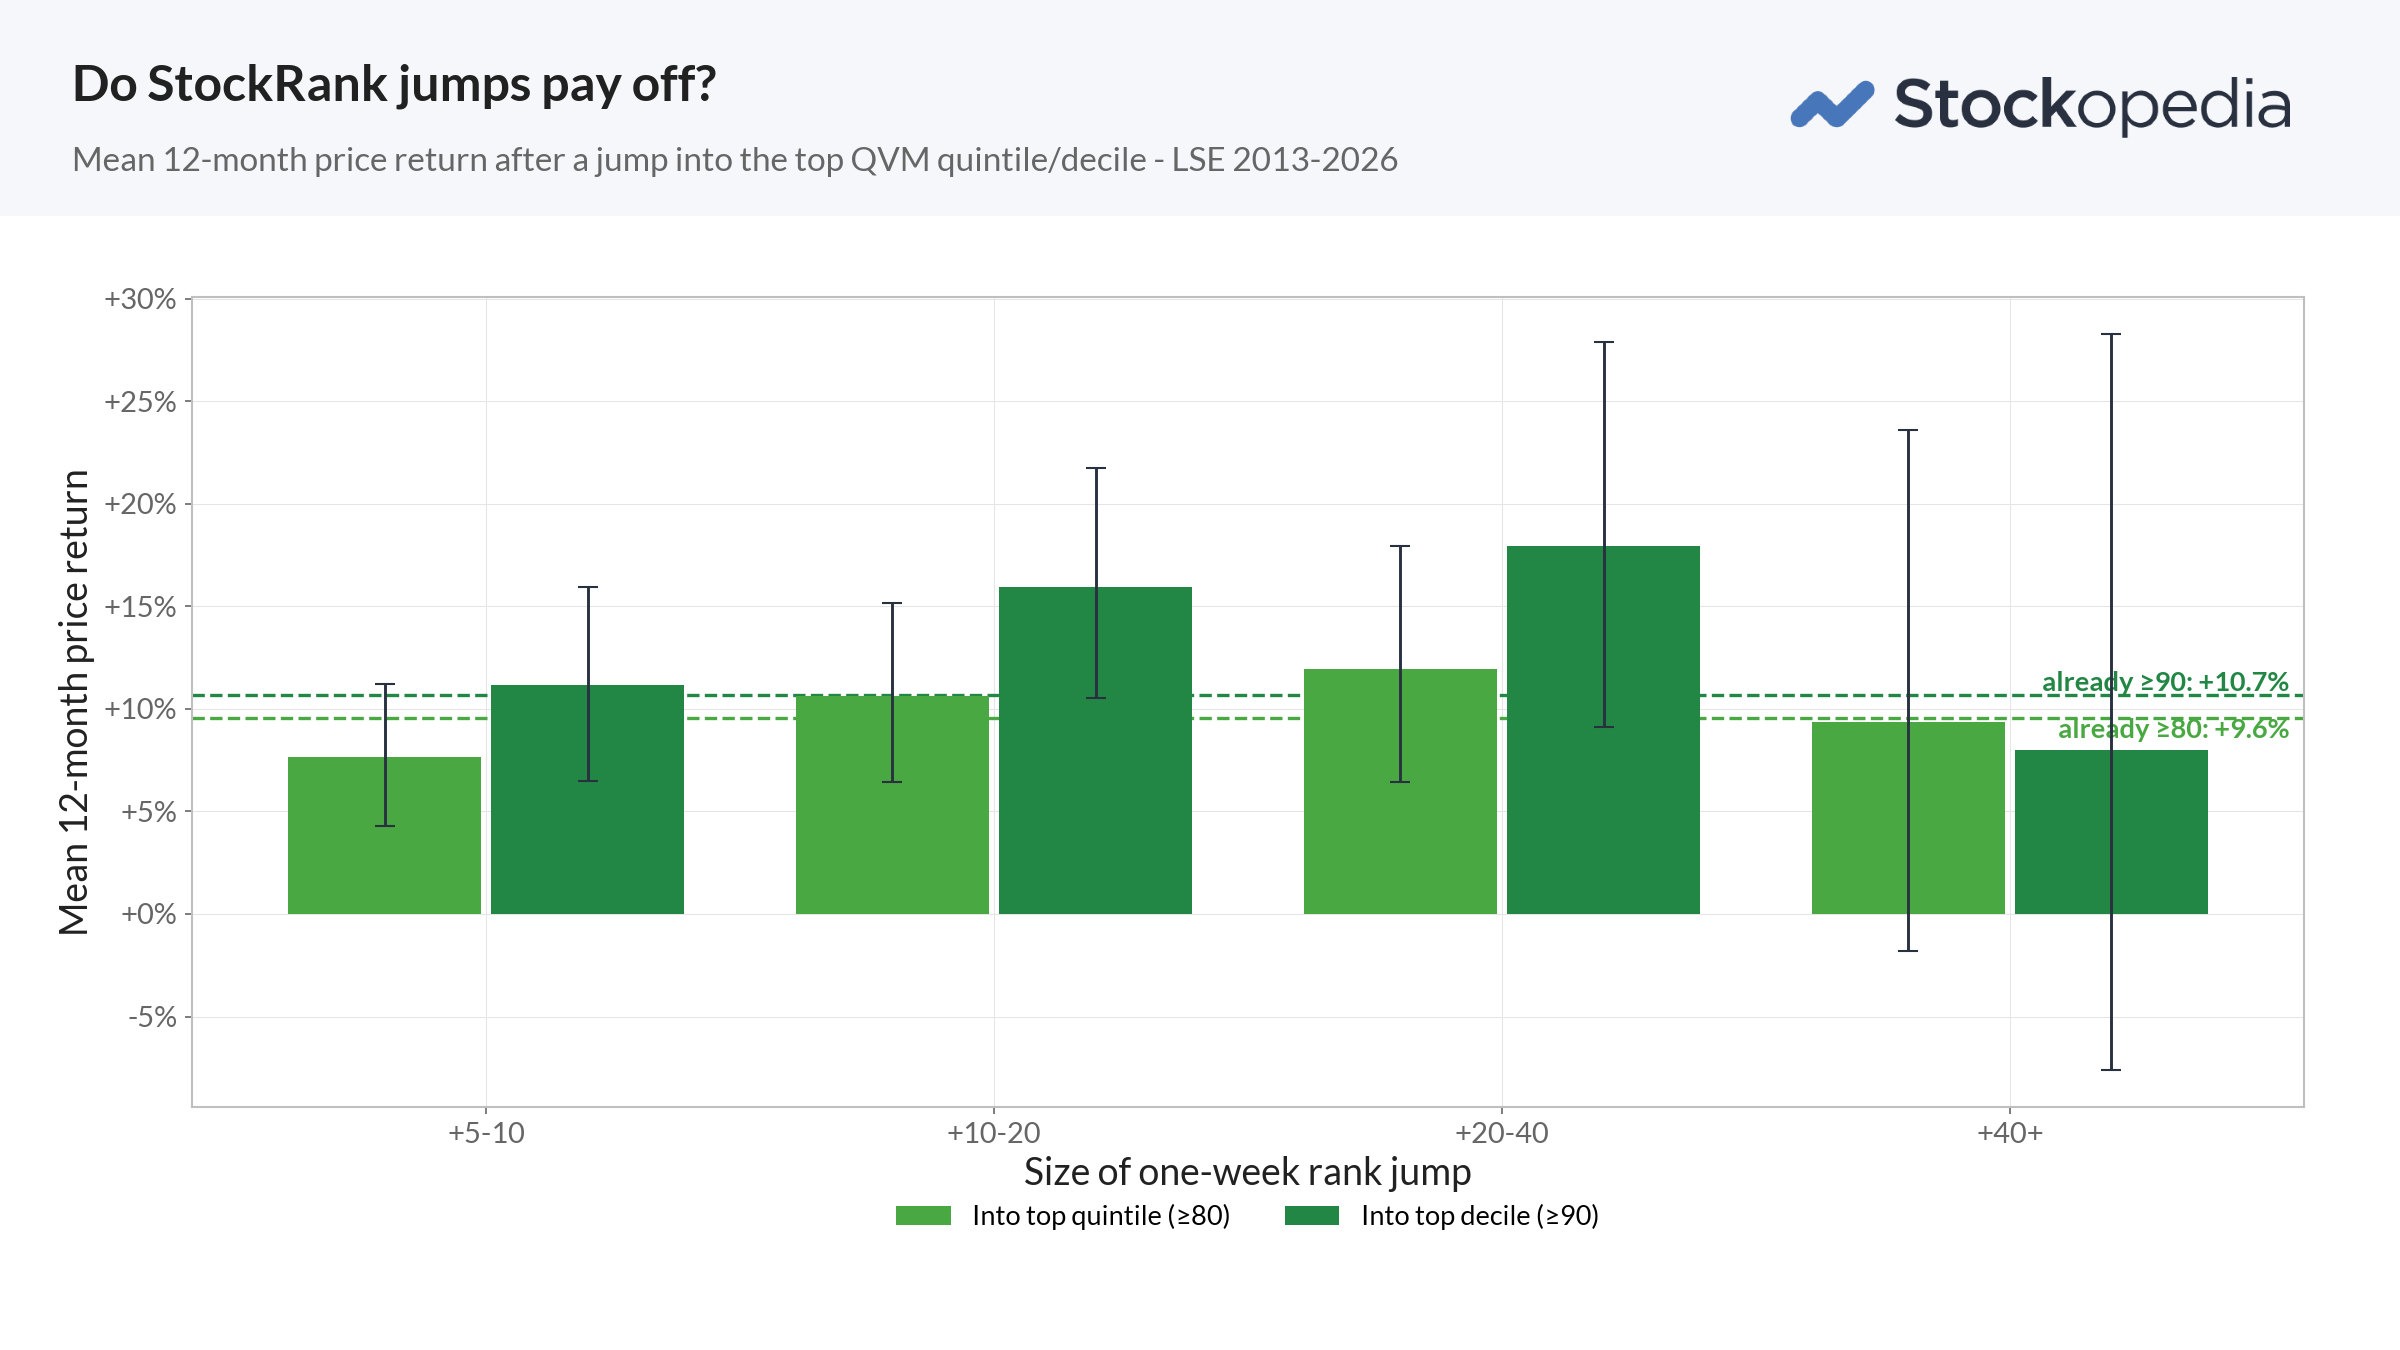
Three caveats up front, as I need to be honest:
- It’s a basket effect. The win rates are only in the 53% to 61% range, so many individual stocks with big jumps do go backwards. The edge lives in the big winners rather than the average share. Much like the NAPS, if you own about 20 you have better odds of capturing one of the big winners.
- It’s a small and mid-cap effect. Above roughly £350m market cap the edge lessens.
- It’s a backtest. The future won't be like the past, it will be better. Jokes... the UK market is very different now to 10 years ago. The effect may fade.
In a heatwave, do you need a jumper?
So who has actually jumped this year? Below are the most recent jumps - moves of 10 or more points landing at a StockRank of 90 or above. Have a browse.
| Company | Jumped | StockRank | Jump | Market cap | Sector |
|---|---|---|---|---|---|
| Amigo Resources (AMGO) | 24 Jun | 80 → 90 | +11 | £33m | Gold & rare earths |
| Castings (CGS) | 23 Jun | 85 → 97 | +12 | £143m | Iron castings |
| IG Design (IGR) | 20 Jun | 70 → 94 | +24 | £76m | Gift & celebrations |
| Zegona Communications (ZEG) | 17 Jun | 62 → 96 | +34 | £3.8bn | Telecoms (Vodafone Spain) |
| PayPoint (PAY) | 17 Jun | 72 → 94 | +21 | £339m | Payments network |
| Hollywood Bowl (BOWL) | 29 May | 67 → 91 | +24 | £513m | Leisure |
| Synthomer (SYNT) | 29 May | 81 → 93 | +12 | £182m | Speciality chemicals |
| Bloomsbury Publishing (BMY) | 22 May | 71 → 90 | +19 | £519m | Publishing |
| JD Sports Fashion (JD.) | 22 May | 80 → 93 | +13 | £3.7bn | Sportswear retail |
| Dr Martens (DOCS) | 20 May | 75 → 93 | +18 | £643m | Footwear |
| Premier Foods (PFD) | 16 May | 81 → 93 | +13 | £1.8bn | Branded food |
| Autins (AUTG) | 8 May | 66 → 91 | +25 | £6m | Automotive insulation |
| Metals Exploration (MTL) | 7 May | 85 → 95 | +10 | £399m | Gold mining |
| Zotefoams (ZTF) | 6 May | 79 → 90 | +11 | £195m | Speciality foams |
| Halfords (HFD) | 2 May | 82 → 95 | +13 | £326m | Motoring & cycling |
| RWS Holdings (RWS) | 25 Apr | 79 → 92 | +13 | £347m | Localisation & AI data |
| Bunzl (BNZL) | 17 Apr | 79 → 91 | +13 | £7.6bn | Distribution |
| Princes (PRN) | 11 Apr | 27 → 95 | +67 | £924m | Tinned food & drink |
| Strix (KETL) | 11 Apr | 81 → 95 | +13 | £89m | Kettle controls & water |
Bold market caps are inside the sub-£350m band where the historic edge was strongest.
Four themes emerge from the list
One thing I've been doing with every list we publish is figure out the themes emerging from the factors. If you can see commonalities in the themes the market is rewarding, or get ahead of the crowd into emerging themes, you can do seriously well. AI infrastructure stocks were moving years before anyone know what the term meant. What can we see in this list?
- Cheap, cash generators. Companies are beating low expectations and handing excess cashflow back - rising dividends, and buying back shares. Premier Foods (dividend up 20%), JD Sports (a 20% dividend rise and buybacks), IG Design (dividend payer again and a 10% buyback), Hollywood Bowl, Strix, Bloomsbury and PayPoint all are here. Share prices are too cheap in the UK - and companies themselves know it. I think probably one of the best indicators of an acquisition candidate is whether a company is buying back its own shares - if a company is eating itself, it's a good flag it's too cheap.
- Turnarounds at inflection points. Many are recovery stories where the numbers have finally turned. Autins is too small to trade - but it's just back in profit. Castings, Halfords and Dr Martens are all repairing margins - even Princes with a big swing to profit and 67 StockRank jump. This is the StockRank doing its job - flagging when the numbers are turning.
- Gold and hard assets. A small but distinct cluster. Metals Exploration we all know well from its recent years in the NAPS. It's nearing first gold at La India, and Amigo Resources has been pivoting into precious-metals processing. Both small, benefiting from firm gold prices and with real production rather than old fashioned exploration hope.
- Can the AI threat become a tailwind? RWS - long feared as a translation business being eaten alive by AI saw a 45% surge in its AI-data training revenue. Bloomsbury’s academic arm has doubled profits, helped by an AI licensing deal. AI might eat the world, but it's data hungry, and businesses with IP may still have a fighting chance of positive surprise.
If anything a jump in StockRank does seem to help in highlighting inflection points. Yes you can spot "ahead" / surprise announcements in the news, but if you are anything like me, you might not be paying attention every single day. I find that I always look for significant jumps in the StockRanks in the chart beneath the price chart on the stock reports. It always indicates that something significant has happened, new results or new coverage - it's a great trigger to go and do the research on a share and identify what's changed.
Why does the jump effect exist?
You would think that the moment a company publishes good results, an efficient market would reprice it. For the largest, most-watched companies, that may be true. But for smaller, less researched shares, it isn’t. Information really does diffuse slowly. Post-earnings-announcement drift, which we've explained relentlessly in our "ahead of expectations research" - is the idea that prices keep drifting in the direction of an earnings surprise for months. Markets underreact first, then catch up gradually.
And the effect is strongest where institutional investors struggle, but private investors have an edge - amongst small caps.

Now these numbers do look too good to be true - and I must caveat that the chart above does include a handful of sub £10m market cap companies - if I remove them, the 10-20 and 20-40 small cap jumps remain 20% annualised. And a £50m-£350m range still gives a 10-20 jump effect at above £15% annualised (before dividends).
The slow diffusion of news is the engine under the jump effect. A StockRank jump is, in effect, a signal that there's been a fundamental shift - normally due to new accounts being published or a significant change in broker sentiment. In a neglected small cap, that change gets recognise over months, only partially on the day. If you can buy early - there's a premium to earn due to the neglect of other investors.
And when it really works, it really works. In the study, Rolls-Royce Holdings (LON:RR.) jumped 27 points to a StockRank of 88 in early 2023 - right as its turnaround began - and went on to return about 147% over the following year. The little neglected ones can move quickly: Yu (LON:YU.) jumped in October 2022 when it was just a £34m market cap and rocketed 493%. In each case, the rank was the first salient signal that something had changed.
What do you think?
Please do join me at the webinar. The full research - the methodology, the testing, the sector and size breakdowns and the exit rules - will all be revealed on 23rd July. It will be great fun... if only to rue the ones that got away and promise ourselves that we'll pay more attention next time.
In the meantime - if you know anything about the stocks on the above list. Do any of these jumps really matter? The truth is, you have to pair a great jump with a great story. Multibaggers are driven by more than just a StockRank - they need a secular change, an industry shift, to really move. And recognising the big winners in advance pays for all the losers!
Please do share your thoughts below - honestly, its the quality of the community engagement that drives the research and my own curiosity.
Disclaimer
This is not financial advice. Our content is intended to be used and must be used for information and education purposes only. Please read our disclaimer and terms and conditions to understand our obligations.

62 comments
Has this back test been run on US and European stocks? if so what was the outcome?
This sounds fascinating. Can’t make 23rd as I will be away on holiday. Will you be recording it for people to watch later? Please?
If you register for it ( see link at bottom of the "Today" page), Stocko usually send a link with the recording after the event. I can't make the date either.
Thanks Wigge.
I note Severfield (LON:SFR) are up 16 today, not sure why, results were 2 weeks ago, can't see any forecast updates, recently.
Dialight (LON:DIA) is a recent example of a sub-£350m company whose StockRank has Jumped from 63 (23 June) to 89 (30 June) = +26 points in seven days. Read against Ed's article, it looks like a near-textbook case of YE accounts causing the Quality Rank and Momentum Rank to re-rate together.
Ed's back test shows a basket of newly-arriving >90 SR "10–20 point Jumpers" returned ~16% over the following 12 months, and that bigger jumps — up to ~40 points did better still, delivering an average ~25% gain. Dialight's +26-point move sits squarely in that better-bucket cohort.
The interesting question is where Ed’s 12-month 16%-25% gain came from: multiple expansion, and/or further earnings upgrades over the year? The big % winning cohort may have achieved a significant second leg of upgrades — the initial jump was a re-rating, but the outperformance may have come from earnings being walked up if the improvement persisted.
That's the fulcrum for Dialight (LON:DIA) . The 23–30 June move is almost entirely a multiple re-rating. What's proven so far is a quality leg momentum improvement; the earnings-upgrade leg is not. The swing to profit is margin and cost recovery, but their revenue is essentially flat.
So the second leg depends entirely on Dialight’s ability to generate additional sales. I share the view of the CEO, who's driven a 2-year Dialight turnaround; “I think we’re at an inflection point”, pointing to the growth seen in the 4th quarter and the return of sales momentum. See IMC : https://www.youtube.com/watch?v=hOWzQWTh1oQ
Was the Nov 25 jump the really early sign of the potential pick up in SP?
Yes you are right. Dialight (LON:DIA) Nov 11th SR was 41, but by Nov 18th it was 81 SR (+40).
The trouble is that Ed had'nt done the SR Jump analysis at that time. But this does not mean that the opportunity is missed. A sequential, step-by-step re-rating is the signature of a genuine recovery rather than a one-off pop, and it's the big point increase cohort that may get a signifigant "second leg".
Hi Ed & team, thanks for this article - very compelling!
Looking forward to the webinar
There are lots of requests below for a screen and Stockrank movers report, which would be useful. Can I also suggest that you add Stockrank over time as an overlay on the charting tool as well? You show the stock rank over time on the summary chart on the StockReport page, but you’ve got no way of see the SR movements against price and volume in the charting tool. So a StockRank overlay would be REALLY useful.
Also - just another plug for an SMA on the volume overlay as well, please? That would be really useful too.
Agree on your last paragraph regarding volume
I'm looking forward to the webinar, as this looks like useful data.
However, combined with last months webinar, it does highlight a big gap in the usefulness in the way stockrank data is presented (or not in some cases).
Unless I'm much mistaken, it's not possible to view data such as the combined ranks (QM, VM etc) on the stock reports. Sure, you can screen them, and add them to a report, but when there's quite a low limit on the number of columns that can be added to a report it's easy to run out.
Another poster mentioned the inability to view historical stockrank data (in fact it was removed).
Considering the Stockranks are Stockopedias unique selling point, I feel much more could be made available to the user.
It will be very frustrating if this webinar highlights more data that is only available via the backend.
You can compare the stock rank of today vs yesterday using compare advance screen.
so stockrank greater than 1.05*stock rank previous day would get all movement of more than 5%. 1.1 is too much as previous stock rank would be 90 or above
add sr previous day less than 90 in screen
Was struggling to find out how to do this. Thanks
Edwords, thank you for the article and appreciate if you clarify the below
1)10-20 will gain 15.9%
2) 20-40 gained more (how much more ?)
3) 90/80 rule -18% gain ( is the 90 jump, 10 -20 or 20-40?)
4) 10-20 under £350m mcap - 22% gain
5) 20-40 under £350m Mcap - 25% gain
(how much did point 5 above gained with 90/80 rule?)
( point 4 &5 include sub £10m if you remove them you will get 20% on 10-20 and 20-40 . 2 question from me : one, why removed them if its giving better results and how come hear the two bands are the same ?)
final question , was excited from the first part of article , easy way to make a nice return no need to research just check the stock rank and bingo but you alluding the stock rank just giving a lead to research the companies that have a high rank , which one is true ?
Thank you again for the great website which i gain a lot in the last few month
Hi Shai, thanks for such a thoughtful read of it, and really glad you're getting so much from the site.
I can confirm the first one for you: yes, that 10-20 point jump into a 90+ StockRank averaged +15.9% over the following year, compared with +10.7% for shares already sitting up in the 90s. Ed's away on holiday at the moment, so I'll leave your other questions (including the best way to actually use the signal) for him to answer properly when he's back. A lot of it is exactly what he's digging into in the 23 July webinar too.
Hi Ed,
so glad to see this being addressed.
It was the first addition I used to the excellent base Stockrank system when I initially joined around 10 years ago. It was also the reason I stuck with the Old system 'til the bitter end to use the report below as many of my purchases were based on this jump. Repeated pleadings to include it in the new system fell on stony ground sadly, also a request to change the default on the new screen from a day (totally useless) to at least a more reasonable month.
It really pains me to note later that I've missed out on a Stockrank jumper (subject to other filters) preceding a big rise, LUCE in March being a good example. Gawd knows how many I have missed since the system change, it's just not been possible to monitor every day.
Anyway, looking forward to any developments in this area now.
Good luck, Simon
I would like to add my voice to the call for the return of the adjustable Rank Movers screen . .. As Goldilocks might have said; "One Day is too short, One Month is too long, One week is just right".
I can attest to the screen's effectiveness, particularly in a bullish market, where the M (Momentum) change element came into full play. The Movers screen more than paid for the Stockopedia subscription in itself. Please bring it back.
You can check stock rank change over a month by hovering over the stock rank number in the right corner panel in case people were not aware
I have assessed the shares listed in the table and currently at the moment this is producing a return of 0.3%, which is only this high because Halfords is up 56%. I also have tracked momentum shares over the last 18 months, and currently have found they are underperforming nearly every week of this year, after massively outperforming every week of last year. Ed mentions in this article that the Stockopedia research goes back years, so I`m looking forward to the webinar where hopefully he will demonstrate the long term value of this strategy. I believe last years results with this strategy would be phenomenal for the shares which moved for momentum reasons. I`d also be interested to know whether this strategy works best if the reason for the 10% rise in stock rank is due to rises in Quality, Value or Momentum Ranks. From the current table 9 moved because of Quality Rank, 5 because of Value and 11 because of Momentum (some of these were combinations). I also think it would be interesting to work out whether there was a catalyst in the news prior to these weekly stock rank rises.
RWS Holdings (LON:RWS) soon crashed down.
The jump in April, after the trading update, was momentum driven. The results reversed the enthusiasm
Synthomer (LON:SYNT) also crashed soon after, seems some of these jumps, soon fall down.
Synthomer (LON:SYNT) is the opposite of RWS Holdings (LON:RWS) . The jump followed results where there was a small increase in Quality, 36 - 45, and a substantial increase in Momentum rank, 4 - 55 and then on to 88 at the end of May. The enthusiasm then dissipated during June, and wasn't re-ignited by a moderately upbeat rading statement. I remain suspicious of jumps that are primarily momentum driven unless there is a fundamental change that drives the sentiment. Perhaps this is an area Ed could provide commentary on?
I see Drax (LON:DRX) is up this week but l don't see why the Momentum is up, share price hardly changed and AFAIK, figures have not been updated, is it a glitch?
I noticed that and when you check it's StockRank it shows its down -13 in the last 30 days. ??!
SR is 92 now, how can it be down 13?
Momentum is up and down like a yo-yo.
The momentun rank is down due to the analysts markikng down EPS estimated, plus the share price has been flat.
But Momentum score is up recently, that is why the SR is now 92. It has gone up from 40 to 60, in the last week.
Are you talking about Drax (LON:DRX) ?
Yes.
What ranking set setting are you using?
Go to account settings ... bottom option - Ranking Set
Local.
What data are you using to say that momentum rank has gone from 40 to 60?
Because looking at the StockReport there is very little upside wrt momentum.
Share price falling, Analyst EPS figures falling, rel strength, price vs 52 wk high all falling.
I am using the Stockreport prints, it was 40 on the 23rd June: https://s3.eu-west-1.amazonaws..
This is why l was querying the Momentum score.
If you look at the today page, you should see Drax is the top riser to over SR 90, 82 to 92.
I see this morning it's corrected itself or been corrected. Now only down -2 in the last 30 days.
I notice in the comments a couple of people have mentioned screening for stock rank rising from the previous day, but Ed mentioned in the article that he was looking for the stock rank to rise 10 points in the last week, which cant be screened for. Some of the shares stock rank has risen considerably in one day. Have Stockopedia researched 1 day stock rank rises, rather than one week rises, and was the effect less pronounced, because currently it would be easier to screen for 1 day stock rank increases. Also other software gives you price history of a stock-- open, high, low and close and volume. Could Stockopedia provide this but instead provide the rankings for each day historically. I guess Stockopedia have these figures as they provide this in chart form for stock ranks, and I imagine it wouldnt take too much data space if you just provided in data form (though I`m no IT expert so I may be wrong on this).
Ed
Have you looked at any other time frames other than 12 months? I presume the 12 months is to have a bit of uniformity to compare with the NAPS
Thanks
Ted
Hi Ted, good question. Whether Ed looked at other holding periods is really one for him, and he's away on holiday at the moment, so I'll flag it so he can answer it properly when he's back.
Hi Ed,
At the moment I screen for stock rank jumps manually using Stock Rank above 90 and "stock rank day before" below 90. Same can be done for V, M and Q separately. However this is not ideal.
It would be better to have a "change in stock rank filter" (such as greater than 5 or 10) (maybe with a time frame condition) such as in last day/week/month etc.
I hope you can give us some good news in the webinar coming up.
I keep my own database of stockranks, updated most weekends. The StockRank Jump candidates I have identified so far:
20/6/26
IG Design (LON:IGR) SR 70-94
Zegona Communications (LON:ZEG) SR 61-95
PayPoint (LON:PAY) SR 72-93
27/6/26
Gear4music (HOLDINGS) (LON:G4M) SR 85-96
CT Automotive (LON:CTA) SR 77-92
Fuller Smith & Turner (LON:FSTA) SR 76-91
Volex (LON:VLX) SR 80-90
Dialight (LON:DIA) SR 64-90
I spotted IG Design (LON:IGR). Price has pulled back from high. Watching for an entry point.
Yes, the IG Design (LON:IGR) price has fallen a bit since the results. Strange as there is no obvious discepancy between the reults and the April trading update, other than the TU is slightly more upbeat and mainly in $ whereas the results are in £ which may lead to confusion.
Hi Ed,
I can feel some new strategies coming on.
Some questions for the webinar to answer or even now if you have the data ...
1) How do I screen for the jump?
2) Can I screen a variety or ranks, Q, V, M, G and combinations of them?
3) Have you only looked at the UK markets?
4) Do you have a sense of which transitions work best?
For example, it is mostly Contrarian type stocks that suddenly get analyst attention that drives price momentum?
Or perhaps Turnarounds that fix their buinesses model release a set of results that increase the quality rank. If that was the case I would also expect a jump in momentum as analysts also see the results and markup earnings both of which drive price action.
Interesting times.
Thanks
Phil
Good points, you are ahead of me there Phil.
Ed, I would love to know if there will be a screen available. At the moment the only way I know to quickly check for stock rank jumps is the daily update on the Home screen. This would be very time intensive if it meant checking that list daily then researching. An on demand screen would be a great tool to have.
Must say all this research from Stockopedia in recent months has been fabulous and great confidence building. Combined with Phil's stock screen and greater use of some of the screens and stock ranks I'm seeing some very positive results on my portfolio re-balancing at the moment. (I am being a little honest though in acknowledging to myself that we are in a bit of a bull market at the moment so would be interested in the results in bear markets too.)
Phil & Wildshot
Seems a few of us are experimenting already.
I’ve set up a simple screen for now :
Stockrank > 90
Stockrank previous day < 85 (available on screen rules via dropdown of Stockrank)
Market Cap > 50m
2 shares today Volex (LON:VLX) and ILPRA SpA (BIT:ILP). Ignore Market Cap and you can add Opmobility SE (EPA:OPM)
Role on the webinar.
Stock rank previous day should be less than 80 , currently no company showing
None this morning at less than 85 either. All +90 are from the 87-89 range. I'll wait for the webinar before I finalise my thoughts.
Very interesting, many thanks for your hard work.
It seems obvious that a change in situation would be the strongest driver of a change in share price. So these results are extremely plausible and are not a quirk in the data.
A few points I am curious about:
I assume the ranks change when annual and semi annual results are released. The great majority of companies have December and March year ends which means these changes are bunched. On the other hand perhaps momentum changes a lot, so the effect is throughout the year. It would be useful to know the average volatility of the factor score in a firm and the bunching of the effect.
Any idea how long firms stay in each decile measured in weeks or months?
The number of changes would be useful, as a percentage of the companies in the population that year. I guess that very few firms jump more than 10 points into the top decile. Factor investing i believe is a blunderbuss approach and not a sniper approach, you need large portfolios in order to capture the effect.
The size problem was mentioned, it would be useful to divide the sub £350m companies into two parts. Maybe most of the effect is in the sub £100m firms?
The promotion effect seems to be 15.9% - 10.7% = 5.2%. The demotion effect is less clear, it needs to measure the 12 month return of those demoted compared to those not demoted.
Sorry! The calculation of the promotion / demotion effect is more complicated in deciles below the top decile because they contain risers and fallers.
Looking forward to the webinar, it promises to be one for the ages!
Epiychia. I assume the ranks change when annual and semi annual results are released. The ranks change much quicker than that though of course results when announced are likely to do this as well. I think may boil down to the 50 day Moving Average which is being recalculated daily. I record the 50d MA 's in my protfolios at the end of each week, some may remember me saying so but I think it tells me when to sell rather than when to buy.
Thanks, the value and quality metric changes every 6 months and the V and Q rank could change daily if another company releases accounts. The momentum rank changes daily i assume.
The value rank changes daily based on the price movement of the stock in question too.
A big spike up in price means Value rank decreases and momentum rank increases
Hi Epitychia, thank you, this is a brilliant comment, exactly the kind of thinking Ed loves to get back. He's away on holiday at the moment so I'll make sure he sees all of this when he returns. A lot of it sounds like webinar territory, so I hope you'll come along on 23 July.
Hi Ed,
A great piece and I'm looking forward to the webinar...
A first question for you - can you please explain "first weekly close back below 80"?
Does it mean that at the end of the week the StockRank is below 80? Or that it averaged 80 during the week? Or something else...
And how long does the StockRank take to react to news? Is good/bad news reflected in the Ranks the next day? Or can it take longer to percolate through?
Hi Richard, really good question, and I'd rather get it spot on than guess at the exact mechanic, so I'll let Ed confirm when he's back from holiday. I've flagged it for him.
Hi,
A further question, although Ed may already have an answer to this.
The outperformance of StockRank jumpers is a basket effect, so how do we use this to construct a portfolio rather than buying individual StockRank jumpers as and when they happen ?
My response would be, verfiy if it's an observable feature across multiple markets and build a global/regional strategy to build the basket
How would you verify whether it's an observable feature across multiple markets? If the Jump effect is based on weekly rather than daily jumps, then its almost impossible to verify for the uk market at present, let alone any other. It will be interesting to hear Ed's solution.
Well if you had a tool that could automate screening (buying and selling into a portfolio based on a screen and a set of rules) you could run this strategy over time building a portfolio and an observable history. Quite a flight of fancy eh ... or is it?
Currently this can only be done on a daily basis, e.g. stock rank today and stock rank yesterday but I'm sure Ed and and the team could add some more refinement to these comparisions and add them to other ranks.
Imagine if you could do that with any screener rules ... buy in, adapt stop losses (yeah stop losses), and the exit according to a set of exit rules.
Imagine all the investors, researching factor based investing strategies, woooo hooo wooohhhhoooo.
You may say I'm a dreamer ...
(Apologies to John Lennon)
Yeah, I don't think he had stock market investors in mind when he sang that :-)
Well my goal is to get everyone investing or at least reduce the barriers
And like Stockopedia itself, you're doing a great job - thank you