Towards a taxonomy of stock market winners

Peter Lynch's great classic “ One up on Wall Street" was one of the first books to open my eyes to the fact that there are many different ways to make money from the market. He liked to categorise his winning stock selections as: 'slow growers', 'stalwarts', 'cyclicals', 'fast growers', 'turnarounds' and 'asset plays'. I'd always been a die-hard “growth at a reasonable price" investor before coming across Lynch, but once I'd digested his thinking I started to become more aware that there were different approaches to the same goal.
Of course most of us are not Peter Lynch. The great man had the excellent 1980s Fidelity team around him who perhaps helped him understand the different nuances of investing in asset plays and fast growers . One of the mistakes that many part time investors make is trying to be jack of all trades, so when my own early dabbles in mining stocks were not wildly successful (Sardinian Gold?) I realised it was time to retreat back to the comfort of my own circle of competence. But the idea of classifying archetypes of stock always stuck.
Aligning with the payoffs
Finance academia is a busy place, and over the last 30 years they have come to a broad consensus about which fundamental and technical indicators best payoff in stocks. They call these indicators 'factors' with the most powerful and well studied agreed to be company size, quality, value and momentum.
You don't need to get complicated to have success in the stock market as long as you align your portfolio with these payoffs. While the Stockopedia StockRanks take a broad approach to assess quality, value and momentum - it's quite simple to put together a high probability investment strategy using simple criteria such as low P/E (value), high ROE (quality) & new 52 week highs (momentum).
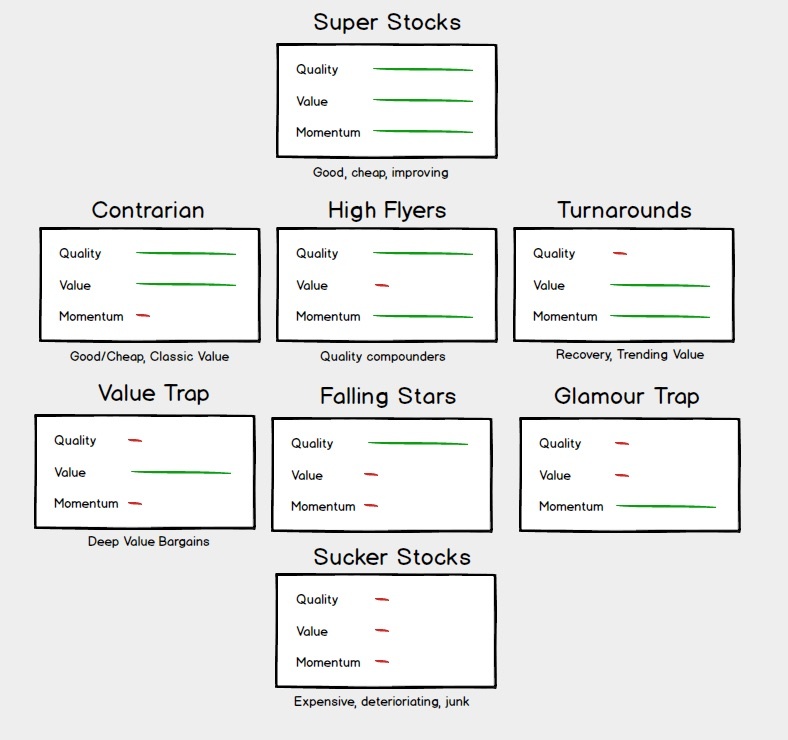
If we allow ourselves to take inspiration from Lynch we can realise that there are eight different combinations of the three quality, value and momentum factors. Each of these combinations illustrates a different archetypal profile of a trade… a taxonomy of winning and losing stocks.
While what follows are all gross generalisations, they do provide a very useful mental model that is exceptionally useful in understanding the nature of a stock, and what might be worth watching out for. Let's dive right in….
Winning Profiles
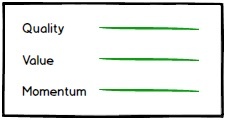
Super Stocks
Q: high, V: high, M: high (good, cheap, improving)
The term “Super Stock" was first used by the late, great Professor Robert Haugen in “ The Inefficient Stock Market". Haugen was the first to show that good, cheap, improving shares have a tendency to beat the market and we honour the great man by borrowing the phrase here. It can often go against one's instincts buying these kinds of shares as cheap stocks have problems, good stocks are boring, and stocks at highs are scary - this may be why they so often exceed expectations.
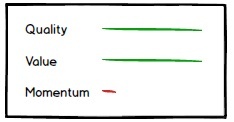 Contrarian
Q: high, V: high, M: low (good & cheap, but declining)
This is the domain of the classic Value Investing style so favoured by investors like NeilWoodford, Warren Buffett and Joseph Piotroski. Warren Buffett summed it up best by saying “I like buying quality merchandise when it's been marked down". Joel Greenblatt popularised this strategy of buying good, cheap stocks in his excellent “ The Little Book that Beats the Market".
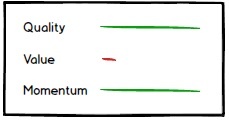 High Flyers
Q: high, V: low, M: high (good & improving, but expensive)
These are the stock market stars, the ones that all fund managers want to be able to say they own. They tend to be very high quality growing stocks with a history of beating estimates, just don't expect this kind of stock to come cheap. Bill O'Neil's classic “ How to Make Money in Stocks" is one of my favourite books - he shows that if you want to own the really big winners in the market you'd better be willing to pay a premium P/E ratio. Amongst this category of stocks may lie some of the great multi-year compounders - just watch out, when the momentum finally turns these can easily turn into falling stars (see below).
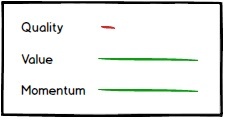 Turnarounds
Q: low, V: high, M: high (cheap & improving, but low quality)
There's nothing better than picking up a seemingly broken stock in the bargain basement and watching it multi-bag, like Paul Scott did with Trinity Mirror in 2013. Value and Momentum are widely regarded as the two strongest factors driving asset returns. Even if a stock is currently losing money, the first indicator of recovery is often an improving share price - so buying cheap stocks on the rise can be hugely effective. James O'Shaughnessy in his classic “ What Works on Wall Street" found that“Trending Value is the best performing strategy since 1963".
Losing Profiles
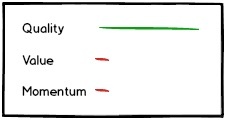 Falling Stars
Q: high, V: low, M: low (good, expensive, deteriorating)
Oh you don't want to be on the wrong side of a High Flyer when it turns. When brokers start aggressively cutting their estimates on high quality, premium shares look out below. This is the classic profile of stocks like ASOS when they start to drop. Falling Stars are the bane of fund managers around the world.
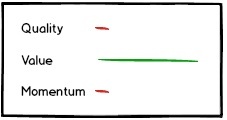 Value Traps
Q: low, V: high, M: low (junk, cheap, deteriorating)
The great modern value investor, Seth Klarman, has warned “Value Traps are a dagger through the heart of value investing". This is the domain of broken business models, sectors in decline and generally one of the worst places to be in the market. The key lesson to learn is to give loss making, out of favour, cheap shares a wide berth unless they start to show confirming factors. Learn more about avoiding value traps here.
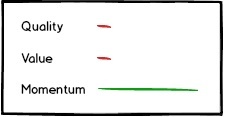 Glamour Traps
Q: low, V: low, M: high (junk, expensive, improving)
These stocks may be currently in vogue with strong share prices & sentiment, but deteriorating fundamentals and high valuations can't continue to contradict. The valuation has to fall, or the fundamentals have to improve… either way something has to change and the risks are to the downside.
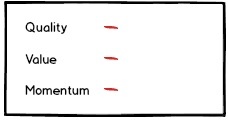 Sucker Stocks
Q: low, V: low, M: low (junk, expensive, deteriorating)
Why on earth anybody would want to own stocks that have literally nothing going for them is completely beyond me - but many thousands do ! These tend to be small cap, loss-making, jam-tomorrow, story stocks that are in the process of losing the market's faith. You can be pretty sure that a stock like this comes with a really promising idea … and an emergency fund raising just around the corner. Give these a wide berth… or use a bargepole.
Statistics beat Stories
What we've found in our StockRanks research is that the returns in the global stock markets have favoured the winning profiles, while stocks with losing profiles have on average underperformed. We've seen in the last week a classic pair of case studies… a 'super stock' outperformer in Dart Group (StockRank 100) shooting up 18% on a moderate announcement, and a classic 'sucker stock' laggard in Synety (StockRank 1) collapsing 35% on placing news.
The key and critical lesson is to avoid buying a stock that is displaying less than two of the three QVM payoffs (i.e. one of the losing profiles). One should try to avoid buying a value stock unless it's either good or improving, avoid momentum stocks unless they are good or cheap, and shun expensive glamour stocks as soon as they accelerate into declines.
Playing the changes
Watching for the turning points between categories becomes much easier with a sound framework and a real world case study illustrates this well. While most investors think of housebuilders as housebuilders, their run of the last few years is quite instructive - in my mind they've moved through several of the categories listed above.
Back in 2011 the UK housebuilders were in deep value territory.... they had been terrible 'Value Traps' from 2008 to 2011, losing buckets of money while the share prices collapsed. But in late 2011, the shares initially started gaining, exhibiting the classic value & momentum 'Turnaround' signs. As the companies returned to profitability they displayed the whole spread of attributes - good, cheap, improving - pushing them into 'Super Stock' territory - the share prices soared.
Of course as prices rise, valuations often do too and now stocks like Barratt Developments are moving towards a premium valuation. These stocks are perhaps becoming 'High Flyers' - certainly they are at a premium valuation for their cyclical nature. What happens next is anyone's guess… but given the above framework, I know what I'll be looking for as a first indicator of trouble.
Sticking to your own rules
Everyone should be warned that the stock market is a den of thieves. Unless you have steel, discipline and the capability to say no to 'opportunities' and the ability to admit when you have got it wrong you can be at the mercy of your own whims. It's absolutely crucial to build an investment process that fits with your own psychology… don't bother with momentum strategies if they freak you out… stick to good, cheap stocks and a contrarian approach. Most importantly of all, write down your own rules and stick to them.
To find out more about the taxonomy of stock market winners, you can browse through the entire series:
- Towards a taxonomy of stock market winners
- Contrarian stocks - how going against the crowd can put you ahead
- High Flyers - how to beat the market in expensive and highly priced shares
- Turnarounds - how to find value shares that are bouncing back
- Falling Stars - how to handle glamour shares that fall from grace
- Value Traps - how to avoid bargain stocks that might never recover
- Momentum Traps - how to avoid the siren song of overhyped stocks
- Sucker Stocks - why do we love to own the worst prospects in the market?
Disclaimer
This is not financial advice. Our content is intended to be used and must be used for information and education purposes only. Please read our disclaimer and terms and conditions to understand our obligations.
13 comments
Hi Ed,
I caught up with the StockRank Styles Webinar from June last year earlier and I've heard your recent encouragement to consider a high VM strategy given their excellent performance.
I guess it got me thinking about the migration path across the StockRank's taxonomy.
For me (and I guess for any investor) I am looking for a price appreciation over time and what that means in terms of StockRank is that with all other factors being constant that as price appreciates ValueRank decreases and Momentum Rank increases.
The phenomenon means that if all other factors are fixed as the price appreciates:
1) A High Flyer (High QM) will increase it's QM rank as its proximity to 52 week high decreases and RS is strong. A high QM stock with a strong price momentum is a virtuous circle and as such a High Flyer can hold onto this status for a prolonged period which reduces churn and transaction costs.
2) A Turnaround (High VM) will increase its Momentum Rank whilst the Value Rank is eroded. This means that the Turnarond will migrate towards a Momentum Trap as price appreciates. The quicker the price appreciates the sooner this migration will occur and this might well encourage one to sell, increasing churn and transaction costs.
3) A Contrarian (High QV) will increase its Momentum Rank whilst the Value Rank is eroded. This means the Contrarian will migrate towards a FallingStar or if the Momentum Rank increases enough towards a High Flyer
For the Turnaround scenario (which have generated great returns) it'd be interesting to know the typical timespan for the migration and where the gains are made, e.g. are the majority of the gains made when a Turnaround or do they still continue as the stock transitions into a Momentum Trap? Is the quarterly rebalancing of the Turnaround portfolios selling the stocks before or after they turn into Momentum Traps?
I'd be interested in any insights you have
Cheers
Phil
Phil - I have to admit we haven't done any extensive research around Style persistence (yet). We will at some point I'm sure.
I think your comments have significant merit. But I would add that one has to consider the relative scale of the rankings. I don't think you can consider the V and M rankings to be a perfect counterpoint. Often Value stock valuations are so low that prices need to shiftconsiderably before they can be considered moderately valued. So from a VM perspective, the high VM often persists as momentum rises.
Also High Momentum often is a leading indicator of Quality Rank improvements (especially given the earnings momentum weighting).... so the turnaround style can easily migrate to fully rounded QVM rankings. I've seen that happen regularly.
Tom Firth here has taken over the research in this area - we're actually working on some StockRank Style Classifications for the stock reports. We are using some fuzzy classification techniques using data science libraries as we aren't keen on using hard-cutoffs for classifications. Hard cutoffs can be great for building strategies, but we're keen to create broader groups of Style categorisations for the stock reports. Hopefully we'll have something live in the not too distant future. It's being baked into our compute architecture at the moment.
The stockrank deltas would be really useful in this scenario in order to screen cheap stocks with increasing momentum and poor but improving quality.
Thanks for the reply!
Phil
Hi Ed, excellent idea. I suppose most people have these categories floating around in their heads but it's good of you to lay them out more formally.
A good example contrarian stock highlighted by this approach is £MN where the price is trying to break out of the base around $12
It doesnt quite make the grade in terms of Ichimoku signals, but it's going on my watchlist. I need the price to rise to around $14 which will take the price through cloud and it will bring the purple Chikou (lagging line) through the cloud too. Hopefully then resistance should be limited.
Another strategy might be extending the % vs 52w high to add % vs 30d high, % vs 90 day high and % vs 180 day high
To be honest the chart signals don't give me what I need. What I'm looking for is change of trend, i.e. from bear to bull or from congestion to bull.
I personally use Ichimoku charts to help me spot that in a clearly defined way and the chart signals you provide aren't sophisticated enough (at present). So what I currently do is filter, download csv and pump the data through some software I've written that identifies Ichimoku Chart signals. That gives me a list of charts and I can filter them by signal. I then take a look at each chart, take a view then look at the StockReport, etc.
However even this isn't ideal as it highlights stocks that have broken out and that can be too late. I'm looking for stocks crossing the breakout cusp and that's where the momentum delta helps to thin the field.
A chart signal alternative is to identify where a consolidation rectangle has formed over a period as the price has become range bound and then identify a break north of that price. Now that would be really useful and is actually what I'm really looking for.
Hi Ed,
Inspired by your article I've just been building a Contrarian Screen, i.e. high quality and value with mediocre/low momentum.
However, I want to spot these stocks as they start to gather momentum and breakout. So it would be useful if I could screen for momentum delta (i.e. change in momentum).
Presently I'm running my filter, downloading a CSV and running the stocks through my own Ichimoku Chart scanner looking for breakouts. The addition of the momentum delta would speed this up no end.
Thanks
Phil
Phil - I've been having the same thoughts. What would be great is one of the following... either make the various StockRank deltas screenable (1m/3m etc), and/or make ChartSignals screenable.
We are working on both... but blimey it's all a lot of work and a tsunami of data !
The introduction to that classic, "One Up On Wall Street" is worth reading, it's perhaps quite
relevant to the discussion there was yesterday around Synety and story stocks in general. I
actually did re-read it yesterday. Even though it was written twenty-five years ago, it remains
an essential read for any private investor, imo.
Very interesting and informative article Ed. I would say that my natural style is Contrarian, in that I look for good businesses (high quality/value) that have perhaps fallen on lean times due to external/cyclical issues or businesses which have been poorly performing but with a change of management. Standard Chartered (LON:STAN), Balfour Beatty (LON:BBY) and Tesco (LON:TSCO) are examples of the latter. However as a contrarian it's always difficult to judge when to start putting in money and generally speaking I usually invest slightly too early. Perhaps I should look at indicators such as improving broker forecasts or look to invest after the new CEO has 'kitchen sinked' the bad news as well as paying attention to momentum. When is the highly anticipated smart money module going to be launched!!?
Good story Ed (almost worth the subscription), but needs a little meat on the bones:
Define: High, Medium & Low
Back-testing?
Rotation time-scale?
Keep up the thinking.
Bonitabeach
Ed, you may need to edit this bit:
High Flyers
Q: high, V: high, M: low (good & improving, but expensive)
Should be: Q High, M High, V Low
Edmund